
Interactive analysis of mass spectrometry data

a mass spectrometry and data technology, applied in the field of interactive analysis of mass spectrometry data, can solve the problems of difficult analysis, and in particular, the difficulty of concurrent analysis of such multiple trials, and achieve the effect of improving the accuracy of the analysis

Active Publication Date: 2020-12-29
PROTEIN METRICS LLC
View PDF68 Cites 5 Cited by
  • Summary
  • Abstract
  • Description
  • Claims
  • Application Information

AI Technical Summary

Benefits of technology

The patent describes a system and method for interpreting and reporting on data from mass spectrometry analysis of proteins. The system allows users to receive and process multiple trials of data from multiple instruments and combine them into a single data flow. This simplifies the analysis of multiple trials and allows for the simultaneous generation of reports. The system also allows users to create custom reports by selecting and modifying data from a table and a graph. The method includes displaying an inspection view with a table window and a spectrum window, receiving user selections, and displaying a report view with pivot tabs for easy analysis. The technical effects of this system and method include improved data interpretation and reporting capabilities, as well as improved efficiency and flexibility in analyzing multiple trials of data.

Problems solved by technology

It is common to run multiple trials of the same protein, but it has proven difficult to analyze, and in particular, to concurrently analyze, such multiple trials.

Method used


Image

  • Interactive analysis of mass spectrometry data
  • Interactive analysis of mass spectrometry data
  • Interactive analysis of mass spectrometry data

Examples


examples

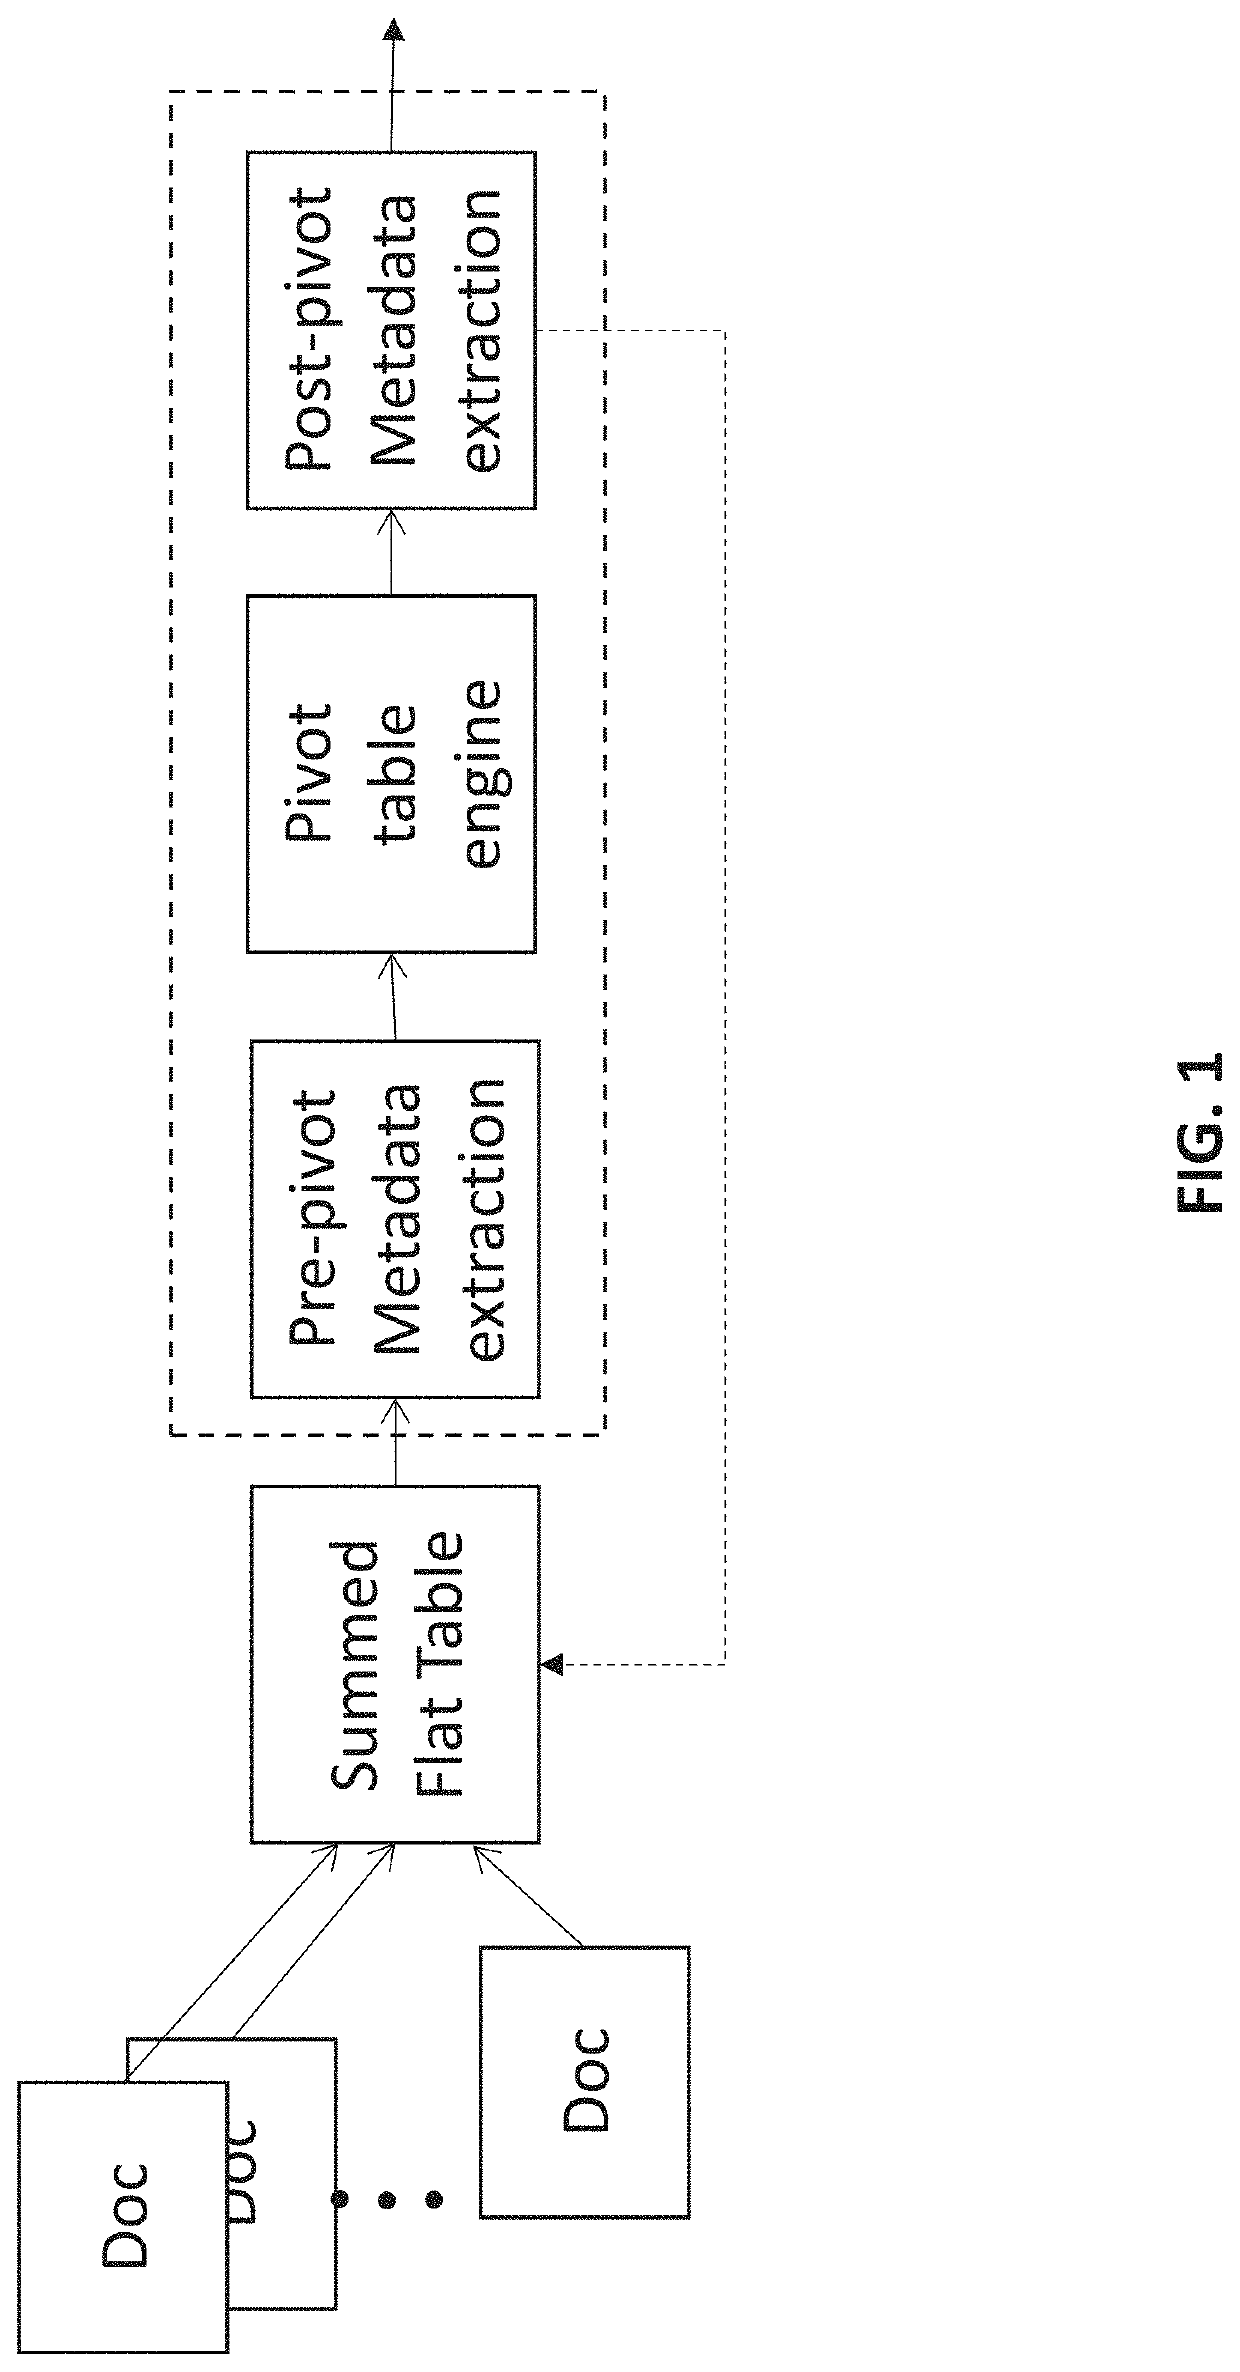
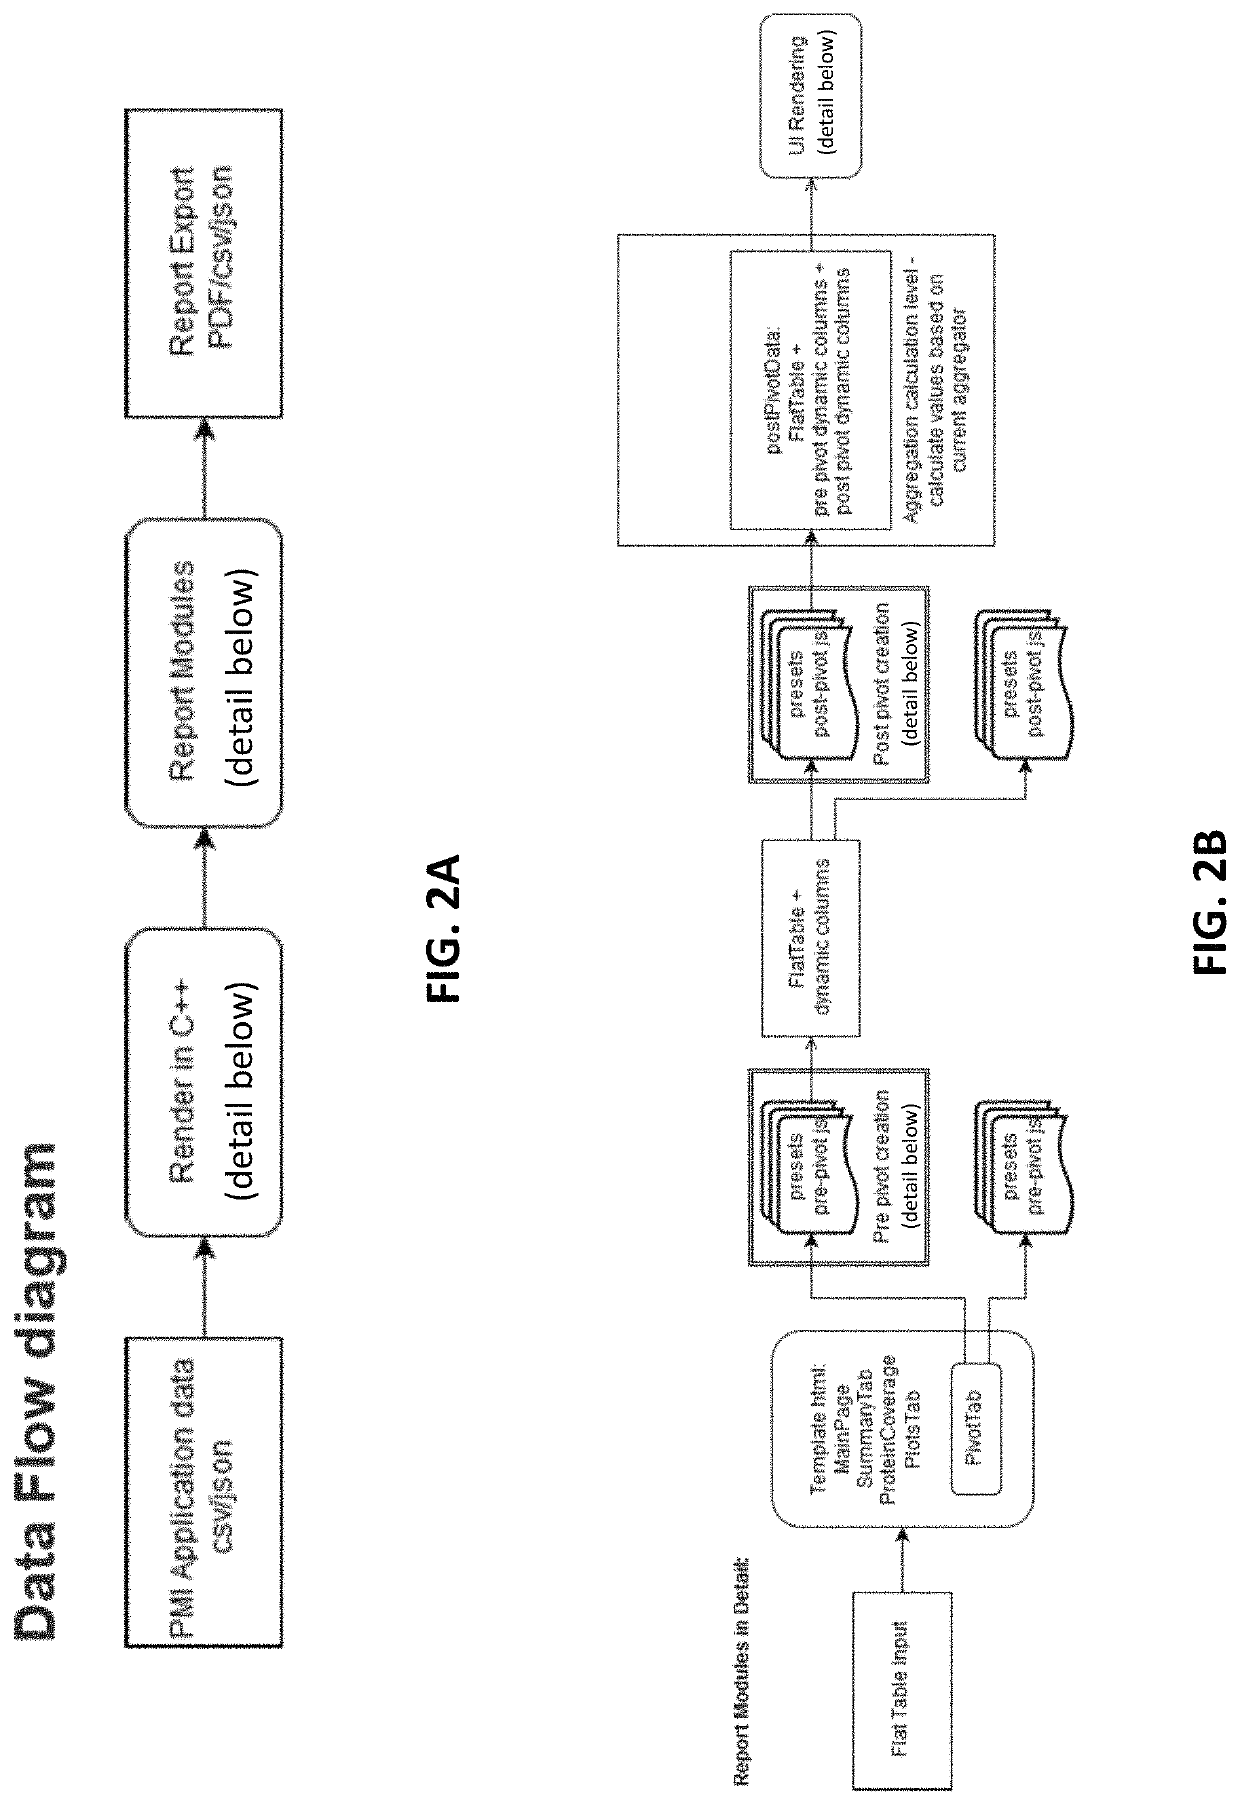
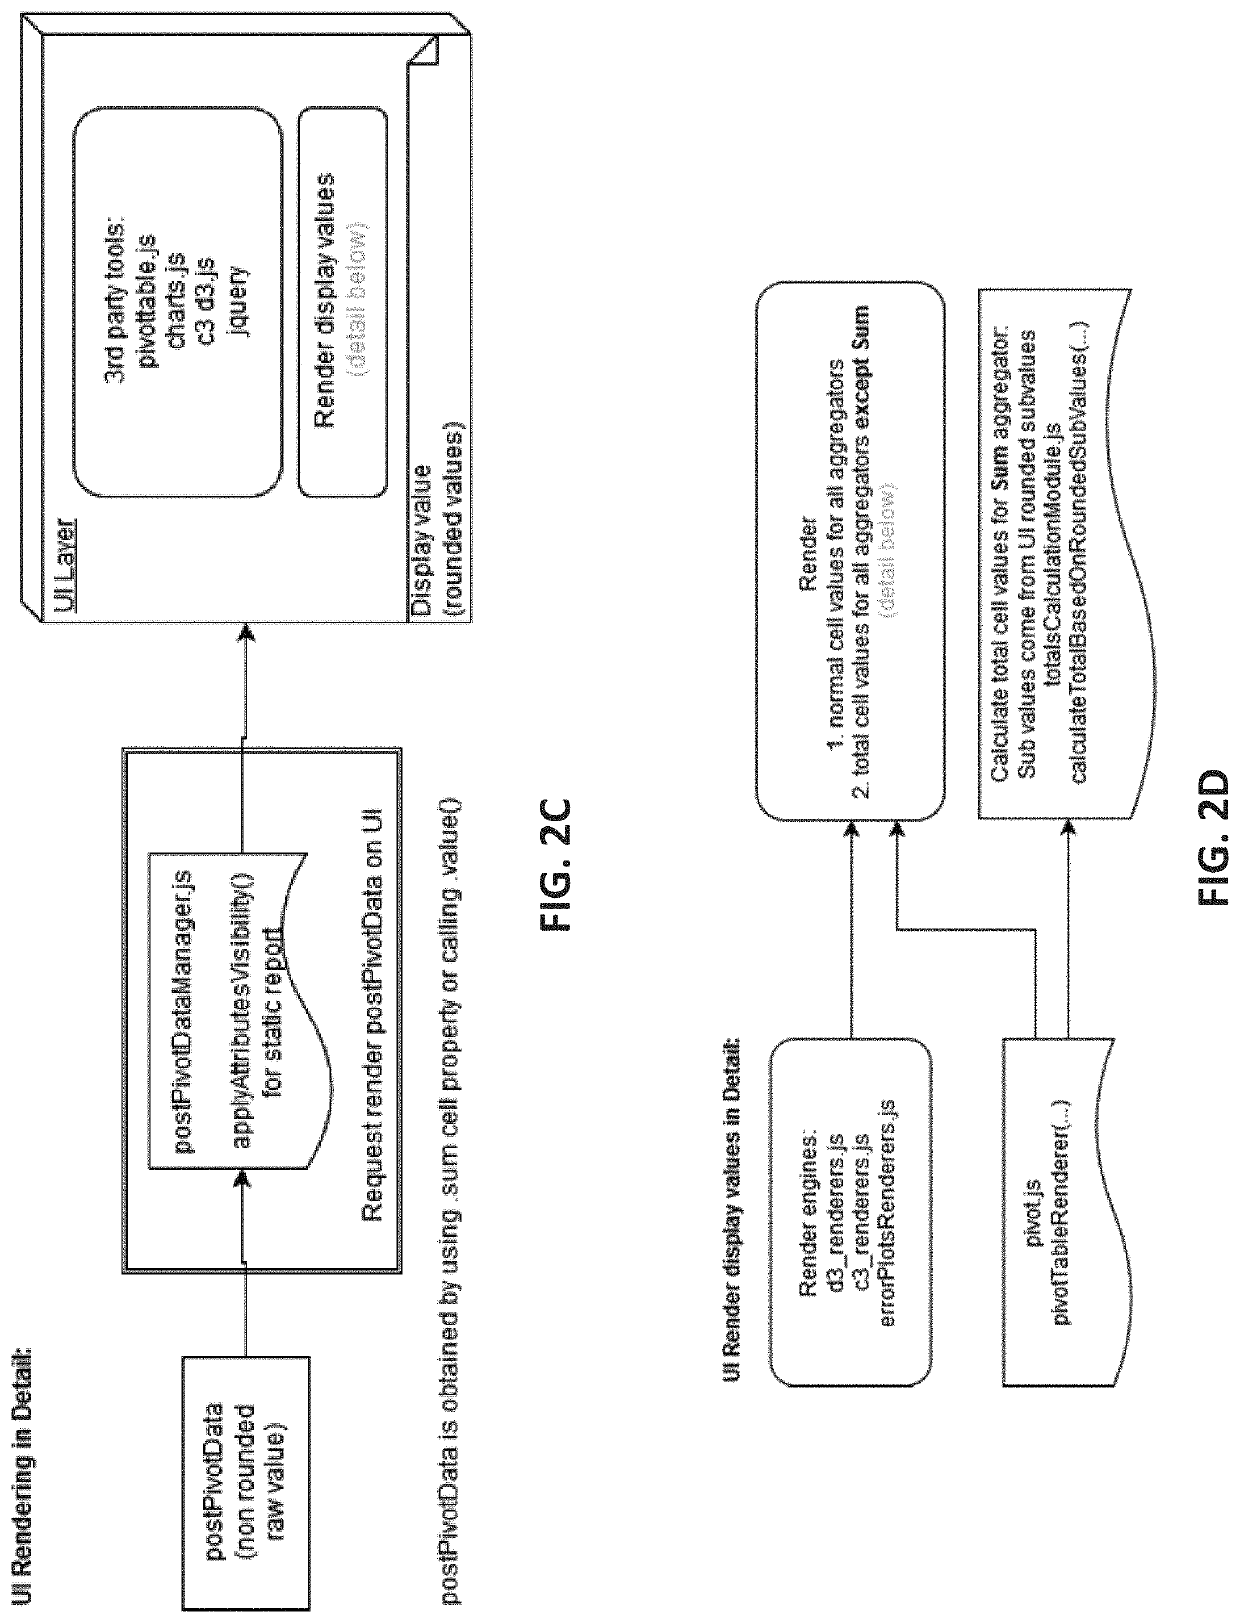
[0072]FIGS. 3-39D graphically and textually illustrate exemplary portions of the user interface of the apparatus and methods described herein. The user interface can be used to generating a configurable pivot table report summarizing all or a portion of the mass spectrometry data.

[0073]According to some embodiments, the user interface includes an inspection view component and a report view component, which may be viewed in separate windows. FIG. 39A shows an exemplary inspection view component of the user interface, and FIGS. 39B-39D show exemplary report view components of the user interface. The user may be able to dynamically select all or a subset of data in the inspection view component for displaying in a more concise, consolidated or readable form in the report view component. In some embodiments, the user may be able to toggle between the report view component and the inspection view component, e.g., to quickly determine how selected data in the inspection view component eff...


PUM


Abstract

This invention relates to graphical user-interactive analysis of data, including in particular, mass spectrographic data analysis, as well as methods and software for generating and using such. One aspect provides user-customizable reports, including methods and apparatuses for generating customizable pivot tables and graphs specific to mass spectrographic data.

Description

CROSS REFERENCE TO RELATED APPLICATION[0001]This application is a continuation application from U.S. patent application Ser. No. 16 / 149,026, filed Oct. 1, 2018, and titled “INTERACTIVE ANALYSIS OF MASS SPECTROMETRY DATA,” which claims priority to U.S. Provisional Patent Application No. 62 / 566,247, filed Sep. 29, 2017, and titled “INTERACTIVE ANALYSIS OF MASS SPECTROMETRY DATA,” each of which is incorporated herein by reference in its entirety.INCORPORATION BY REFERENCE[0002]All publications and patent applications mentioned in this specification are herein incorporated by reference in their entirety to the same extent as if each individual publication or patent application was specifically and individually indicated to be incorporated by reference.FIELD[0003]This invention relates to graphical user-interactive reports for use in mass spectrometery (MS) based analysis of proteins, as well as methods and software for generating and using such.BACKGROUND[0004]Due to the complexity of p...

Claims


Application Information

Patent Timeline
Patent Type & Authority Patents(United States)
IPC IPC(8): H01J49/00H01J49/02
CPCH01J49/0036H01J49/02
Inventor KIL, YONG JOOCARLSON, ERIC
Owner PROTEIN METRICS LLC
Learn More