Methods and systems for providing a visualization graph

a visualization graph and visualization system technology, applied in the field of methods and systems for providing a visualization graph, can solve the problems of limiting the information the user can acquire from the system, ignoring important related entities, and suffering from conventional visualization graph drawbacks

Active Publication Date: 2005-05-19
SAP AG
View PDF54 Cites 41 Cited by
  • Summary
  • Abstract
  • Description
  • Claims
  • Application Information

AI Technical Summary

Benefits of technology

[0009] By providing the possibility to display entities that are indirectly related to the “focus” entity based on the current context, the user is able to collect additional information even if there is no direct relationship between those entities and the focus entity. Thus, the user may “jump” from context to context within the graph. The present invention allows a user to find relevant connections in large amounts of data. The user is also able to navigate and explore knowledge domains in a visual way.

Problems solved by technology

However, conventional visualization graphs suffer drawbacks.
One problem with conventional visualization graphs is that the user can only see a certain number of entities at once and thus potentially misses important related entities.
This is limiting in terms of the information the user can acquire from the system.

Method used


Image

  • Methods and systems for providing a visualization graph
  • Methods and systems for providing a visualization graph
  • Methods and systems for providing a visualization graph

Examples


Embodiment Construction

[0019] The following detailed description refers to the accompanying drawings. Wherever possible, the same reference numbers are used in the drawings and the following description to refer to the same or similar parts. While several exemplary embodiments and features of the invention are described herein, modifications, adaptations and other implementations are possible, without departing from the spirit and scope of the invention. For example, substitutions, additions or modifications may be made to the components illustrated in the drawings, and the exemplary methods described herein may be modified by substituting, reordering or adding steps to the disclosed methods. Accordingly, the following detailed description does not limit the invention. Instead, the proper scope of the invention is defined by the appended claims.

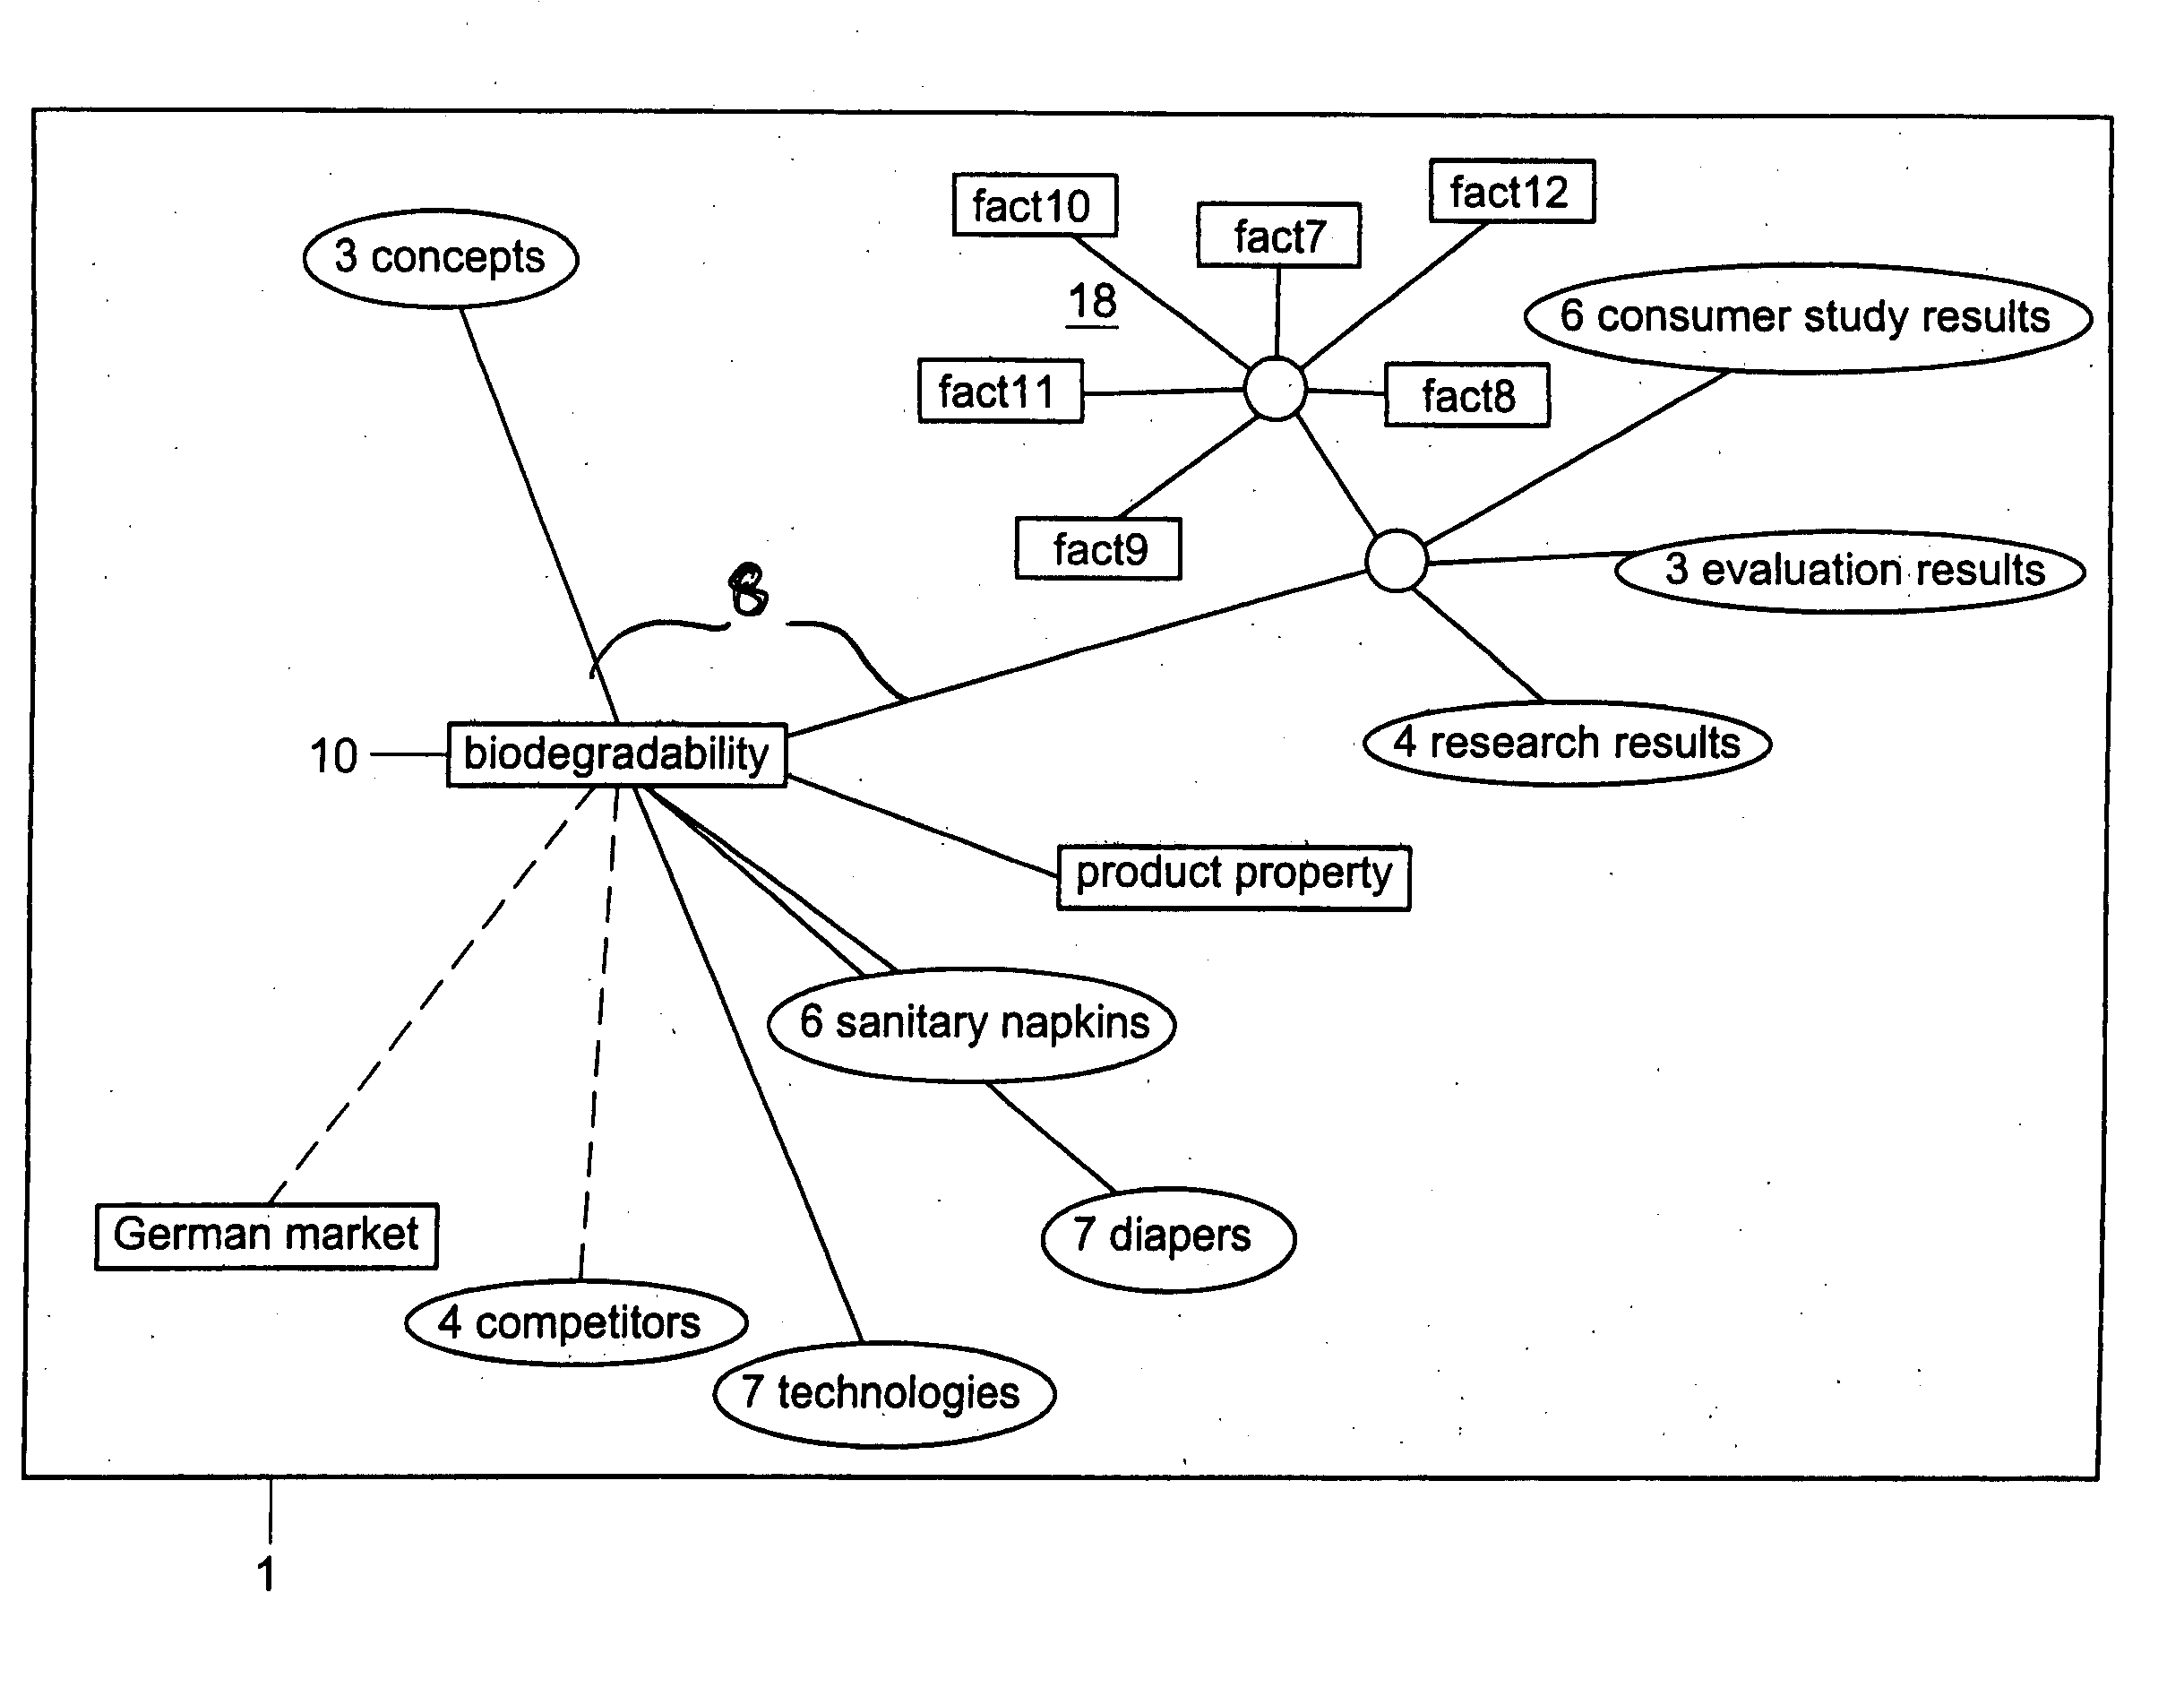
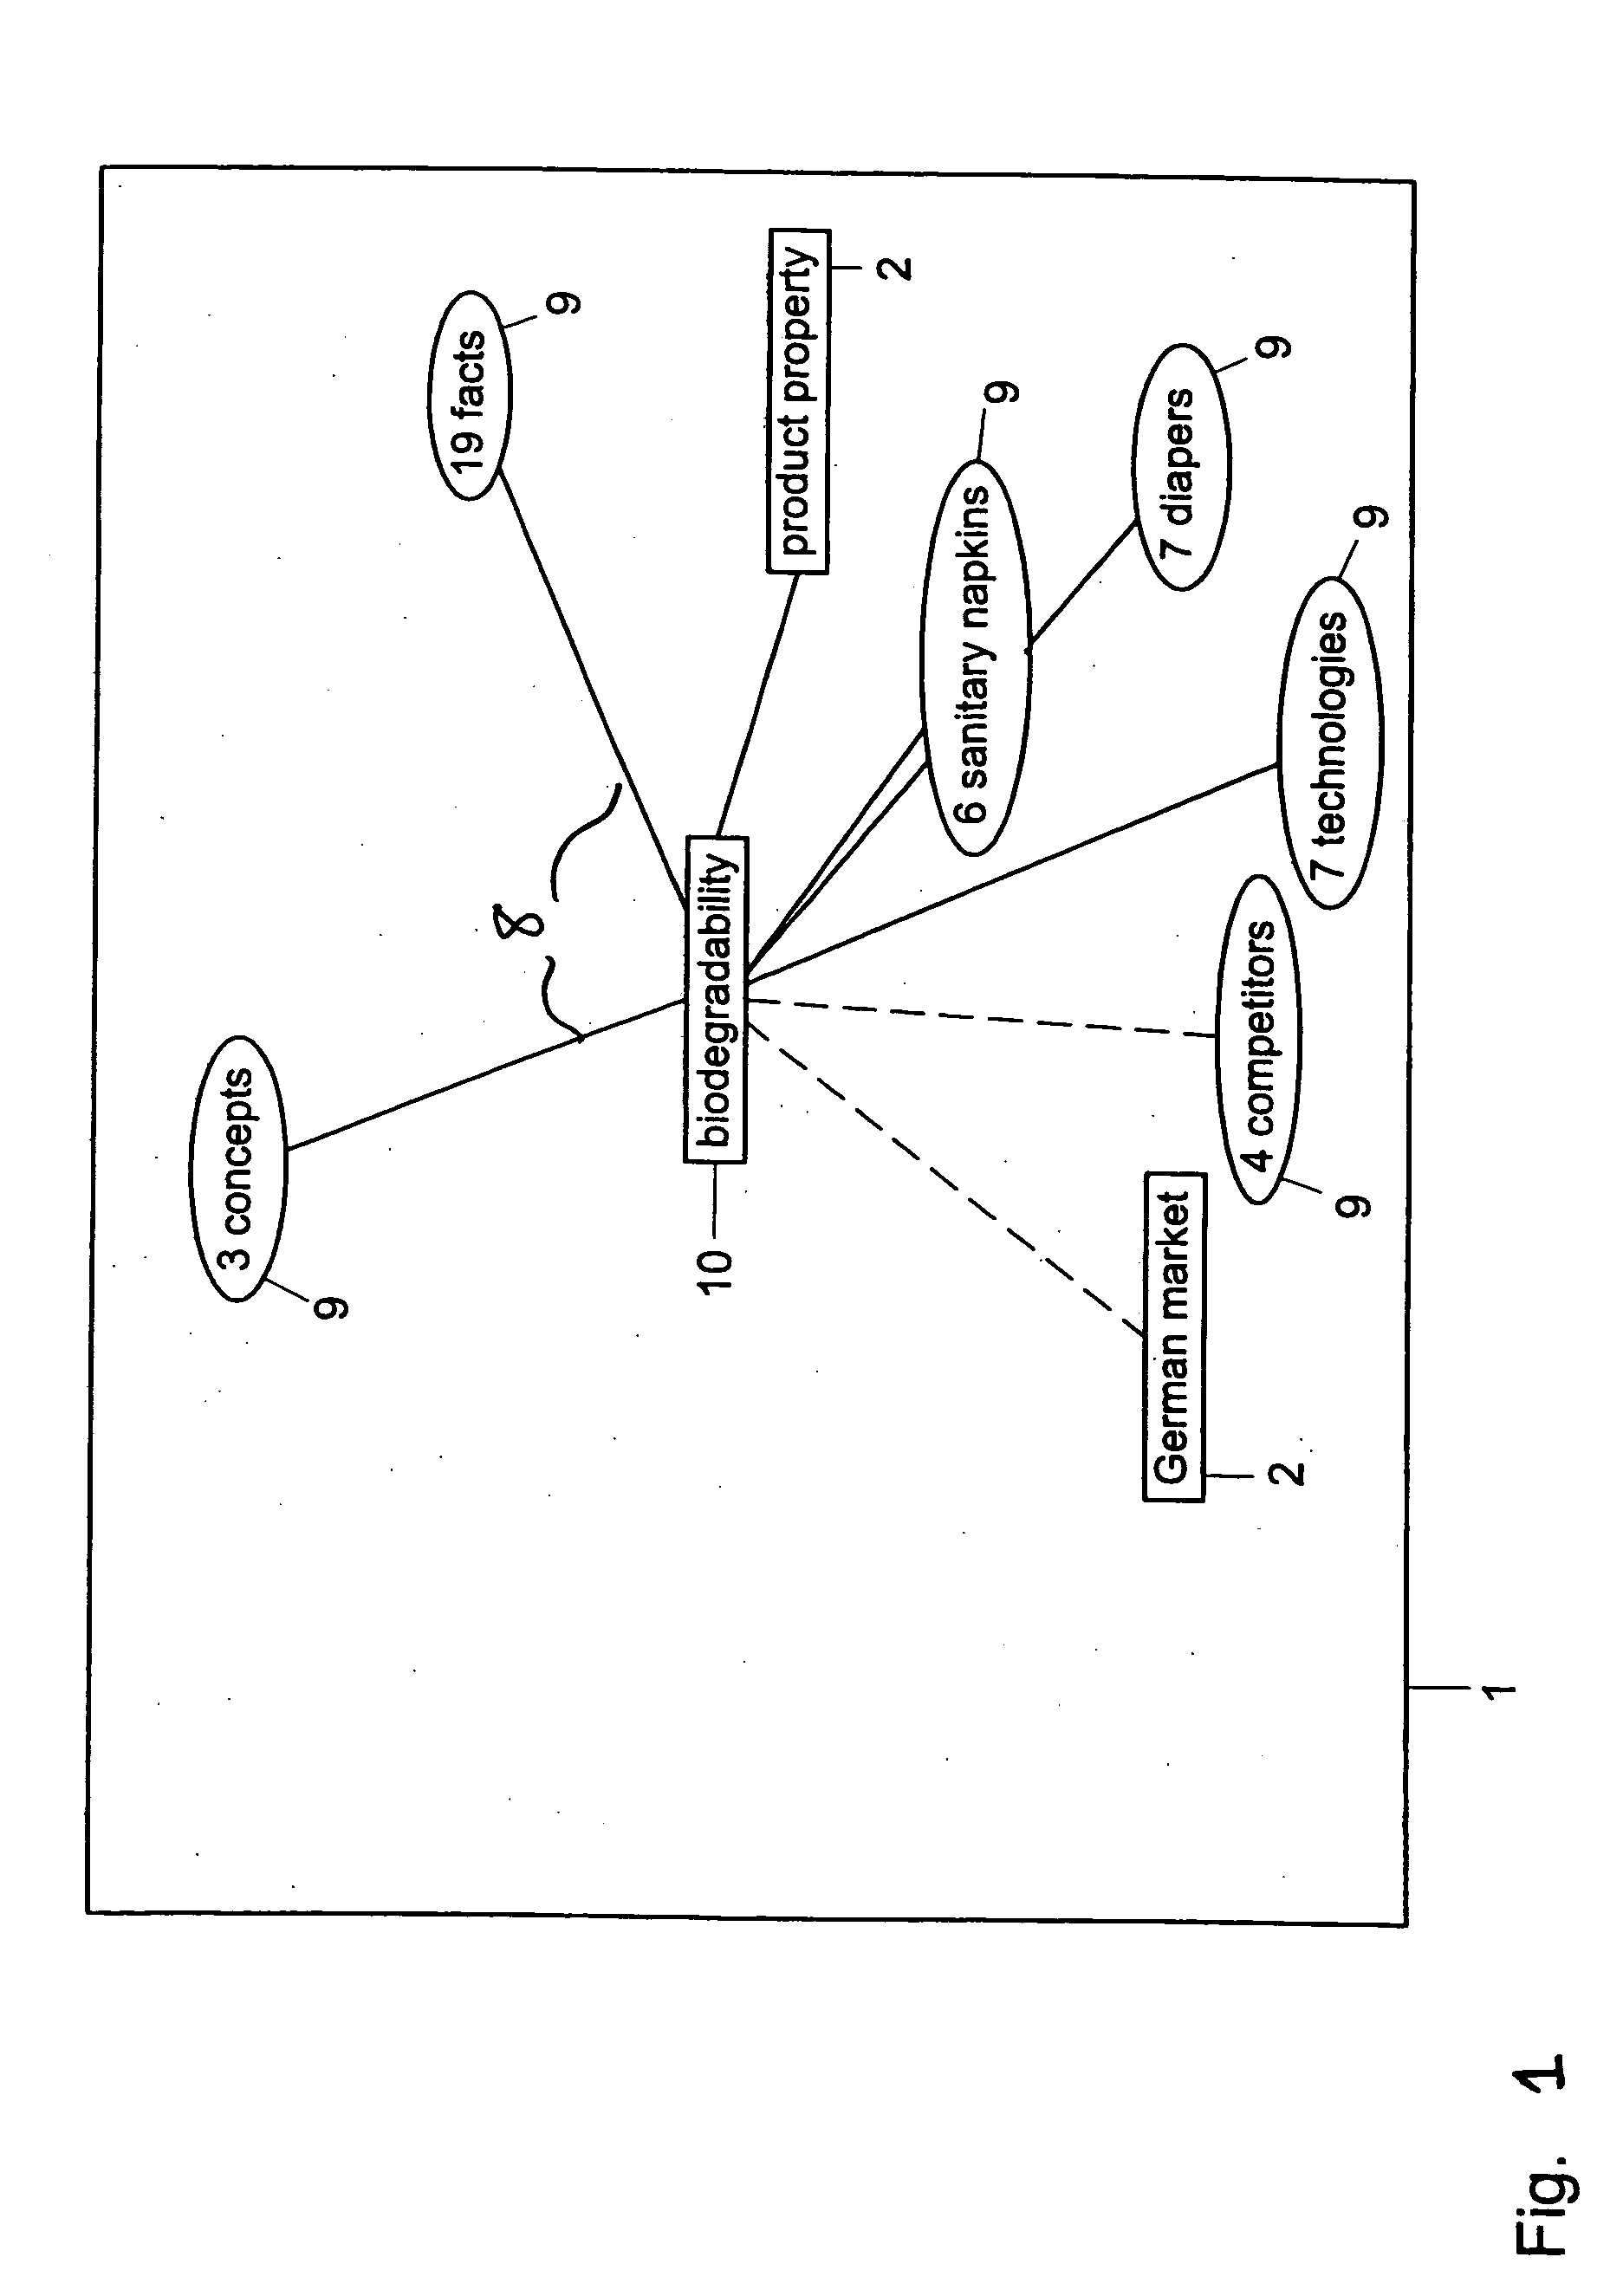
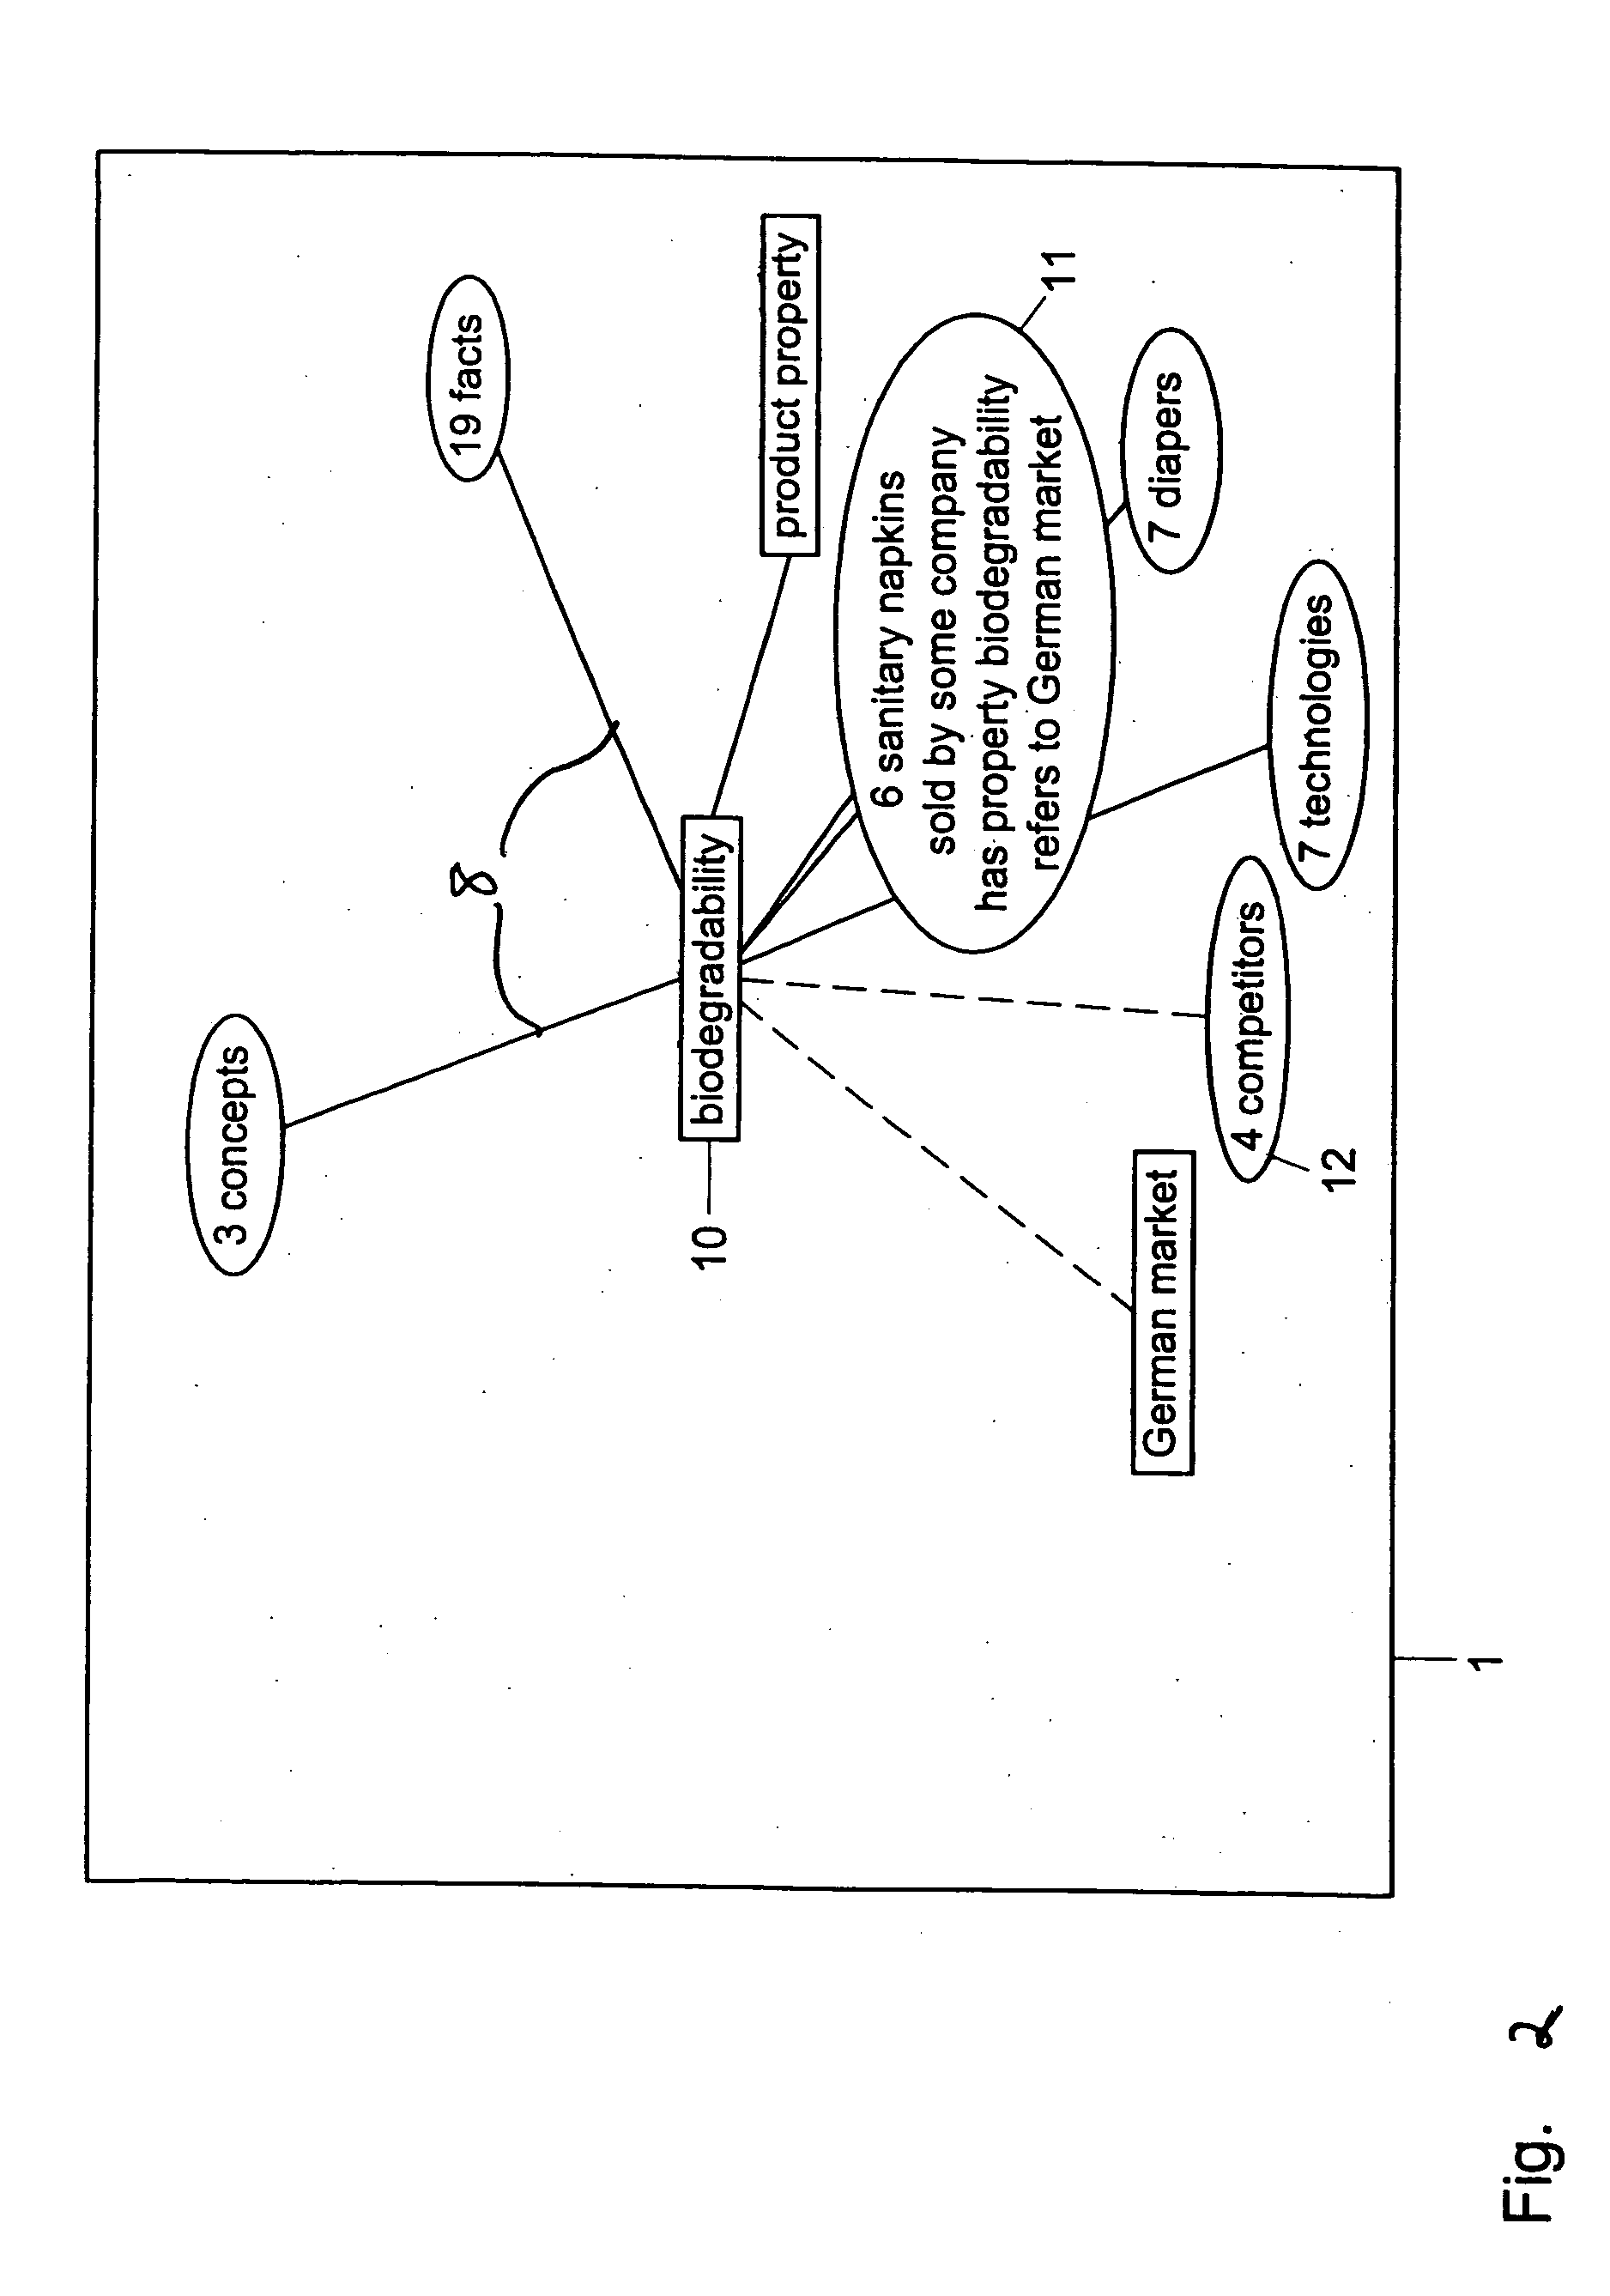
[0020]FIGS. 1-8 show visualization graphs. FIG. 7 shows details of a visualization graph 1 wherein a plurality of entities 2 are displayed. Each entity is represe...


PUM


Abstract

A visualization graph is provided on a computer by storing data corresponding to a plurality of entities and/or nodes, wherein a semantic net includes the entities and/or nodes and wherein the entities and/or nodes are linked to each other by a plurality of relations. A query is generated and performed on the data. Data is output in the form of a visualization graph representing the results of the query, wherein the graph has a focus entity or node defined by a user or the query. Context information is used to determine at least one entity and/or node to be output in the results that is indirectly related to the focus entity or node.

Description

[0001] This application is based upon and claims the benefit of priority from prior patent application EP 03077697.5, filed Aug. 29, 2003, and prior patent application EP 03078586.9, filed Nov. 14, 2003, the entire contents of each which are expressly incorporated herein by reference. BACKGROUND [0002] I. Technical Field [0003] The present invention relates to a methods and systems for providing a visualization graph on a computer. [0004] II. Background Information [0005] Visualization graphs are tools that allow data to be handled and displayed on a display device according to certain criteria. The primary objective of navigation graphs is to display systems of complex interrelationships between entities, such as in a database or on the World Wide Web. Visualization graphs can be based on a semantic net including all entity types that occur where the considered entities are linked to each other by various kinds of relations. A visualization graph represents entities as boxes, often...

Claims


Application Information

Patent Timeline
Patent Type & Authority Applications(United States)
IPC IPC(8): G06N5/04G06F3/048G06F3/0482G06F3/0484G06F17/30
CPCG06F17/30991G06F16/9038
Inventor WERNER, HORSTBERINGER, JOERGHATSCHER, MICHAEL
Owner SAP AG
Why Eureka
Try Eureka