Display, data storage and alarm features of an adaptive oxygen controller

a technology of oxygen control system and display, applied in the field of oxygen control system, can solve problems such as pulmonary toxicity, oxygen toxicity, and risk of hypoxemia

Inactive Publication Date: 2008-07-31
TAUBE JOHN
View PDF2 Cites 63 Cited by
  • Summary
  • Abstract
  • Description
  • Claims
  • Application Information

AI Technical Summary

Problems solved by technology

The use of supplemental oxygen to improve oxygen tension and hemoglobin saturation in the blood and decrease the risk of hypoxemia can be associated with oxygen toxicity.
In the medical setting mechanical ventilation with 100% inspired oxygen tension can lead to pulmonary toxicity and concomitant pulmonary fibrosis in relatively short periods of time and is a considerable risk in the use of high-dose oxygen in acute medical care.
Prolonged breathing of 60-100% oxygen for more than 12 hours will irritate the pulmonary passages, resulting in the Lorraine-Smith effect which is a combination of cough and congestion, sore throat and substemal soreness.
After 12 hours, decreased vital capacity occurs which is accompanied by severe pulmonary damage.
At greater oxygen tensions, such as hyperbaric oxygen tensions or tensions in which positive end-expiratory pressure ensues, this pulmonary toxicity can be significant and cause sufficient damage in the lungs to offset the benefit of mechanical ventilation with oxygen support.
Similarly, the prior art is devoid of a means to adjust system time constant and delay functions in order to use defined oxygen control system with patients who require a nasal cannula, an oxygen mask or oxyhood for the administration of oxygen therapy.
Finally the prior art does not provide a method of providing diagnostic and / or therapeutic care for long-term oxygen therapy, sleep apnea, oxygen / helium mixture, continuous positive airway pressure, and supplemental oxygen weaning applications.

Method used


Image

  • Display, data storage and alarm features of an adaptive oxygen controller
  • Display, data storage and alarm features of an adaptive oxygen controller
  • Display, data storage and alarm features of an adaptive oxygen controller

Examples


Embodiment Construction

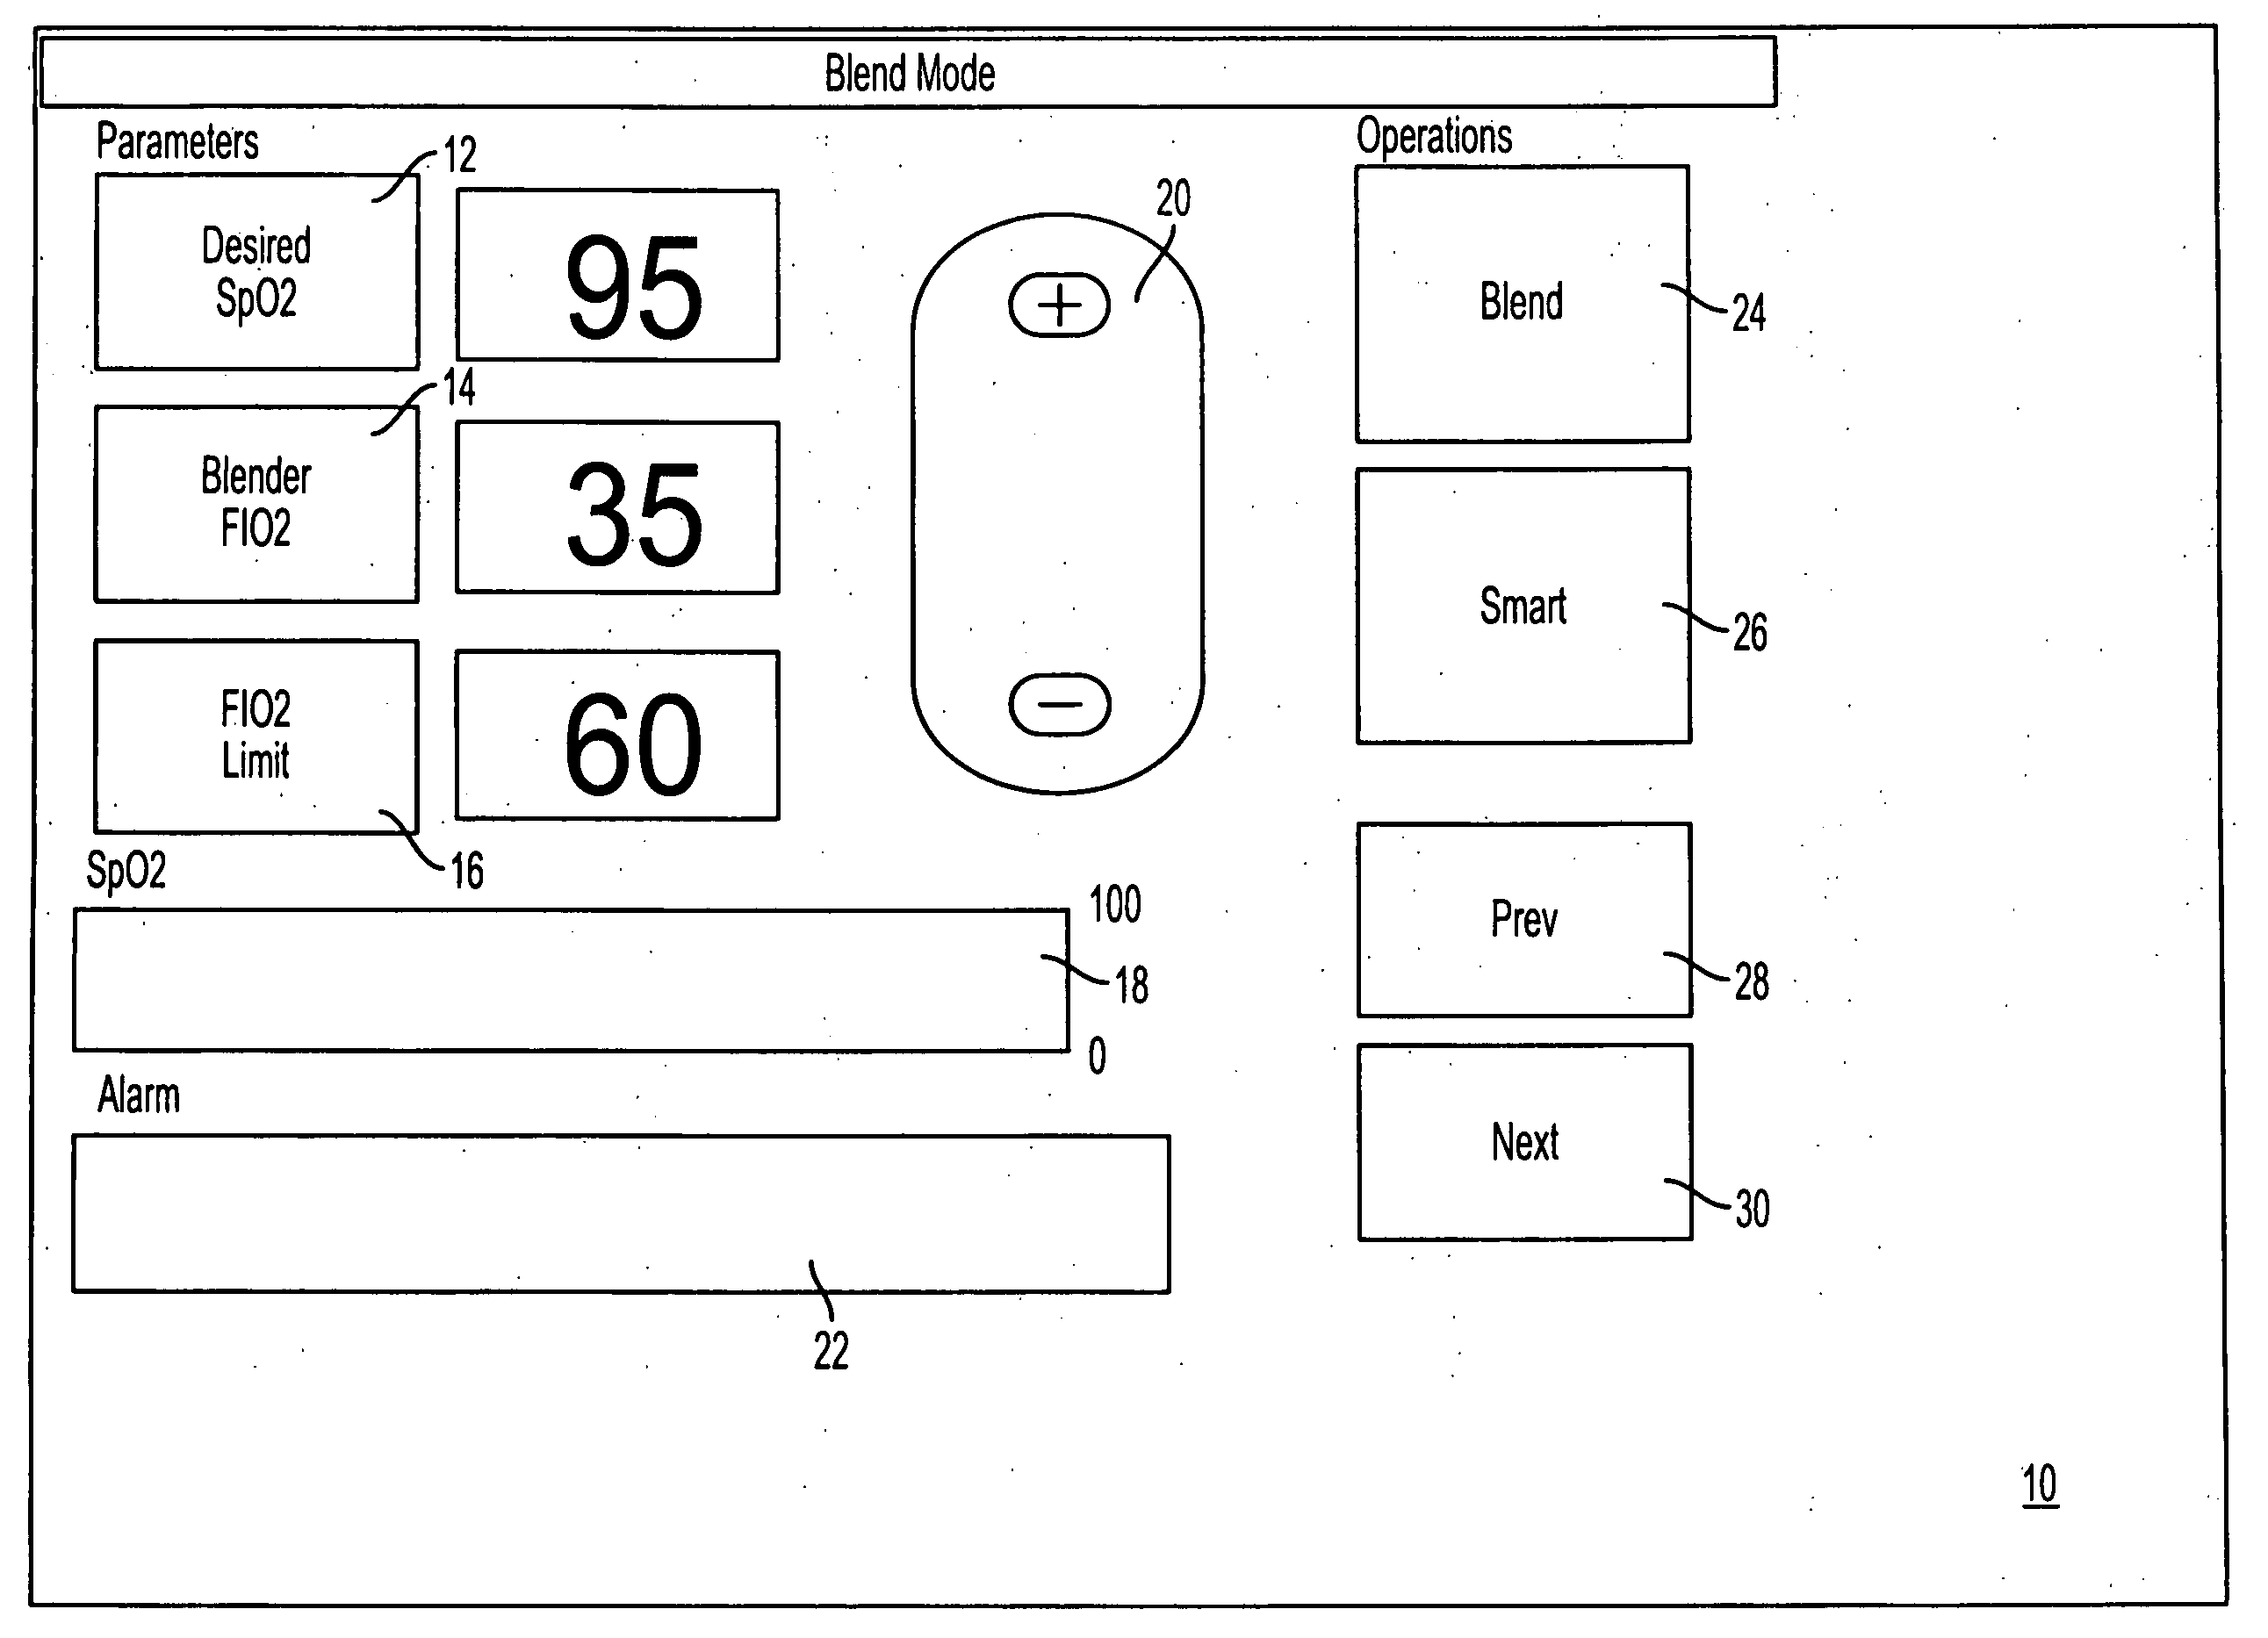
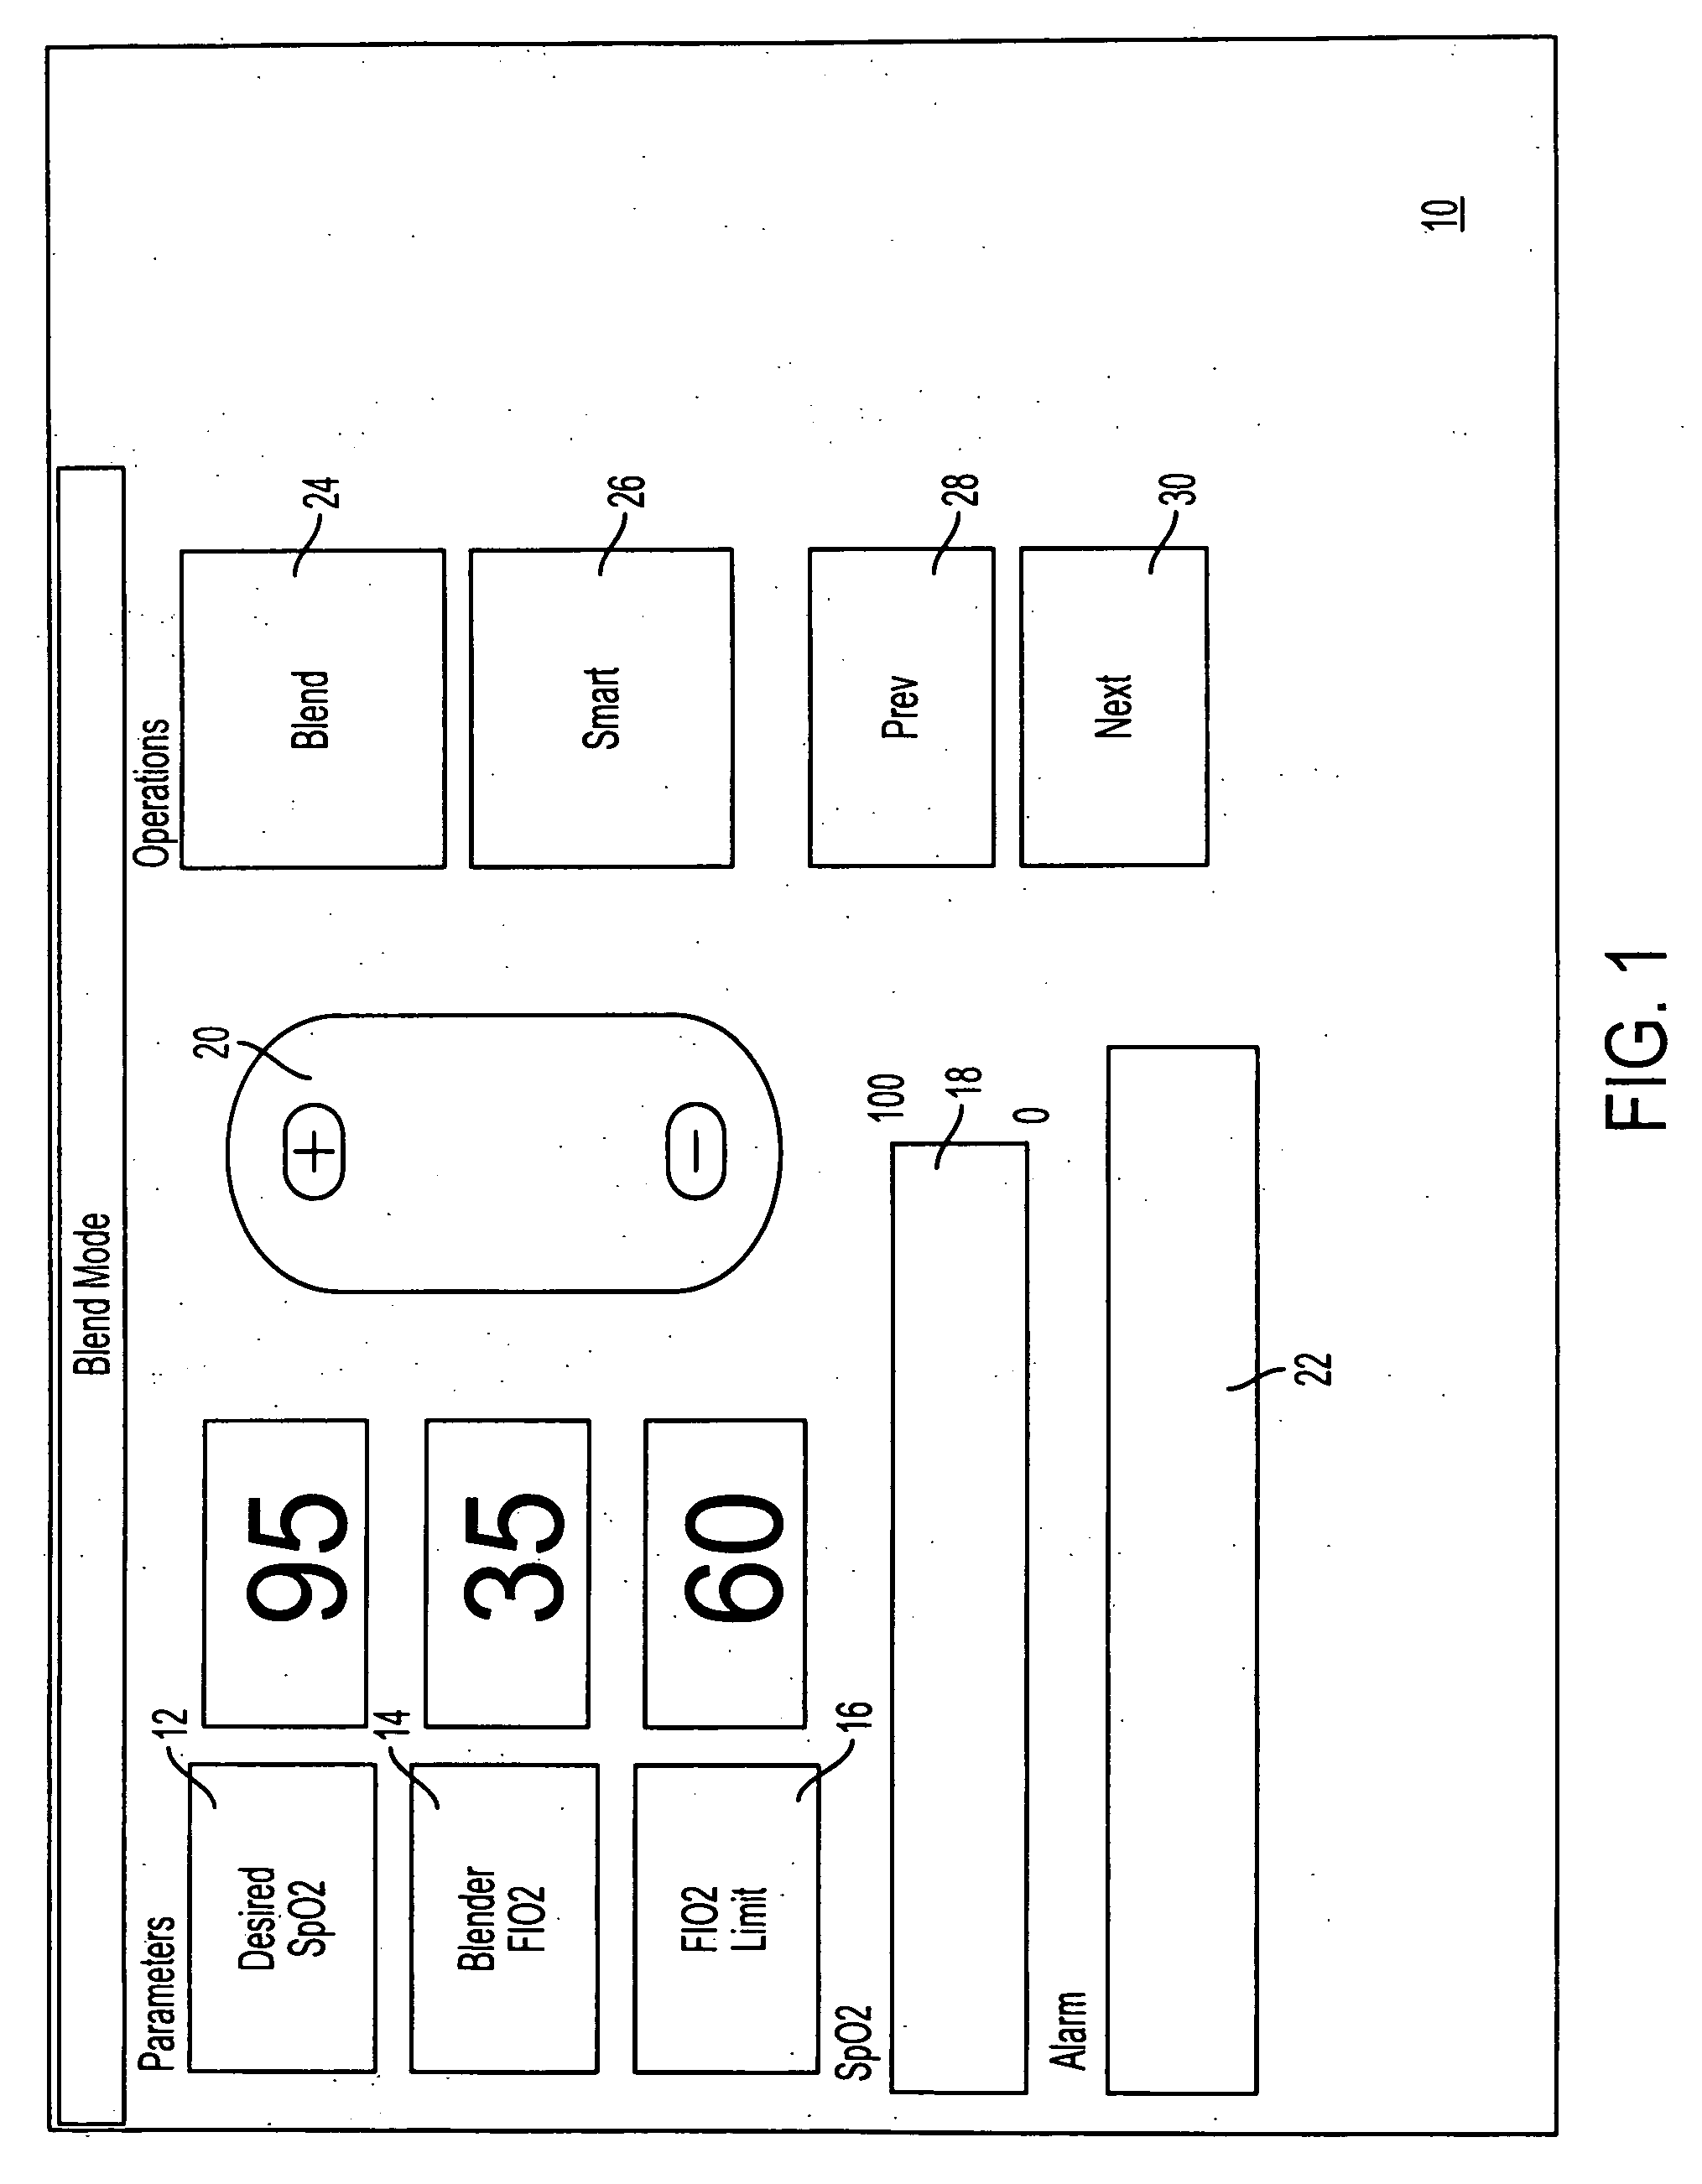
[0030]Reference will now be made in detail to the present preferred embodiments of the invention, examples of which are illustrated in the accompanying figures. Referring now in greater detail to FIG. 1, which is a diagram of the initial selection touch screen display panel referred to generally as 10. The operation begins by first selecting the Blend button 24 selection to adjust the desired percentage of SpO2 by using the desired SpO2 button 12, ranging from 21% to 100% O2. The adjustments are made using the adjustment button 20 with the plus (+) or minus (−) buttons. Similarly, adjustments are made to the Blender FiO2 levels via the Blender FiO2 button 14 and the FiO2 limit via the FiO2 limit button 16. A bar graph 18 appears (shown here the desired SpO2 level) for each parameter as they are selected and adjusted. Once the adjustments are made, touching the Smart button 26 actives the computer which will automatically monitor the display parameters and adjust the system according...


PUM


Abstract

A bar graph display feature for clinical viewing of supplemental oxygen (SpO2) or blood oxygen percentage, Pulse Rate, and Fraction of Inspired Oxygen (FiO2) levels as derived from an adaptive supplemental oxygen controller is described. A bar graph is a moving histogram of SpO2, Pulse Rate, and FiO2 by using a computer that calculates a FiO2 by using SpO2 feedback. The bar graph displays stored data on a flat screen or LCD over specified periods. Other display features include alarm conditions: 1) Upper FiO2 Limit, 2) Motion Detection, 3) Power Loss, 4) Battery Backup, and 5) Pressure Loss. The Upper FiO2 Limit is a calculation of FiO2 by using SpO2 feedback from a pulse oximeter. The invention also relates to an adaptive oxygen control system whereas adjustment of system time constant and system delay provides application of the control system for use with an oxygen mask, oxyhood or nasal cannula.

Description

CROSS-REFERENCE TO RELATED APPLICATIONS[0001]This application claims priority to U.S. Provisional Application No. 60 / 858,483 filed on Nov. 13, 2006, the entire contents of which are incorporated herein by reference.BACKGROUND OF THE INVENTION[0002]This invention relates to oxygen control systems for providing supplemental oxygen therapy to patients recovering from respiratory distress and in particular, an adaptive oxygen control system that utilizes SpO2 feedback from a pulse oximeter to derive the fraction of inspired oxygen delivered to a patient. The display feature for clinical viewing of SpO2, Pulse Rate, and computer calculated FiO2 by using SpO2 from a pulse oximeter is unique and novel in that moving bar histogram of the data is shown to the end user in five minute, one hour, four hour, and eight hour increments. This form of data presentation provides useful information for patient diagnosis and treatment. The data storage feature uses a long-term memory storage device for...

Claims


Application Information

Patent Timeline
Patent Type & Authority Applications(United States)
IPC IPC(8): A61B5/00
CPCA61M16/12A61M16/1005A61M16/122
Inventor TAUBE, JOHN
Owner TAUBE JOHN
Why Eureka
Try Eureka