System and method for predicting security price movements using financial news

a technology of security price and financial news, applied in the field of system and method for predicting security price movements using financial news, can solve the problems of not incorporating events, using neural networks or statistical regression, and not providing prediction results

Inactive Publication Date: 2009-02-26
PAPKA RON
View PDF2 Cites 6 Cited by
  • Summary
  • Abstract
  • Description
  • Claims
  • Application Information

AI Technical Summary

Problems solved by technology

However, these approaches, whether they use neural networks or statistical regression, do not incorporate the events, and in particular, the news events that are responsible for the actual day-to-day price movements.
The motivation of this research is to find and explain a market behavior in the context of a correlation between specific events and price changes, thus much of the research does not provide results for prediction, or recommend how the techniques described could be used in a prediction process.
However, in this type of research the words predict when a particular price change event will occur, and there is no attempt to use an analyst's classification of “news” as input.

Method used


Image

  • System and method for predicting security price movements using financial news
  • System and method for predicting security price movements using financial news
  • System and method for predicting security price movements using financial news

Examples


example 1

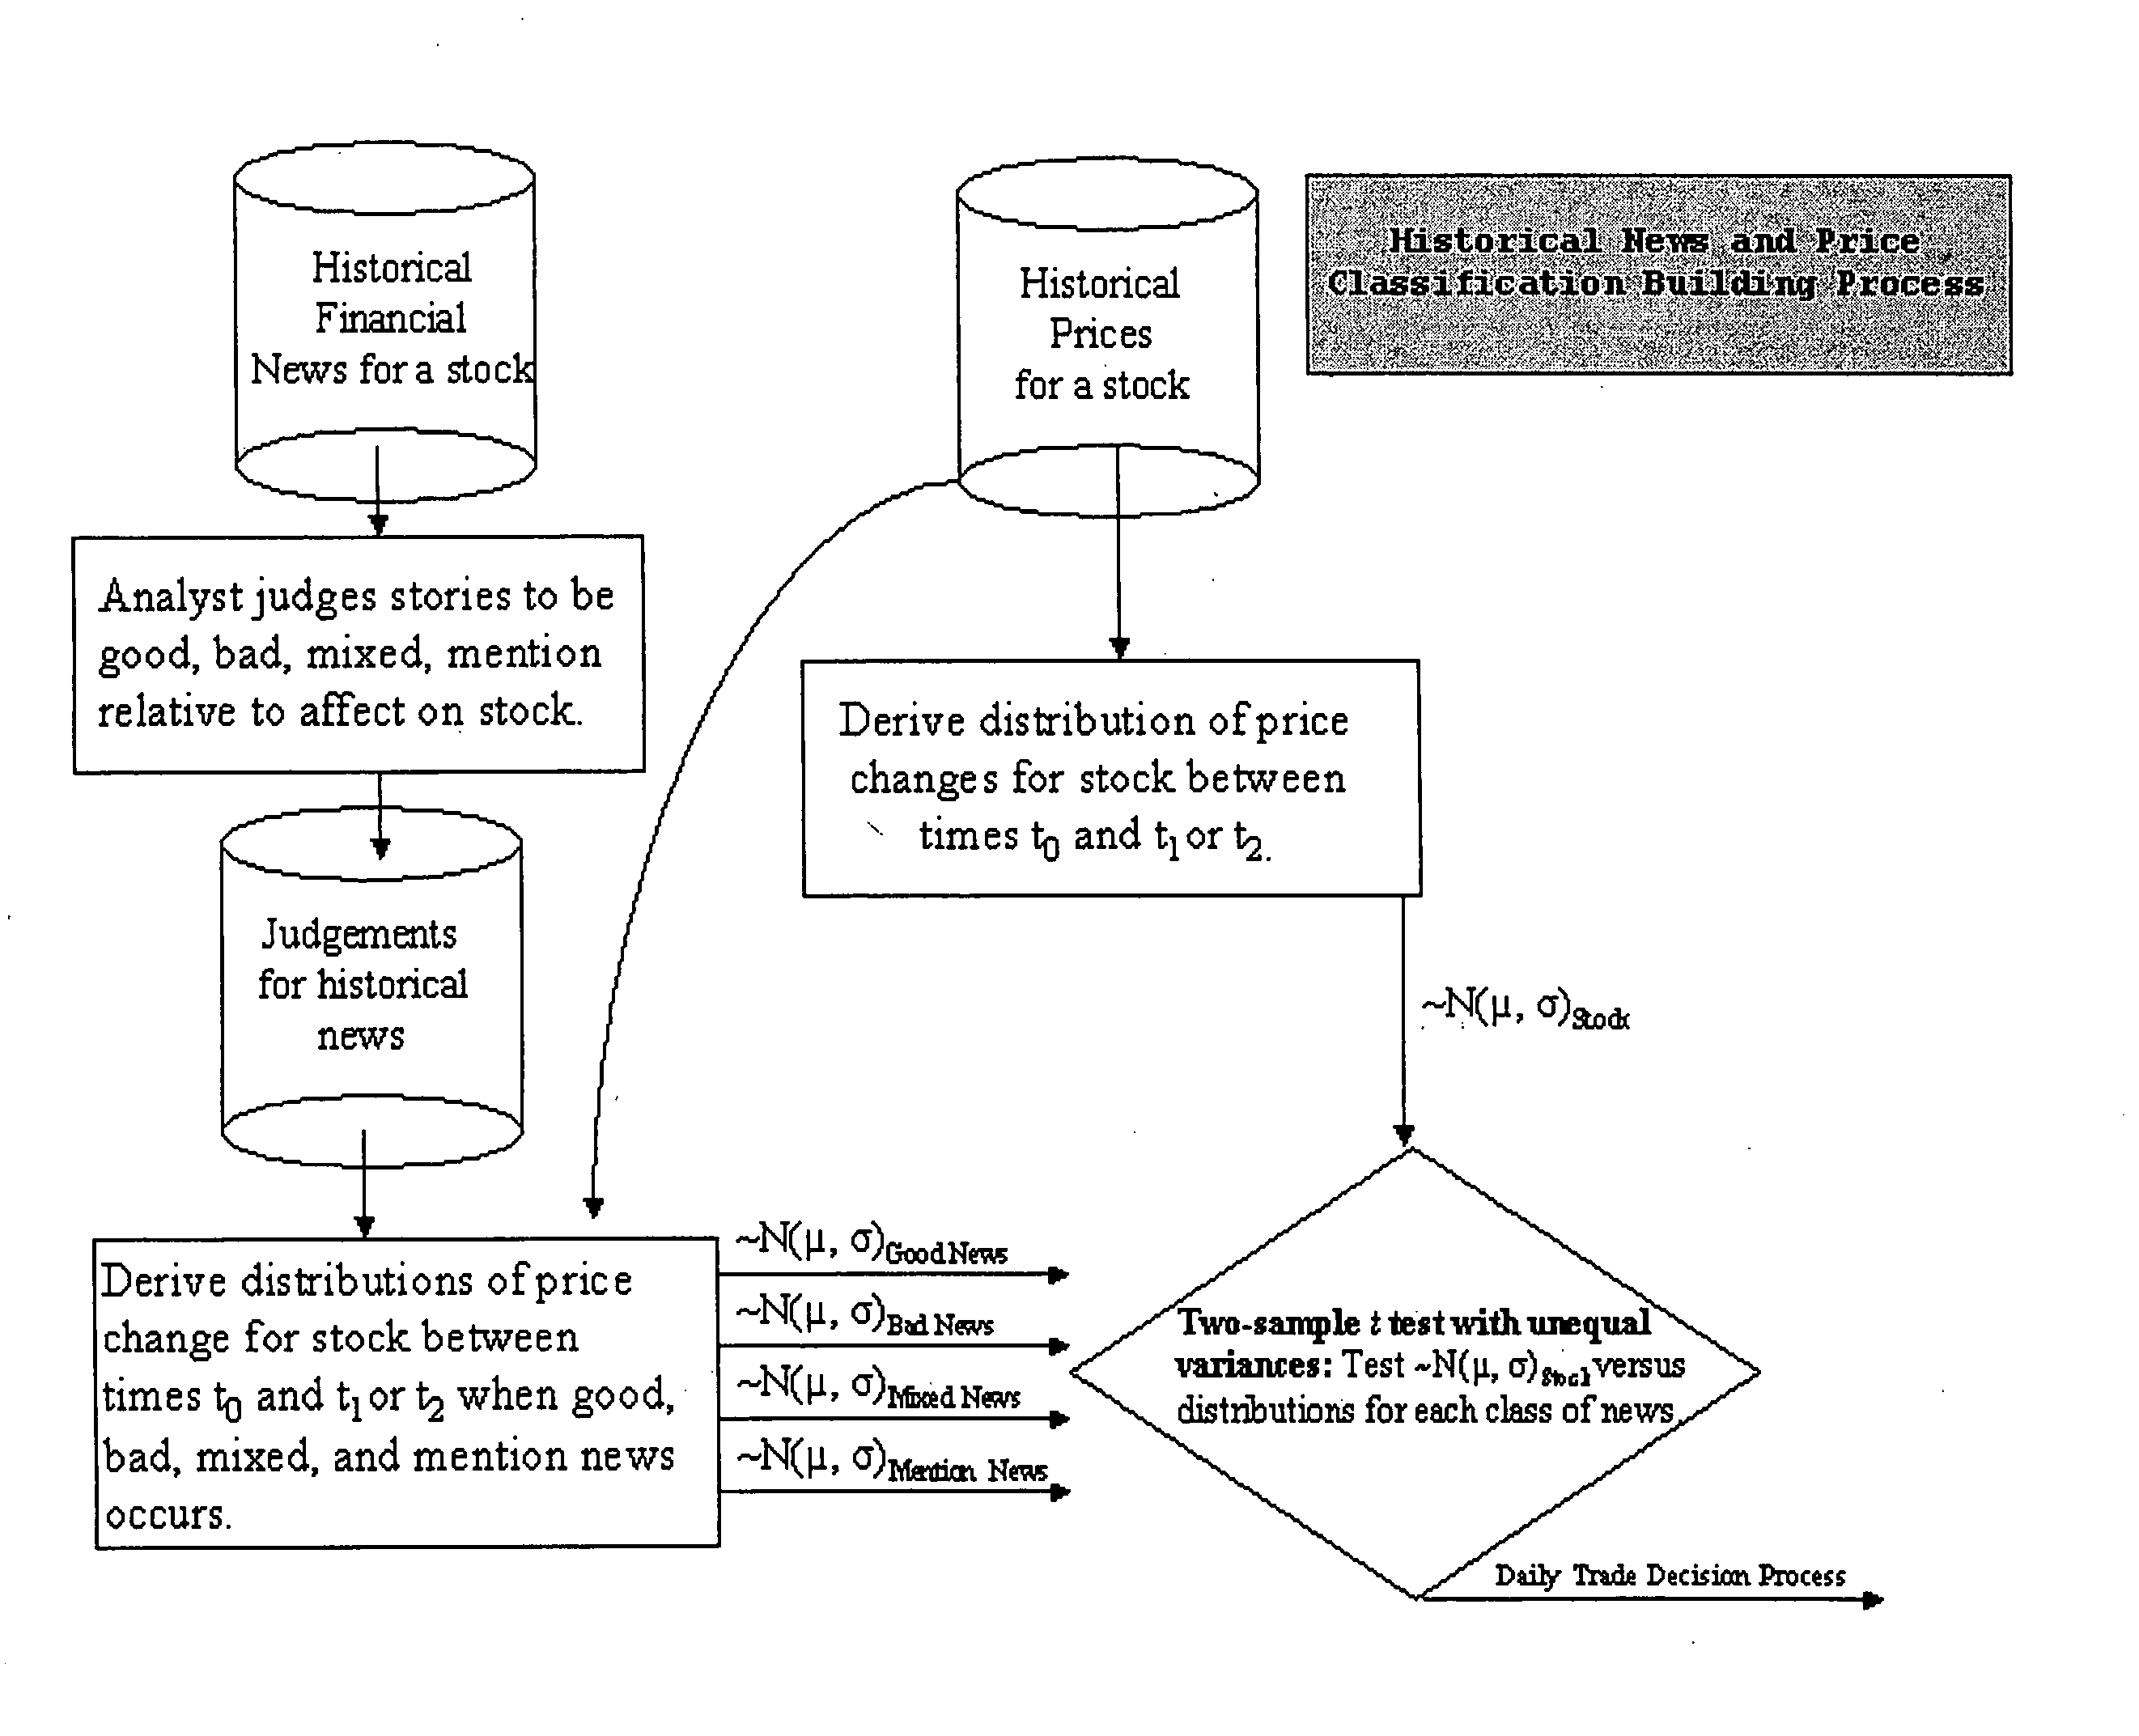
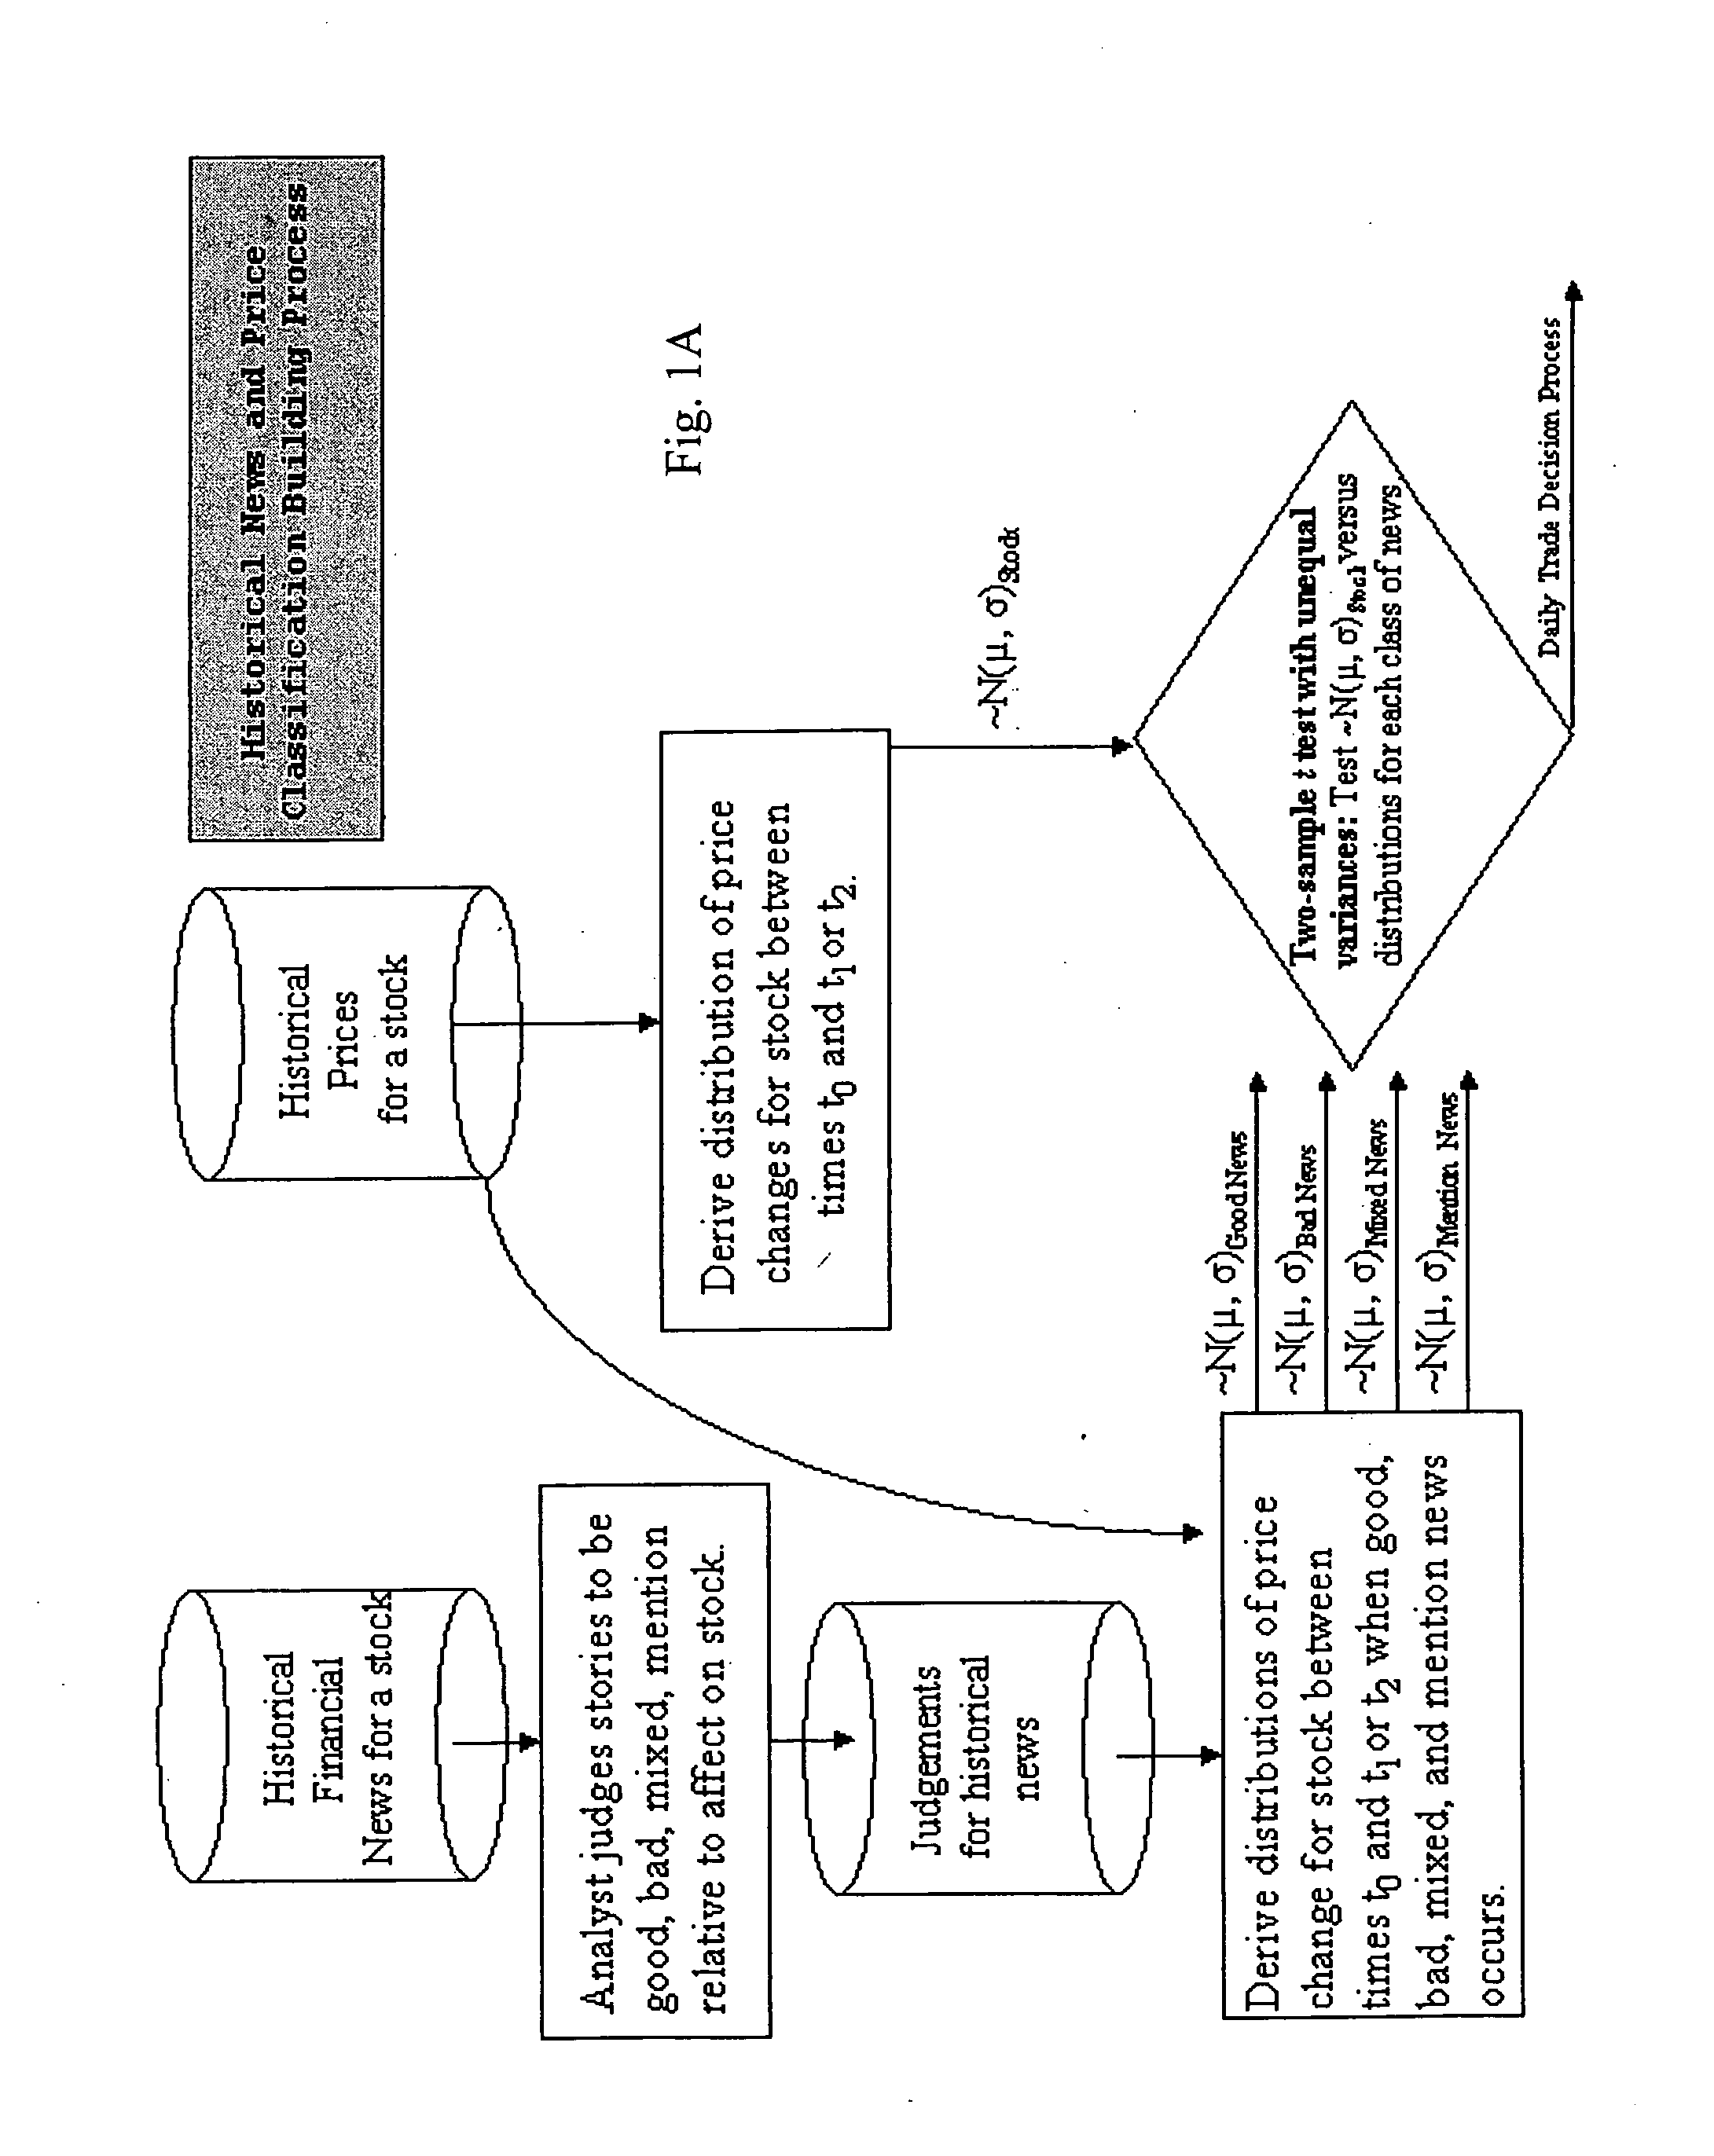
[0034]The training period is Jan. 2, 2002-Jan. 5, 2000.

[0035]The distribution of the 1-day change in price of the stock in general is:

t1=0.5, t2=−0.17, and t3=0.6.

[0036]The distribution of the 2-day change in price of the stock in general is:

t2=−0.25, and t3=0.33.

[0037]Incorporated herein is references to A-1 to A-3 of the Appendix, which provide a description and equations for calculating the mean the standard deviation of a distribution.

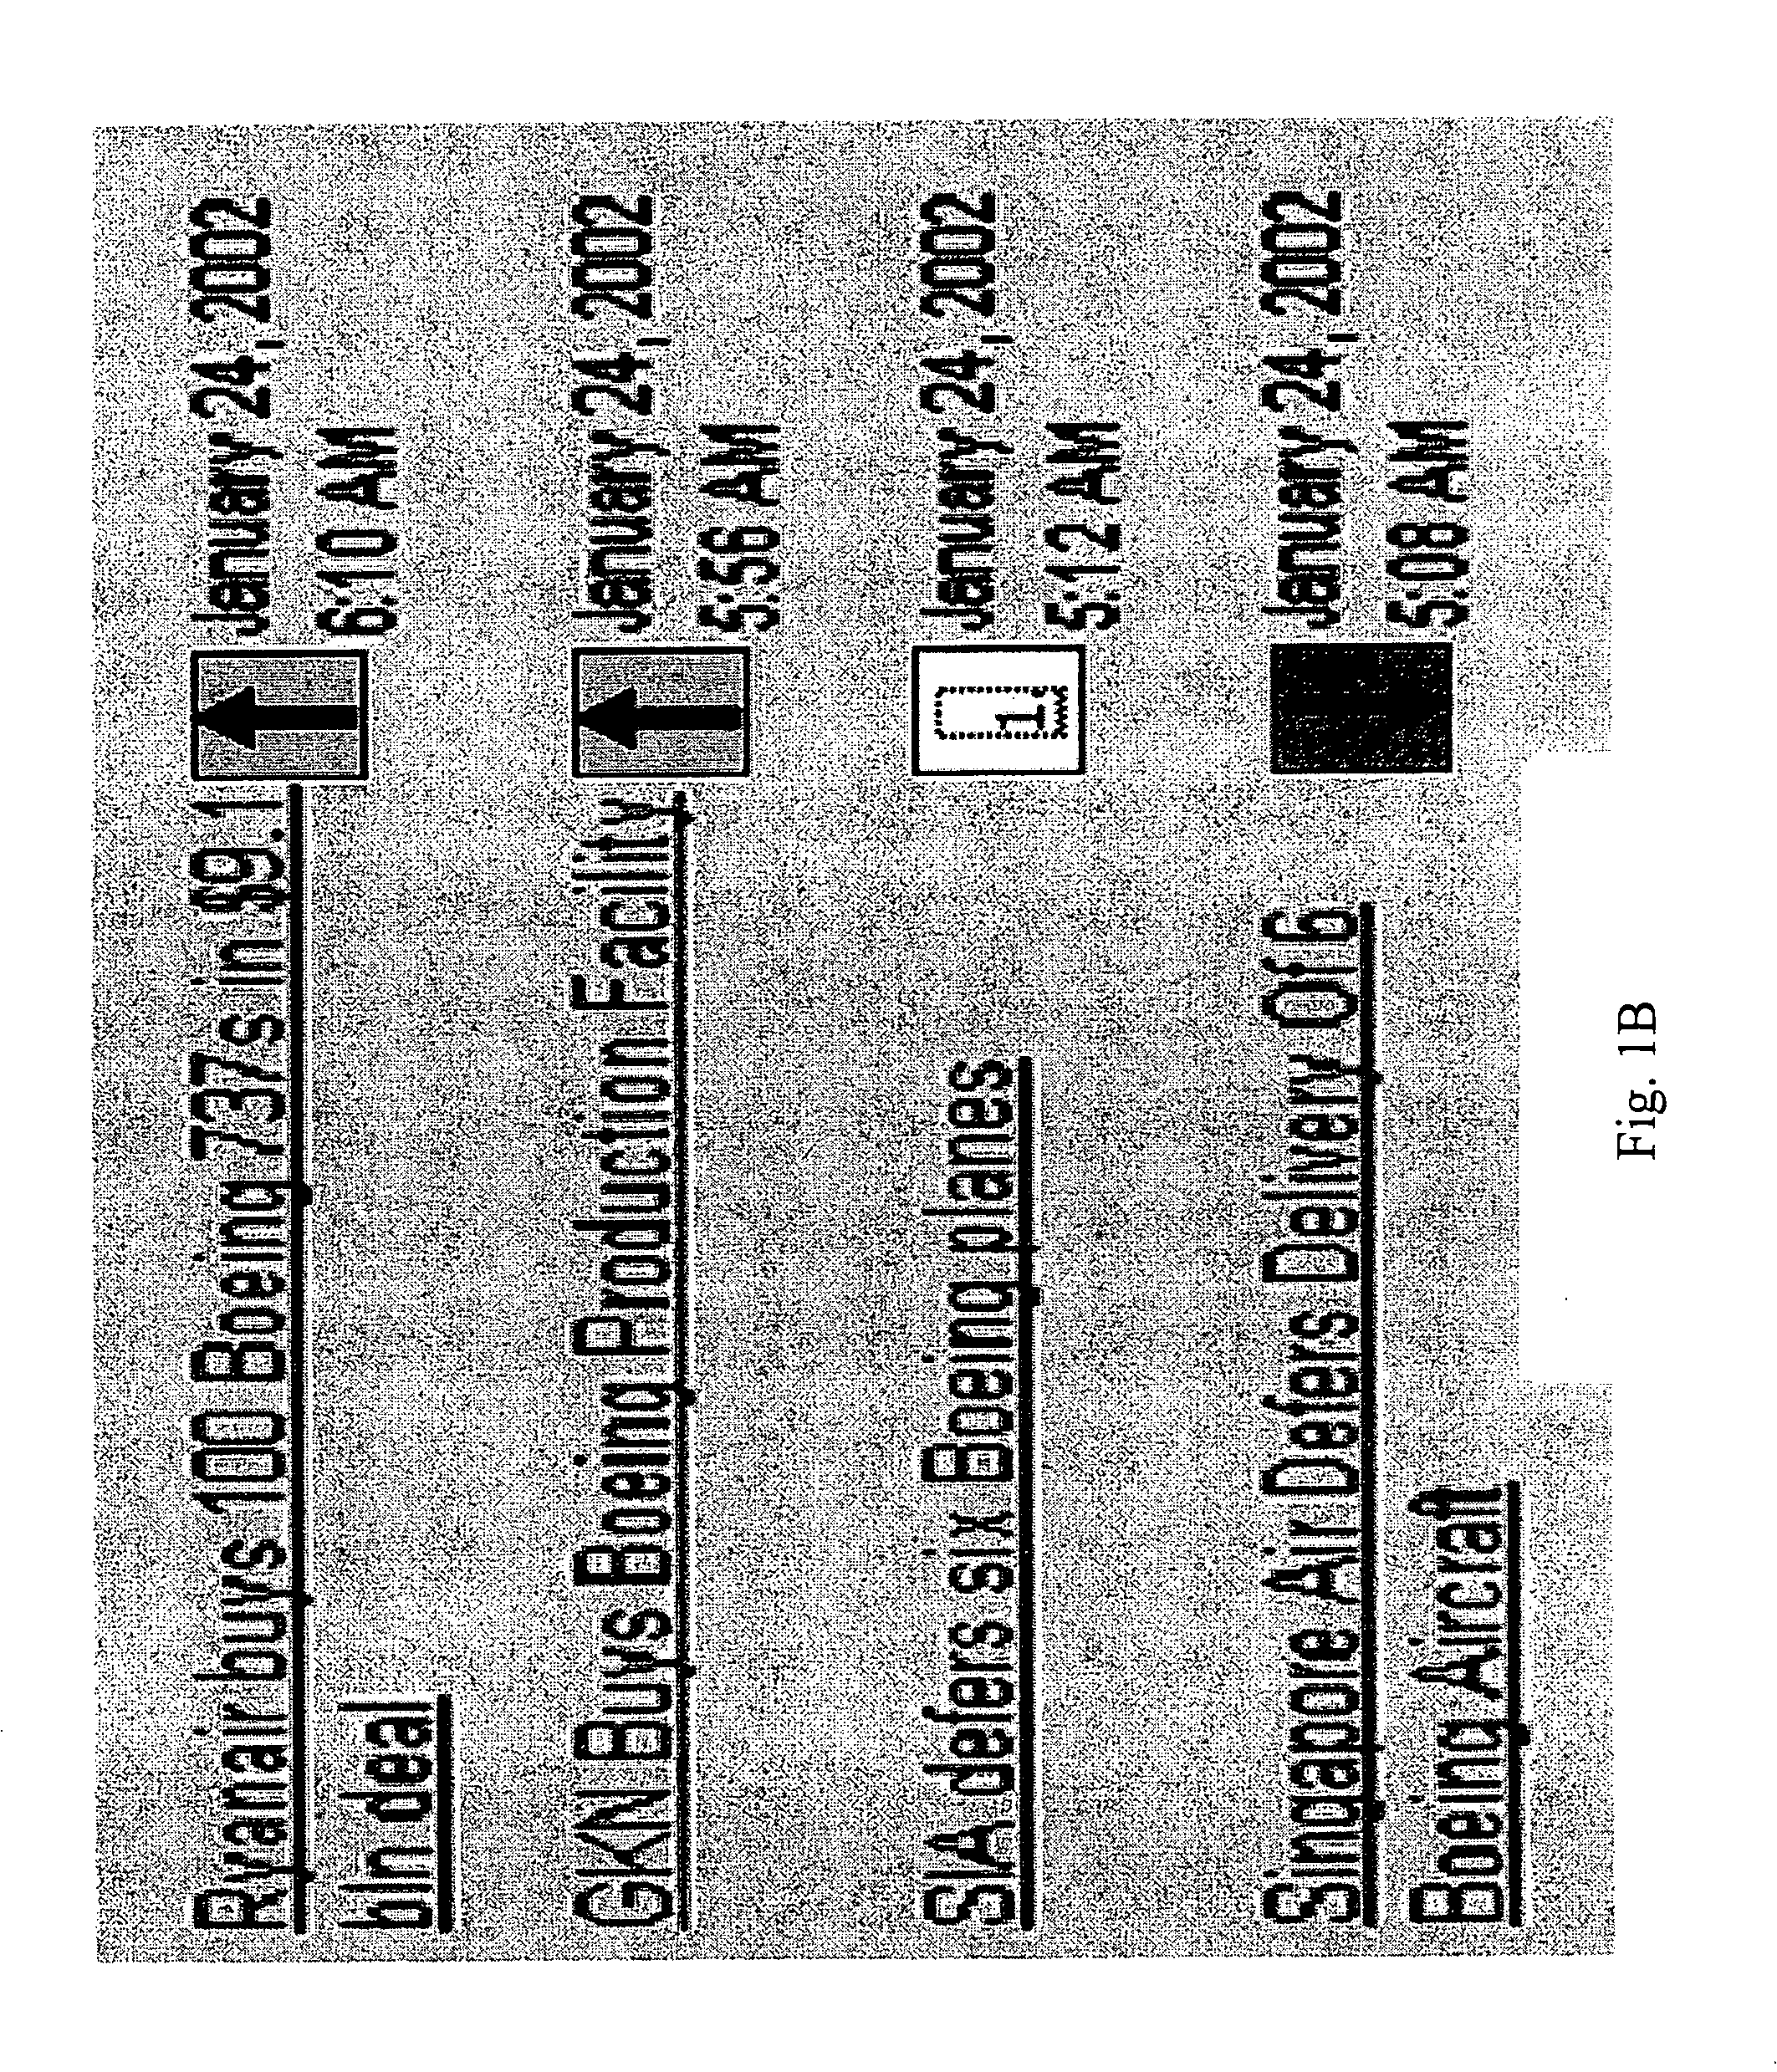
[0038]The apparatus for collecting analyst classifications via a website is illustrated in FIGS. 1B-C. A listing of news article titles for a company is displayed on the computer screen. In addition, each article has a graphic indicating the classification of the article, or a graphic indicating that the article needs to be classified. In one embodiment of the experiment (see FIG. 1B), an up arrow in a green box indicated the article was classified as good news, a down arrow in a red box indicated bad news. An up and down arrow in a yellow box indi...


PUM


Abstract

A method of creating a price prediction model that forecasts short-term price fluctuations in financial instruments by collecting, analyzing and classifying financial news for a financial instrument into categories. Distributions for the changes in price of the financial instrument for a set period of time and distributions for the changes in price of the financial instrument as a result of the financial news for each news category for a set period of time are then obtained. If the distributions for the changes in price of the financial instrument are statistically significantly different than the distributions for the changes in price of the financial instrument for a particular news category, and the mean for the change in price is greater or less than zero, a signal is produced indicating the trading action that should be taken for the financial instrument.

Description

PRIORITY[0001]This application is a continuation of and claims priority of U.S. application Ser. No. 10 / 113,895 filed Mar. 28, 2002 which claims priority to U.S. provisional application 60 / 350,264 filed on Jan. 18, 2002.BACKGROUND OF THE INVENTION[0002]A. Field of the Invention[0003]A portion of the disclosure of this patent document contains material that is subject to copyright protection. The copyright owner has no objection to the facsimile reproduction by anyone of the patent document or the patent disclosure, As it appears in the Patent and Trademark Office patent file or records, but otherwise reserves all copyright rights whatsoever.[0004]Background and Prior Art[0005]One “Holy Grail” in the financial markets is the development of an automated system that predicts price movements of financial instruments. If one is able to predict whether prices were moving up or down for financial instruments such as stocks, bonds, and commodities, then, one would have a way to generate mon...

Claims


Application Information

Patent Timeline
Patent Type & Authority Applications(United States)
IPC IPC(8): G06Q40/00
CPCG06Q40/00G06Q40/08G06Q40/06G06Q40/04
Inventor PAPKA, RON
Owner PAPKA RON
Why Eureka
Try Eureka