Presenting meaningful information summary for analyzing complex visualizations

a visualization and information summary technology, applied in the field of human understandable visual data presentation, can solve the problems of increasing the complexity of data and information density of business-related visualizations, difficult to interpret visualizations for presenting information, and difficult to understand visualizations,

Inactive Publication Date: 2015-02-19
GLOBALFOUNDRIES US INC
View PDF2 Cites 53 Cited by
  • Summary
  • Abstract
  • Description
  • Claims
  • Application Information

AI Technical Summary

Problems solved by technology

The complexity of data and information density of business-related visualizations has increased greatly (due to complex business scenarios) such that visualizations for presenting the information have often become very complex and difficult to interpret.
The visualization for multiple parameters may also appear on a single chart, but the chart may become fairly complex due to huge amounts of data and / or complex business scenarios.

Method used


Image

  • Presenting meaningful information summary for analyzing complex visualizations
  • Presenting meaningful information summary for analyzing complex visualizations
  • Presenting meaningful information summary for analyzing complex visualizations

Examples


first embodiment

II. First Embodiment

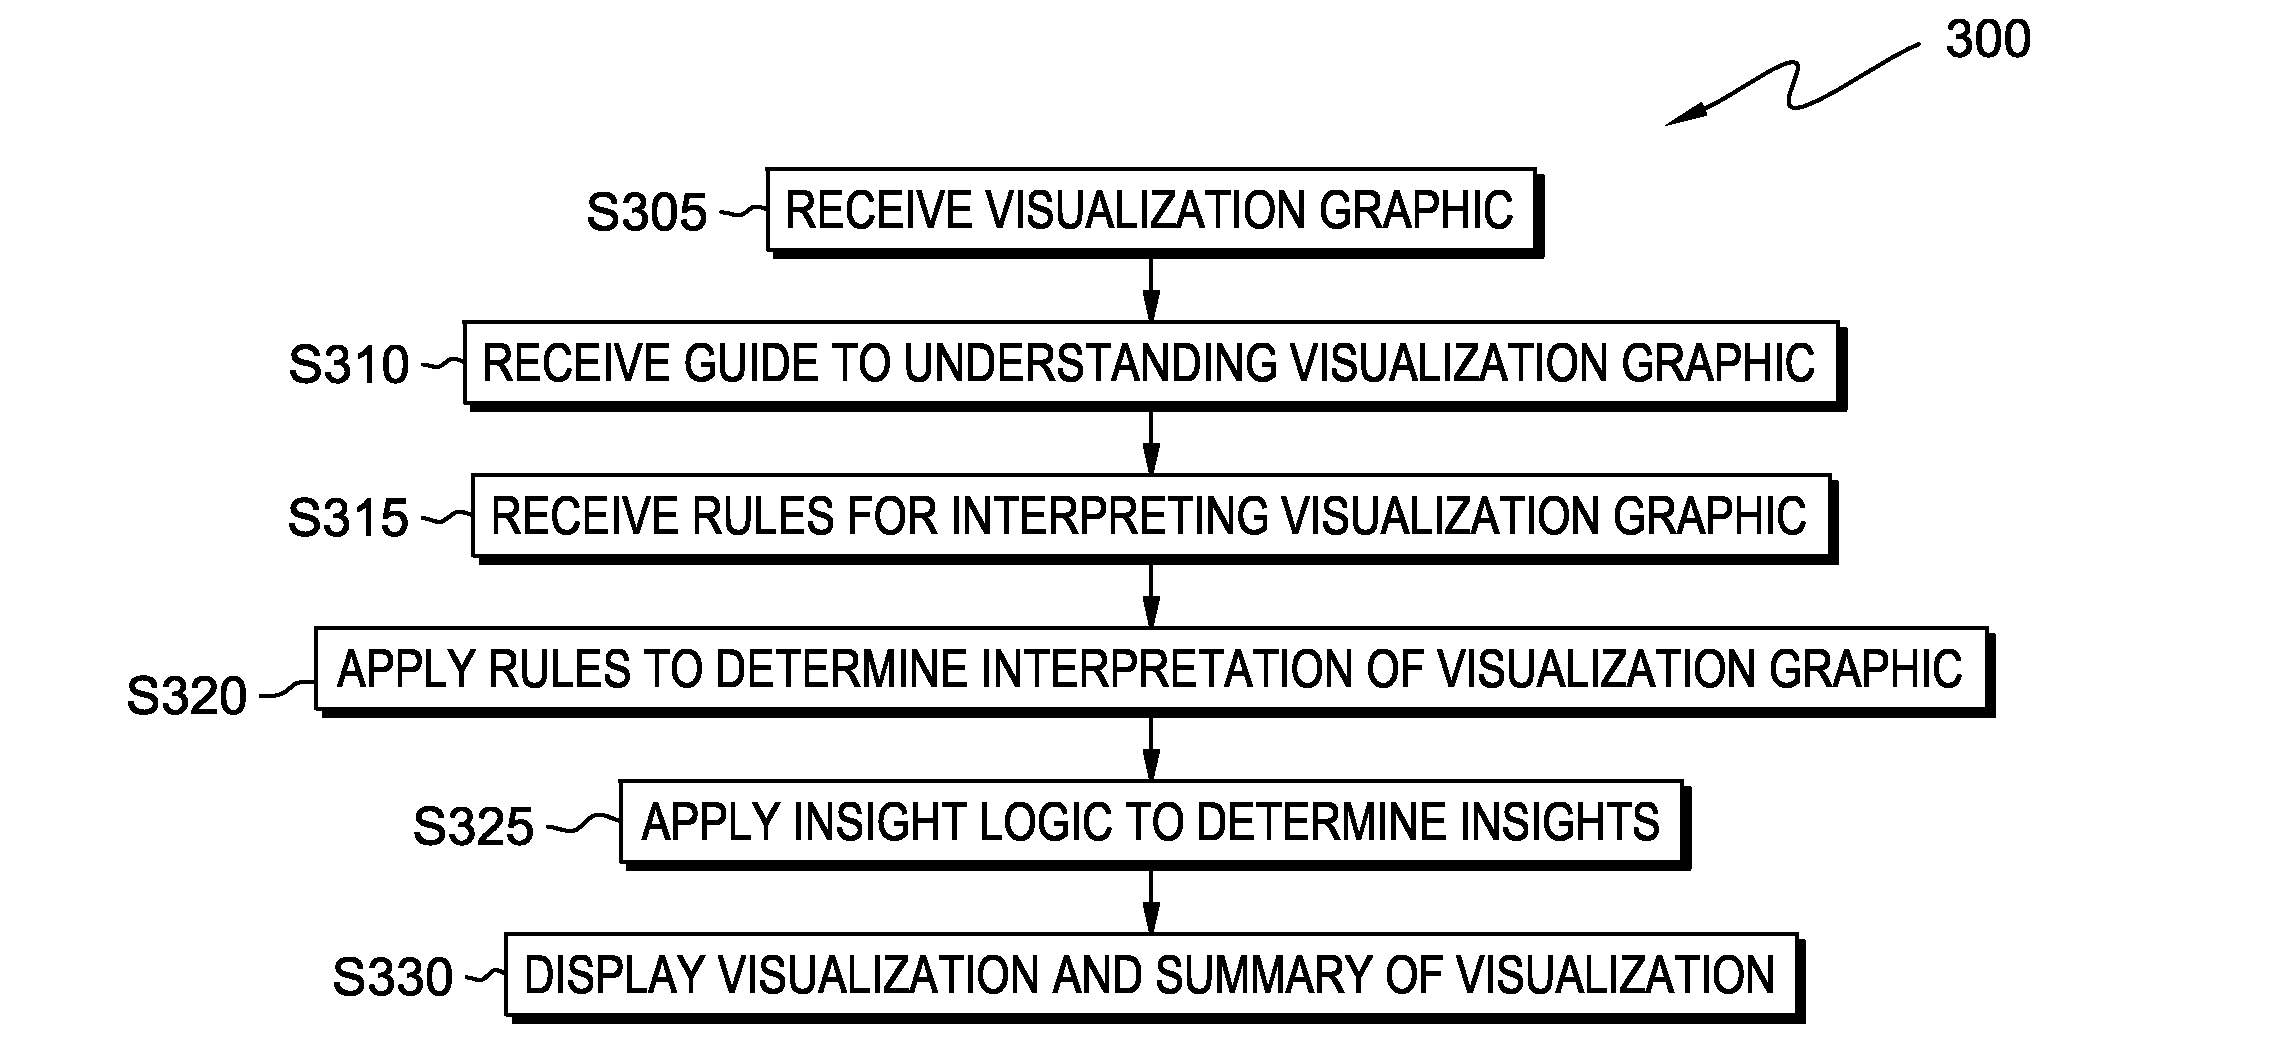
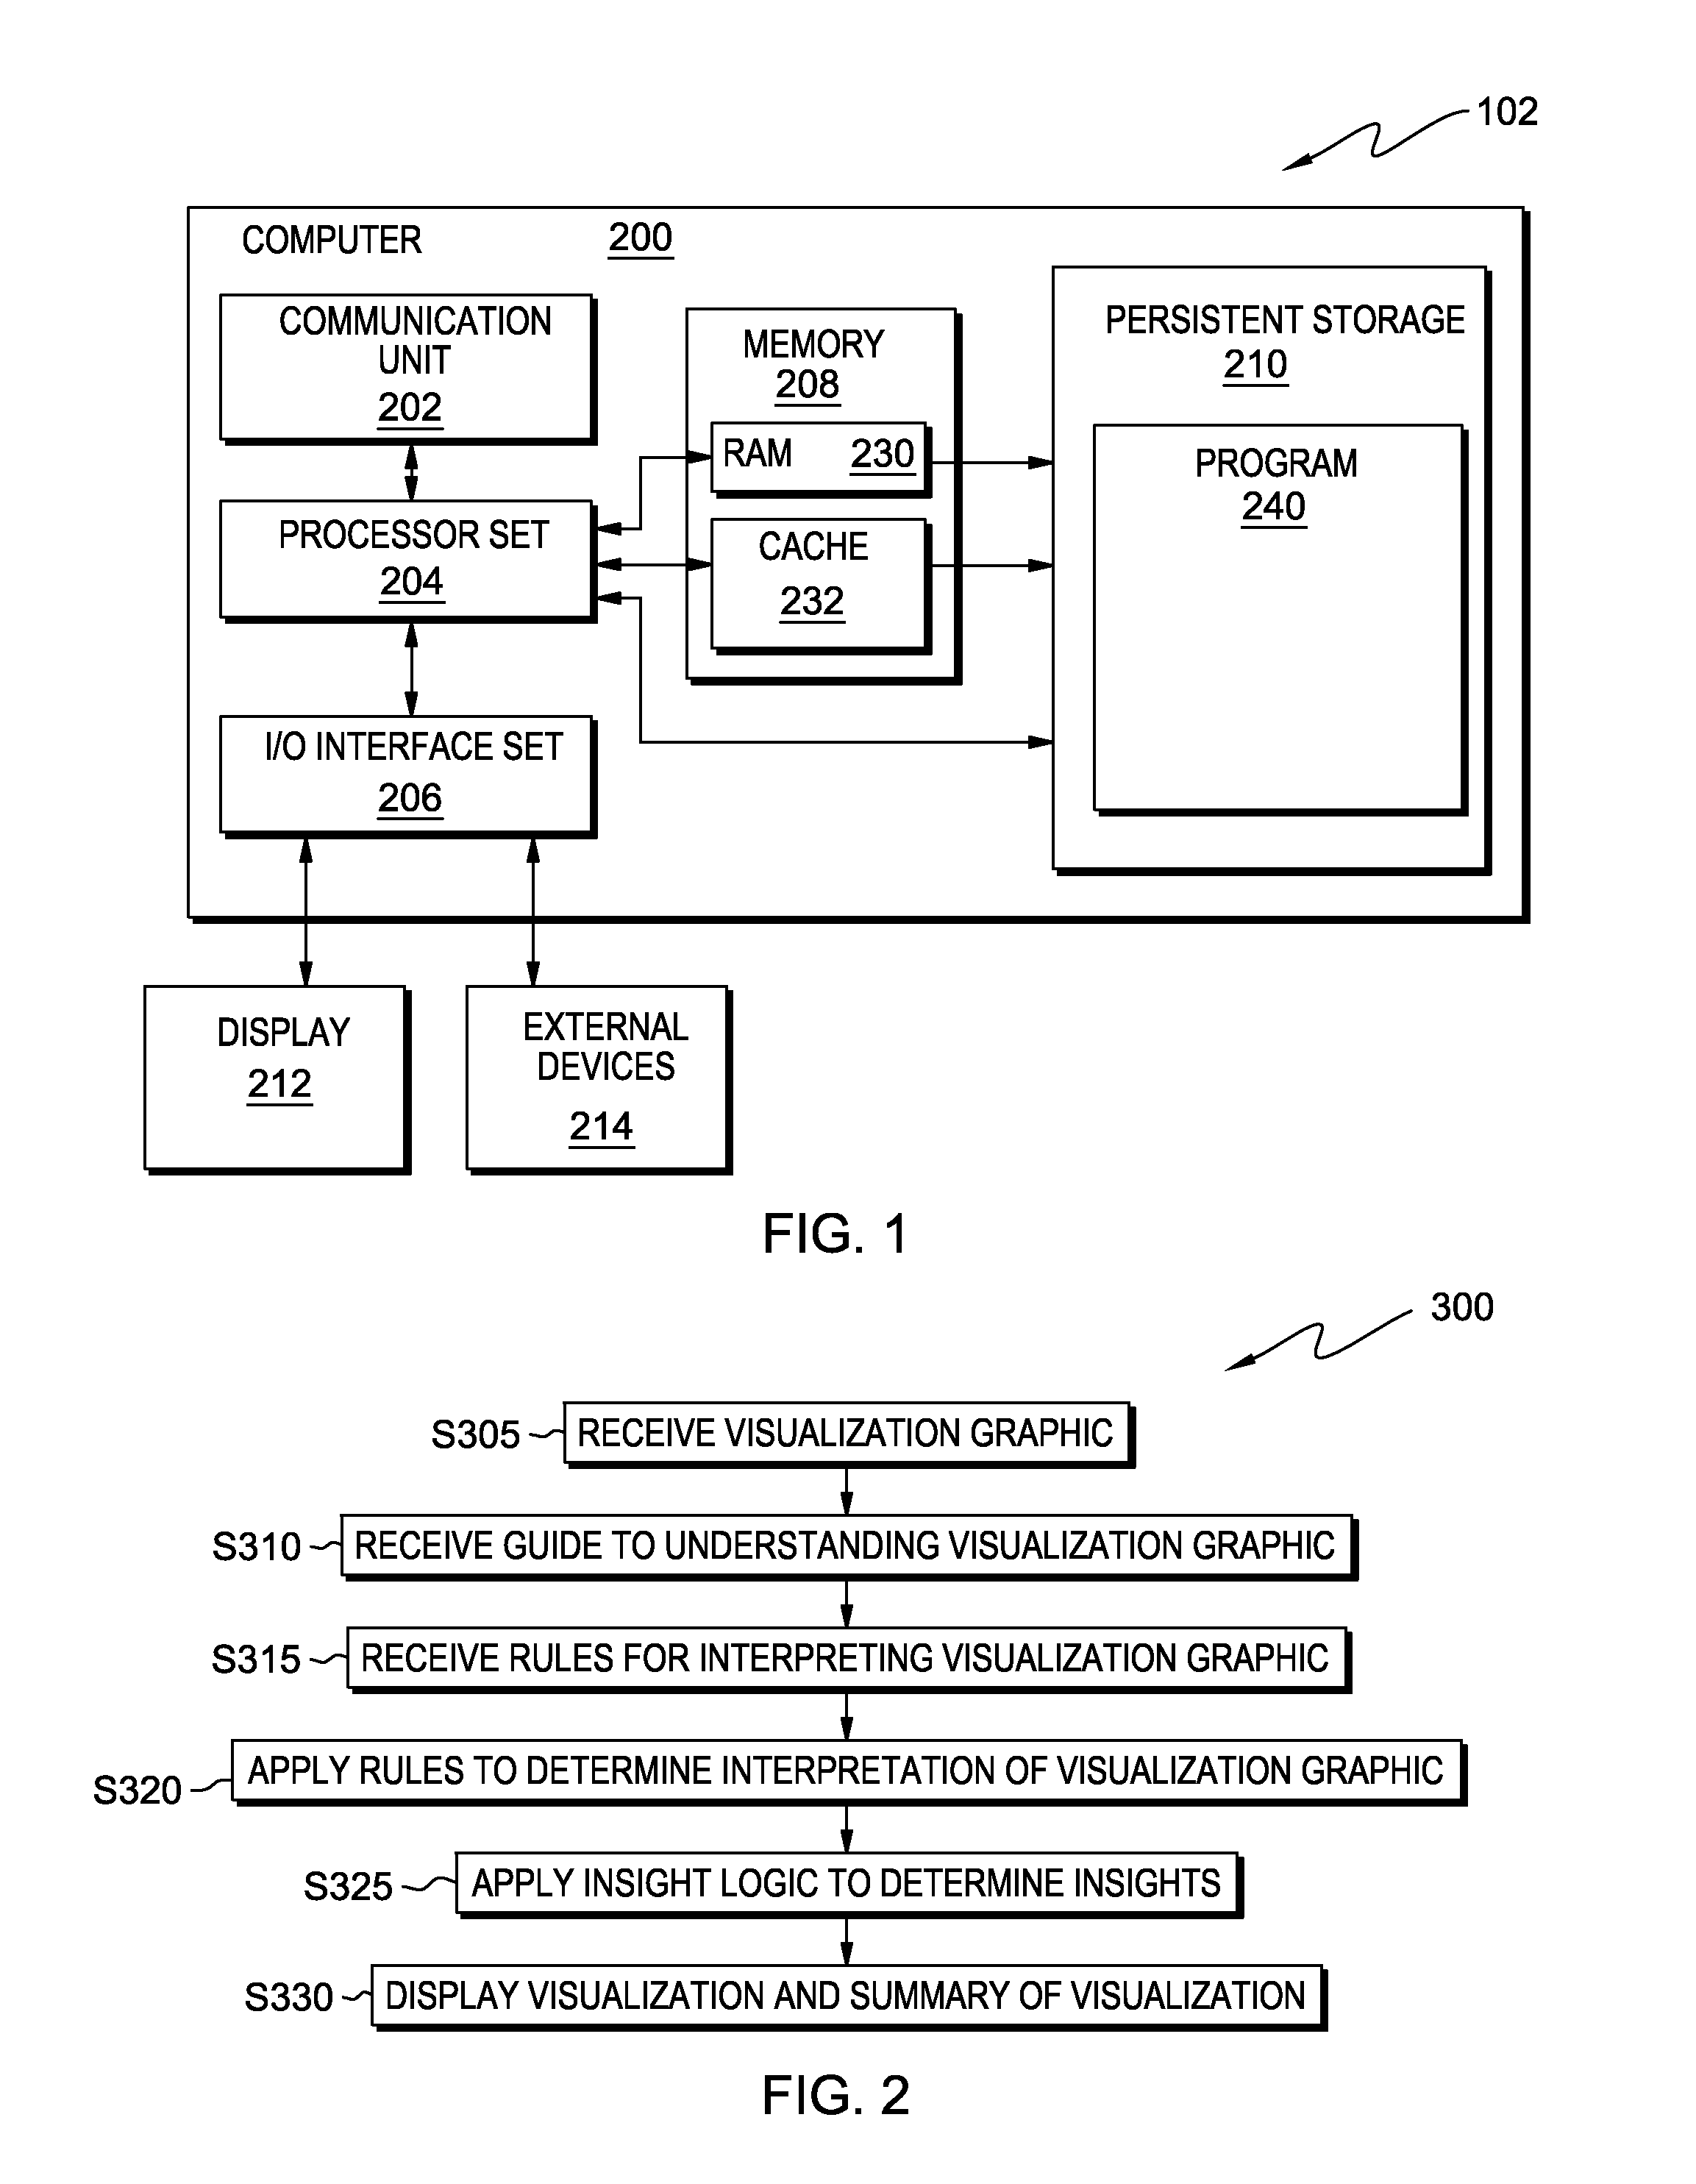
[0035]Preliminary note: The flowchart and block diagrams in the following Figures illustrate the architecture, functionality, and operation of possible implementations of systems, methods and computer program products according to various embodiments of the present invention. In this regard, each block in the flowchart or block diagrams may represent a module, segment, or portion of code, which comprises one or more executable instructions for implementing the specified logical function(s). It should also be noted that, in some alternative implementations, the functions noted in the block may occur out of the order noted in the figures. For example, two blocks shown in succession may, in fact, be executed substantially concurrently, or the blocks may sometimes be executed in the reverse order, depending upon the functionality involved. It will also be noted that each block of the block diagrams and / or flowchart illustration, and combinations of blocks in the bloc...


PUM


Abstract

Machine logic that can display a visualization and also present a visualization summary. The visualization summary includes one or more of the following: (i) a guide for a user's interpretation of the visualization; (ii) a machine-logic generated interpretation of at least one portion of the visualization; and/or (iii) insight information based, at least in part, on the machine-logic generated interpretation of the visualization. The machine-logic based interpretation is based on rules that are applied based, at least in part, upon features and/or characteristics of the visualization.

Description

FIELD OF THE INVENTION[0001]The present invention relates generally to the field of human understandable visual data presentation (for example, graphs).BACKGROUND OF THE INVENTION[0002]The saying “a picture is worth a thousand words” refers to the notion that a complex idea and / or voluminous information can be conveyed with just a single still image. It is often an objective of visual images to convey information and / or insights derivable from information in a manner that is concise and clear. For purposes of this document, “visualization” is defined as any technique for creating images, diagrams, or animations to communicate information and / or insight derivable from the information. Examples from history of advances in the art and technology of visualization include cave paintings, Egyptian hieroglyphs, Greek geometry, and Leonardo da Vinci's revolutionary methods of technical drawing for engineering and scientific purposes. Moving to more recent times, some displays of charts or g...

Claims


Application Information

Patent Timeline
Patent Type & Authority Applications(United States)
IPC IPC(8): G06K9/62G06V30/40
CPCG06K9/6217G06T11/206G06V30/40G06F18/21
Inventor CHATURVEDI, NITINMAYASKAR, NIKHILMISHRA, VARUN K.
Owner GLOBALFOUNDRIES US INC
Why Eureka
Try Eureka