Method and apparatus for enhanced estimation of an analyte property through multiple region transformation

an analyte property and multiple region technology, applied in the field of enhancement of estimation of analyte properties or concentrations, can solve problems such as affecting the analysis of matrixes, and achieve the effect of enhancing parameters and enhancing analysis of analyte concentrations

Active Publication Date: 2009-11-17
GLT ACQUISITION
View PDF8 Cites 288 Cited by
  • Summary
  • Abstract
  • Description
  • Claims
  • Application Information

AI Technical Summary

Problems solved by technology

Data matrices representative of a sample contain information related to a signal, have noise that hinders analysis of the matrix, and often have interfering features related to constituents within the sample or the instrument.
Similarly, interference characteristics, such as signal, noise, and resolution often vary along an axis of the data matrix that represents a sample.

Method used


Image

  • Method and apparatus for enhanced estimation of an analyte property through multiple region transformation
  • Method and apparatus for enhanced estimation of an analyte property through multiple region transformation
  • Method and apparatus for enhanced estimation of an analyte property through multiple region transformation

Examples


example 1

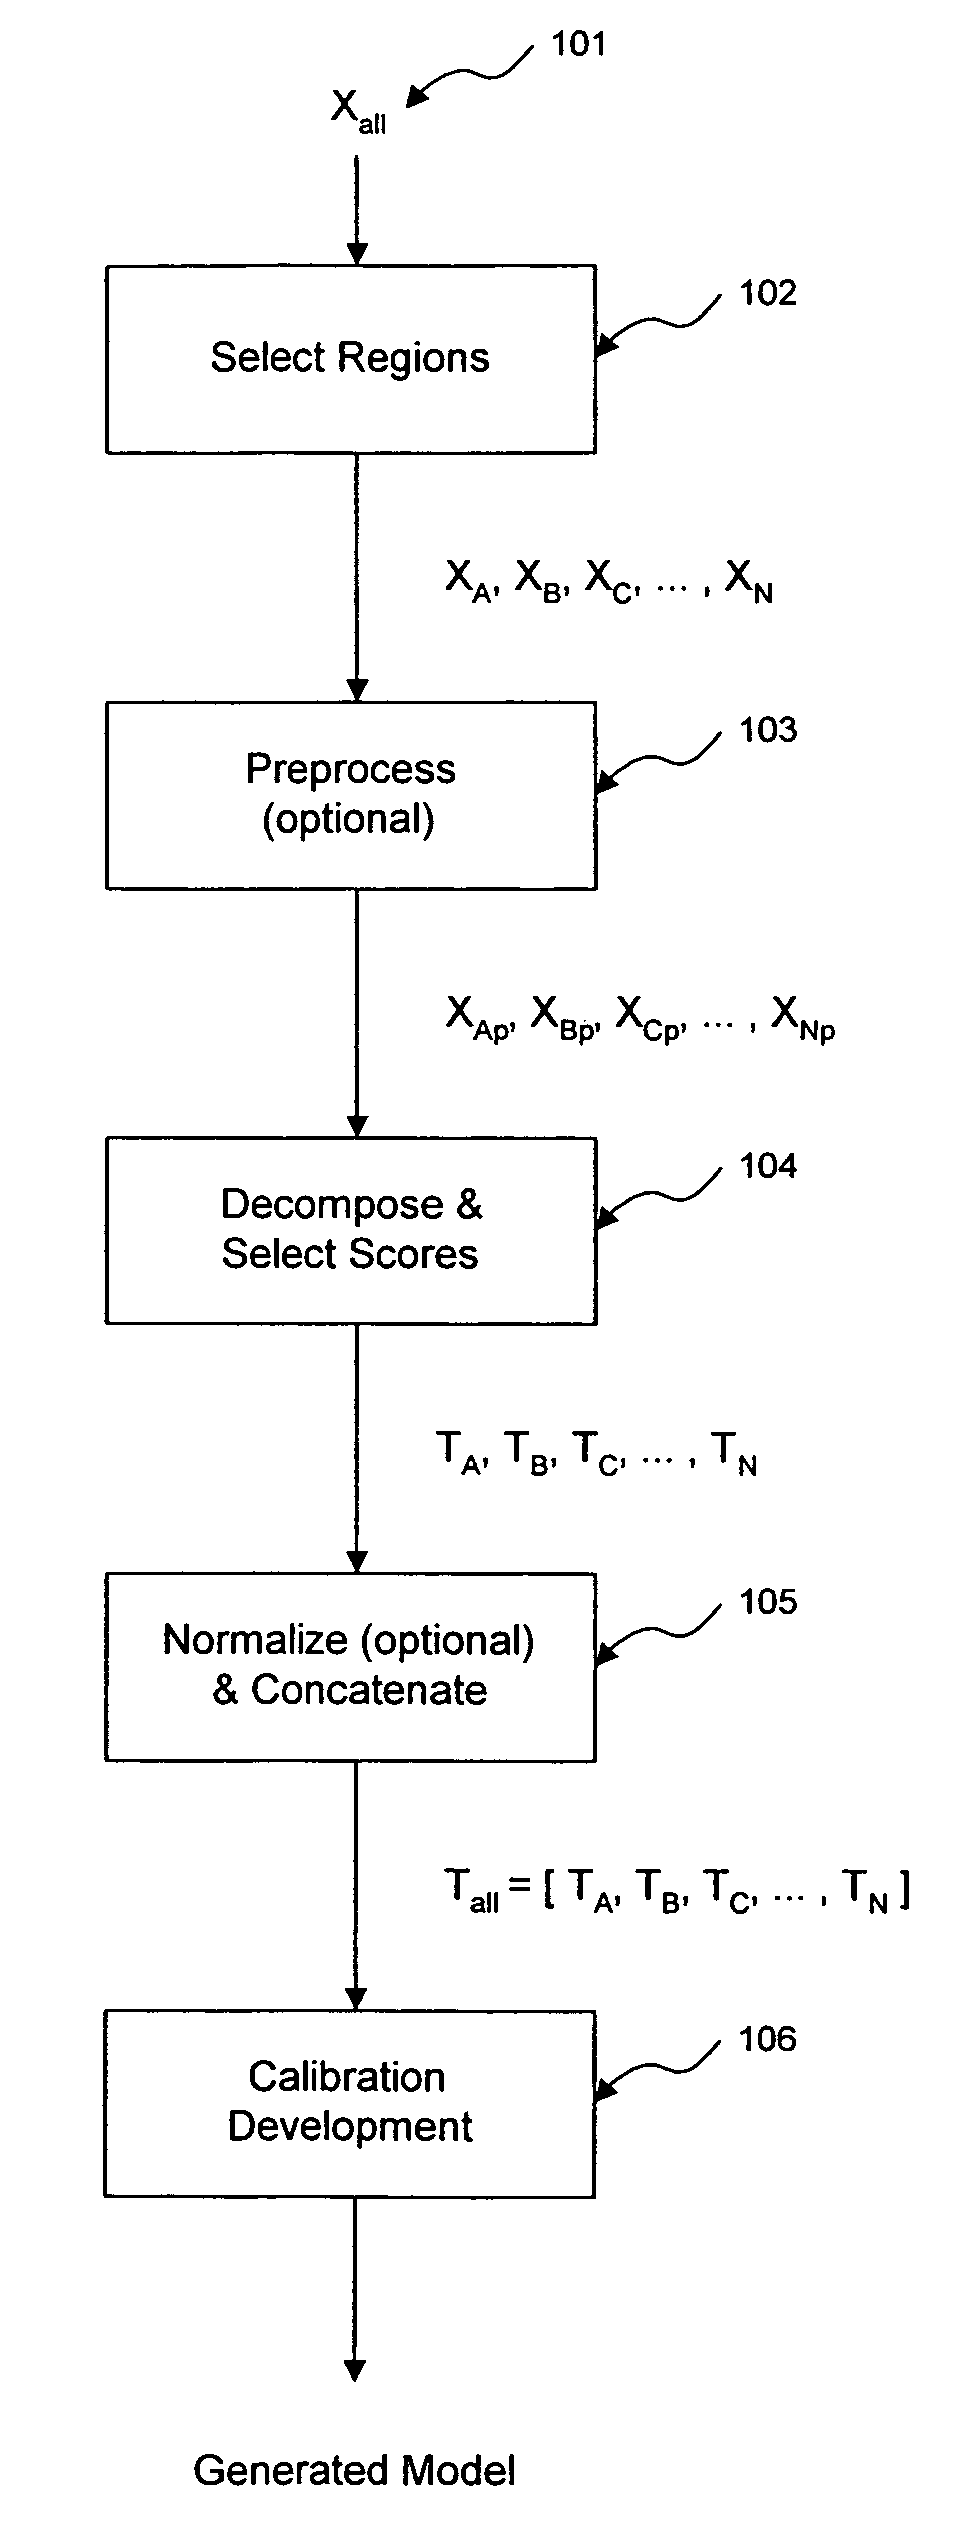
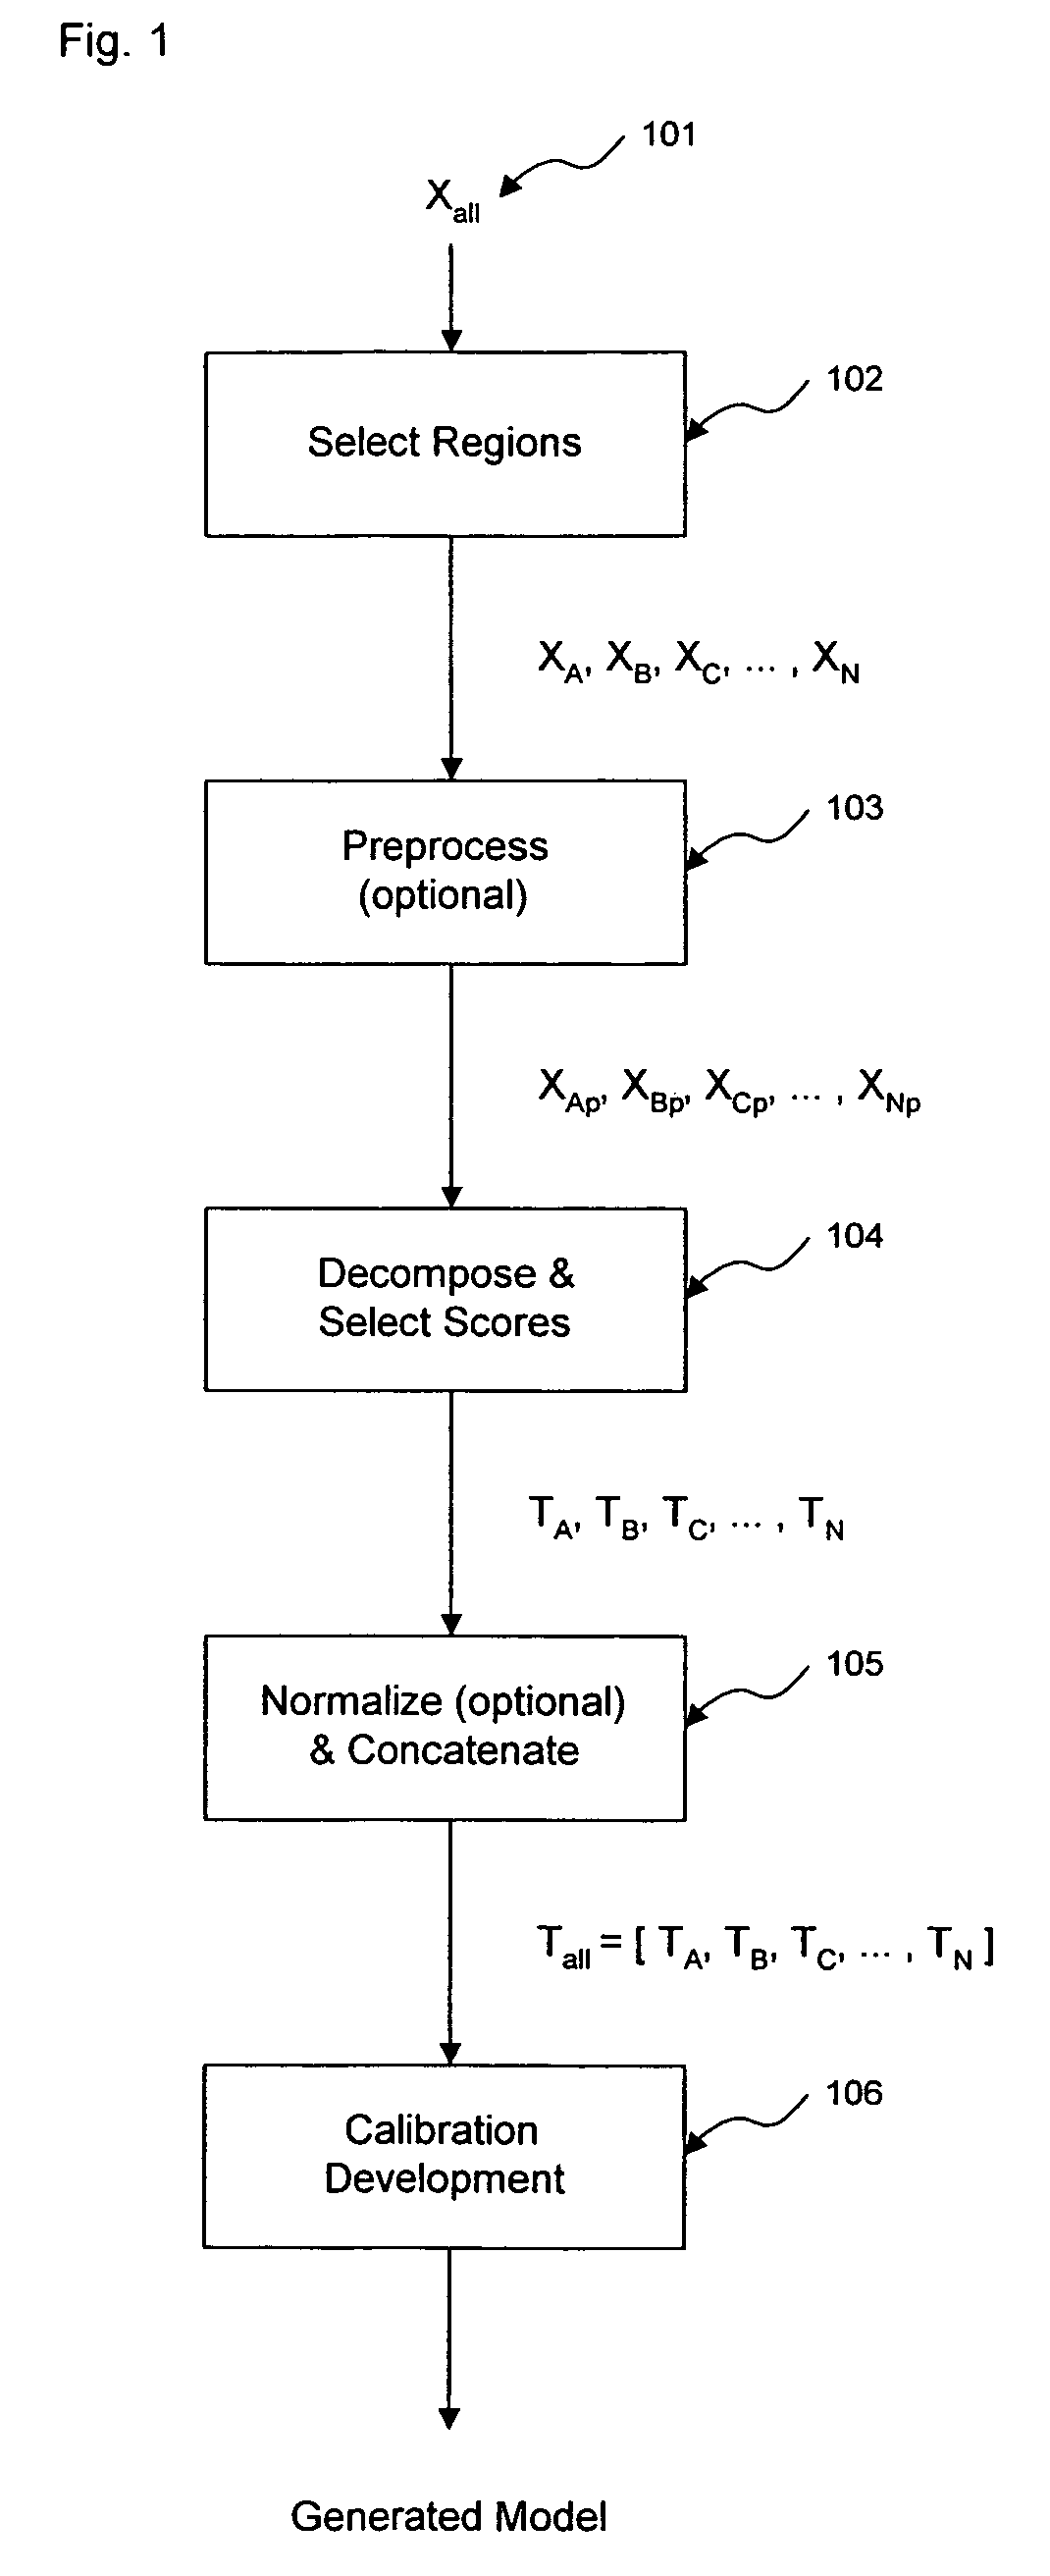
[0060]A specific example of separately decomposing two matrices with one of the matrices having a region of larger variance is provided. As described below, the example uses near-infrared (near-IR) spectra collected noninvasively to build a model subsequently used to estimate glucose concentrations. The initial matrix of spectra, Xall, are processed with a traditional single decomposition analysis for comparison with the two separate decomposition approach.

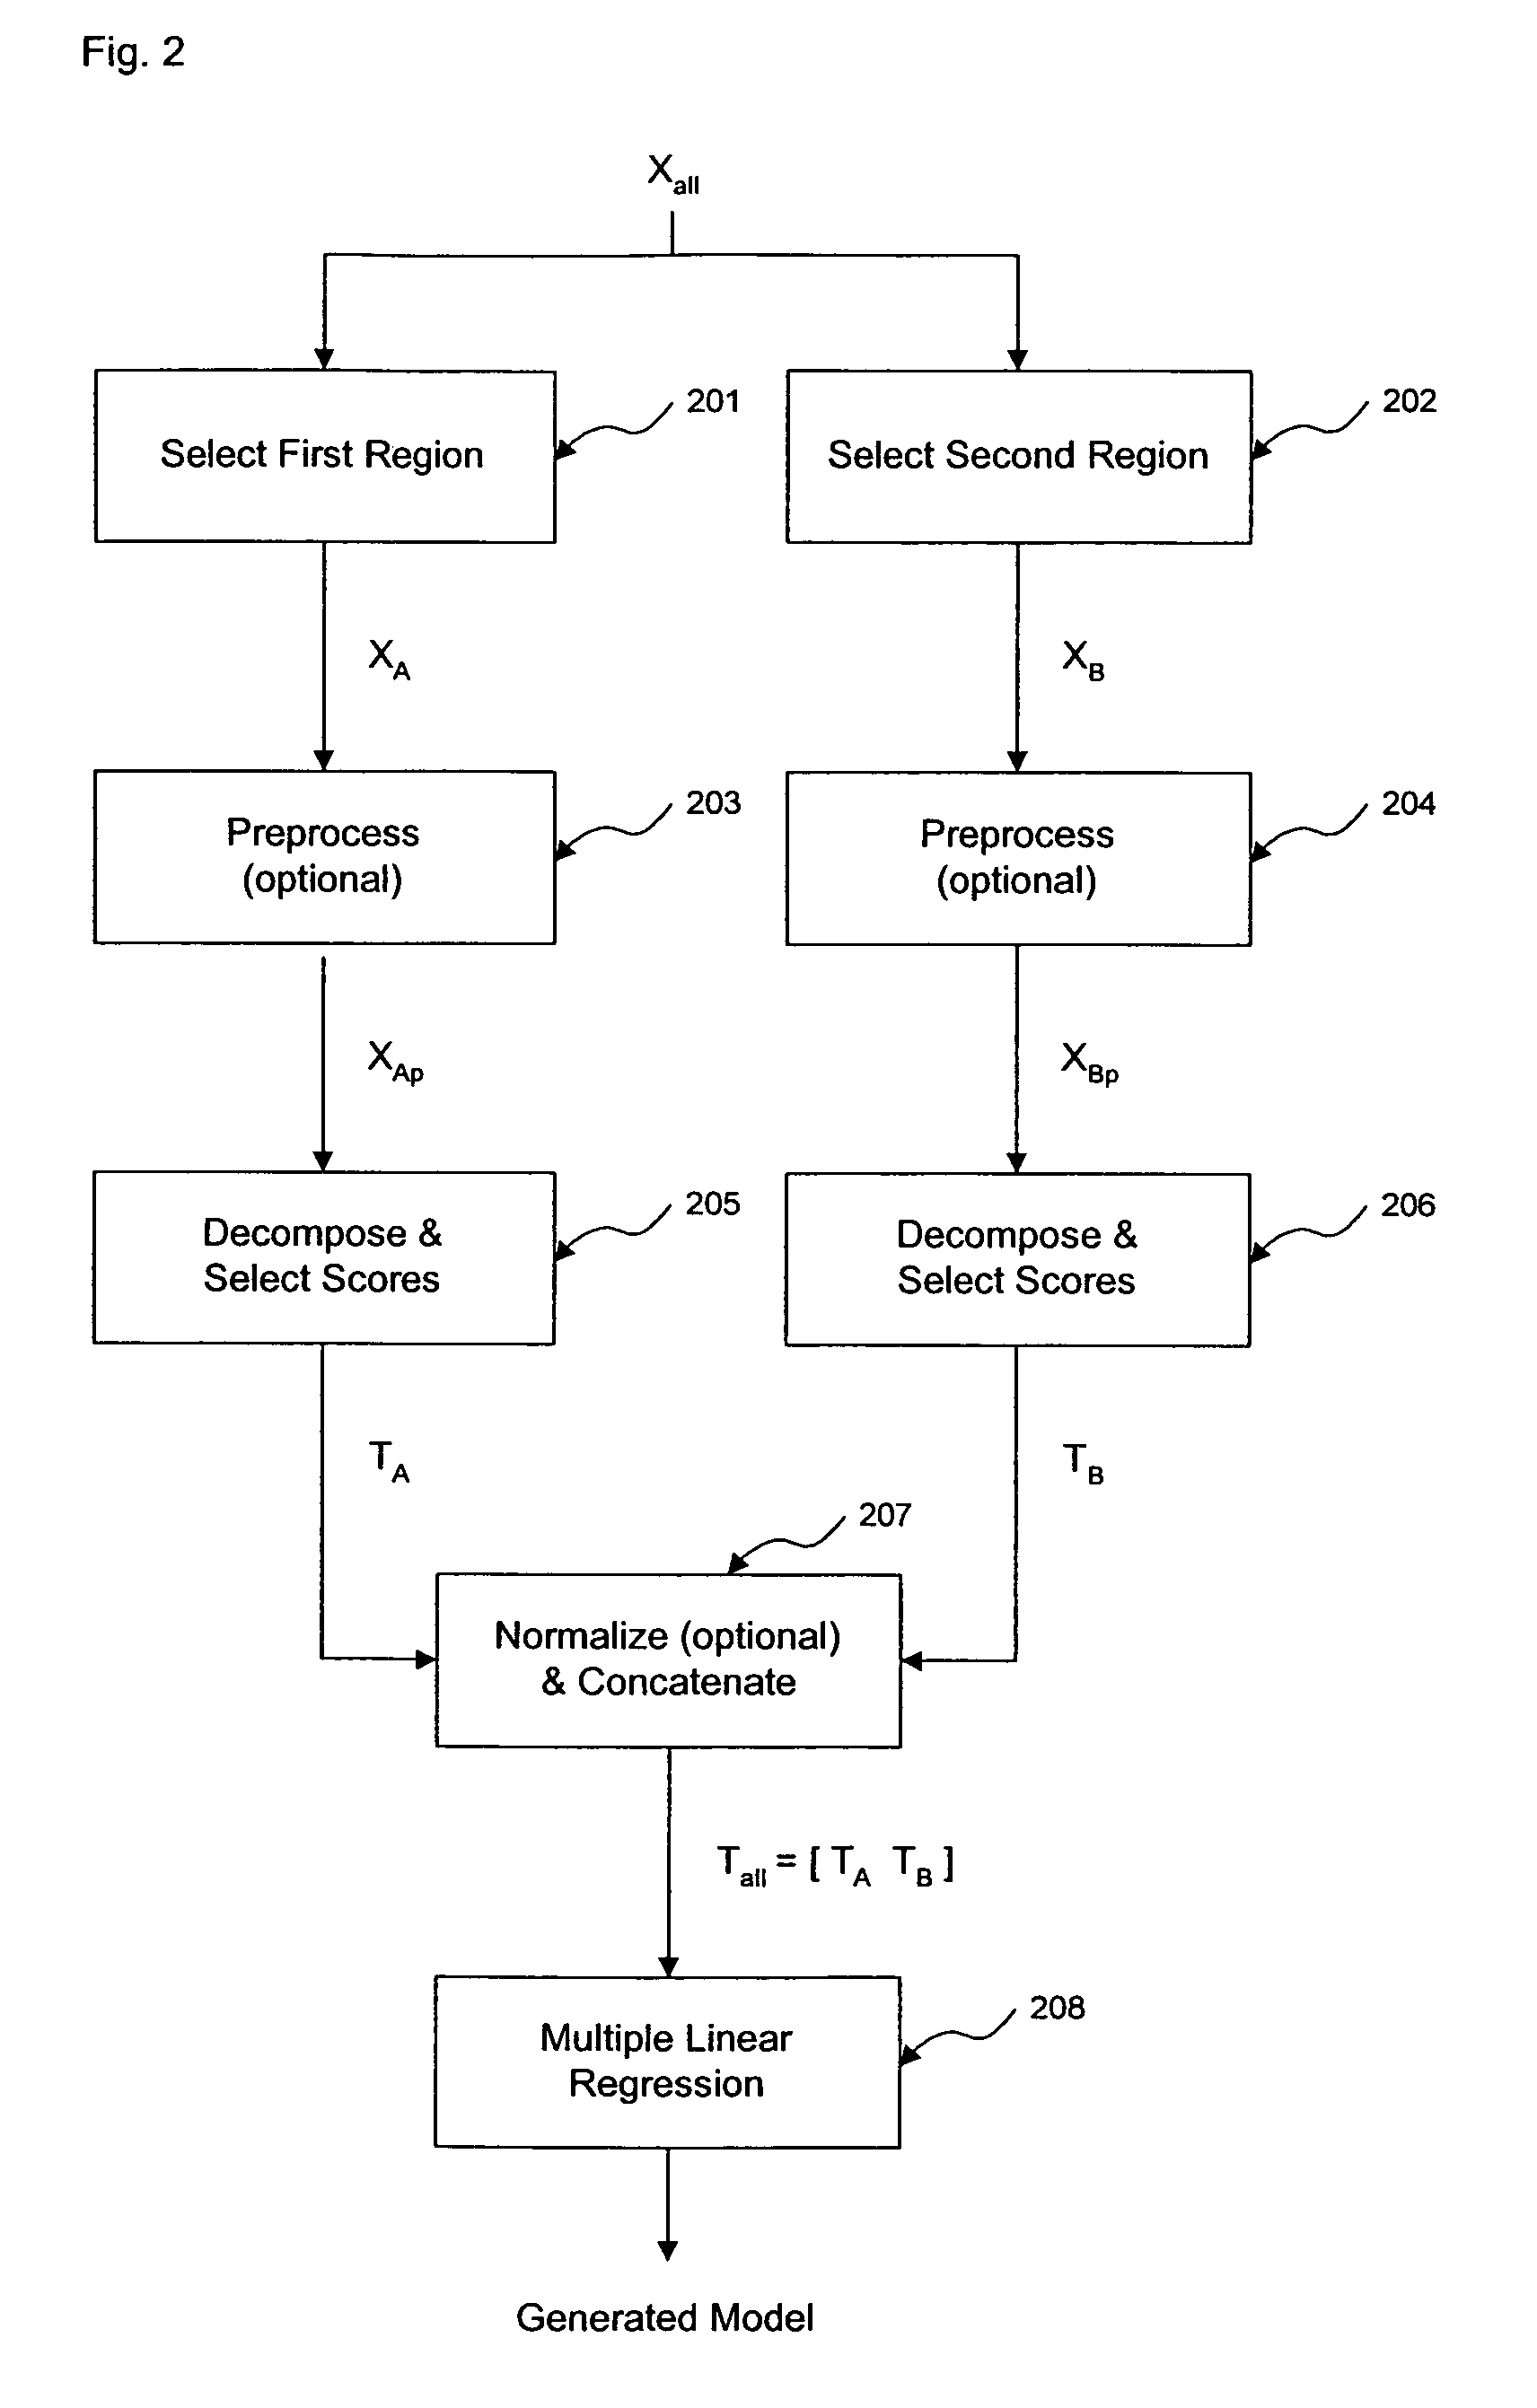
[0061]In this example, decomposition of two spectral regions of a data matrix of noninvasive spectra of human tissue is performed so that determination of blood glucose concentration is provided. For comparative purposes, a parallel analysis with a single decomposition is also performed. A detailed description follows.

[0062]It is determined that signal, noise, resolution, and pathlength considerations often dictate that the analysis of noninvasive near-IR spectra of aqueous solutions having small analytical signals, such as the fi...

example 2

[0076]The analyzers used in the first example were used to collect the data set used in this example. The single data matrix based decomposition uses a calibration matrix representing 2939 spectra collected on a total of six subjects using three analyzers over a five week period. The two decomposition approach uses a data set representing 846 spectra collected using five subjects on a total of six analyzers. For both the single and multiple decomposition calibrations, a single prediction data set is used. The prediction matrix represents 141 samples from five different subjects collected over a total of six visits on a single analyzer over a period of eight days collected roughly five months after the end of collection of the calibration data matrices.

[0077]The single decomposition approach applied to Xall in absorbance preprocesses the spectra in four steps: 1) a 41-point first derivative Savitsky-Golay smoothing convolution; 2) multiplicative scatter correction; 3) mean centering;...


PUM

PropertyMeasurementUnit
wavelengthsaaaaaaaaaa
near-infrared spectraaaaaaaaaaa

Abstract

The invention comprises transformation of a section of a data block independently of the transformation of separate or overlapping data blocks to determine a property related to the original matrix, where each of the separate or overlapping data blocks are derived from an original data matrix. The transformation enhances parameters of a first data block over a given region of an axis of the data matrix, such as signal-to-noise, without affecting analysis of a second data block derived from the data matrix. This allows for enhancement of analysis of an analyte property, such as concentration, represented within the original data matrix. A separate decomposition and factor selection for each selected data matrix is performed with subsequent score matrix concatenization. The combined score matrix is used to generate a model that is subsequently used to estimate a property, such as concentration represented in the original data matrix.

Description

CROSS REFERENCE TO RELATED APPLICATIONS[0001]This document claims priority to U.S. provisional patent application No. 60 / 558,610 filed Mar. 31, 2004. This document also claims priority to U.S. patent application Ser. No. 10 / 472,856, filed Sep. 18, 2003, which claims priority to PCT application No. PCT / US03 / 07065, filed Mar. 7, 2003, which claims priority to U.S. provisional patent application No. 60 / 362,885, filed Mar. 8, 2002 all of which are incorporated herein in their entirety by this reference thereto.BACKGROUND OF THE INVENTION[0002]1. Field of the Invention[0003]The invention relates generally to an enhancement of estimation of an analyte property or concentration represented by a data matrix. In particular, the invention relates to a method and apparatus for enhanced estimation of an analyte property through multiple region transformation.[0004]2. Discussion of the Prior Art[0005]Preprocessing and multivariate analysis are well-established tools for extracting a spectroscopi...

Claims


Application Information

Patent Timeline
Patent Type & Authority Patents(United States)
IPC IPC(8): G06F17/14G06F7/38A61B5/00G01N21/35G06F17/10
CPCA61B5/14532A61B5/1455G01N21/359A61B5/1495A61B2560/0223
Inventor RUCHTI, TIMOTHY L.LORENZ, ALEXANDER D.HAZEN, KEVIN H.
Owner GLT ACQUISITION
Why Eureka
Try Eureka