
Method for setting analysis target region by extracting, from an observed image divisional areas having a value of image characteristic quantity within a value range

a technology of image characteristic quantity and analysis target region, which is applied in the direction of optical radiation measurement, instruments, spectrometry/spectrophotometry/monochromators, etc., can solve the problem of difficulty in accurately specifying parameters, and achieve the effect of setting more quickly and accurately

Inactive Publication Date: 2019-06-27
SHIMADZU CORP
View PDF4 Cites 0 Cited by
  • Summary
  • Abstract
  • Description
  • Claims
  • Application Information

AI Technical Summary

Benefits of technology

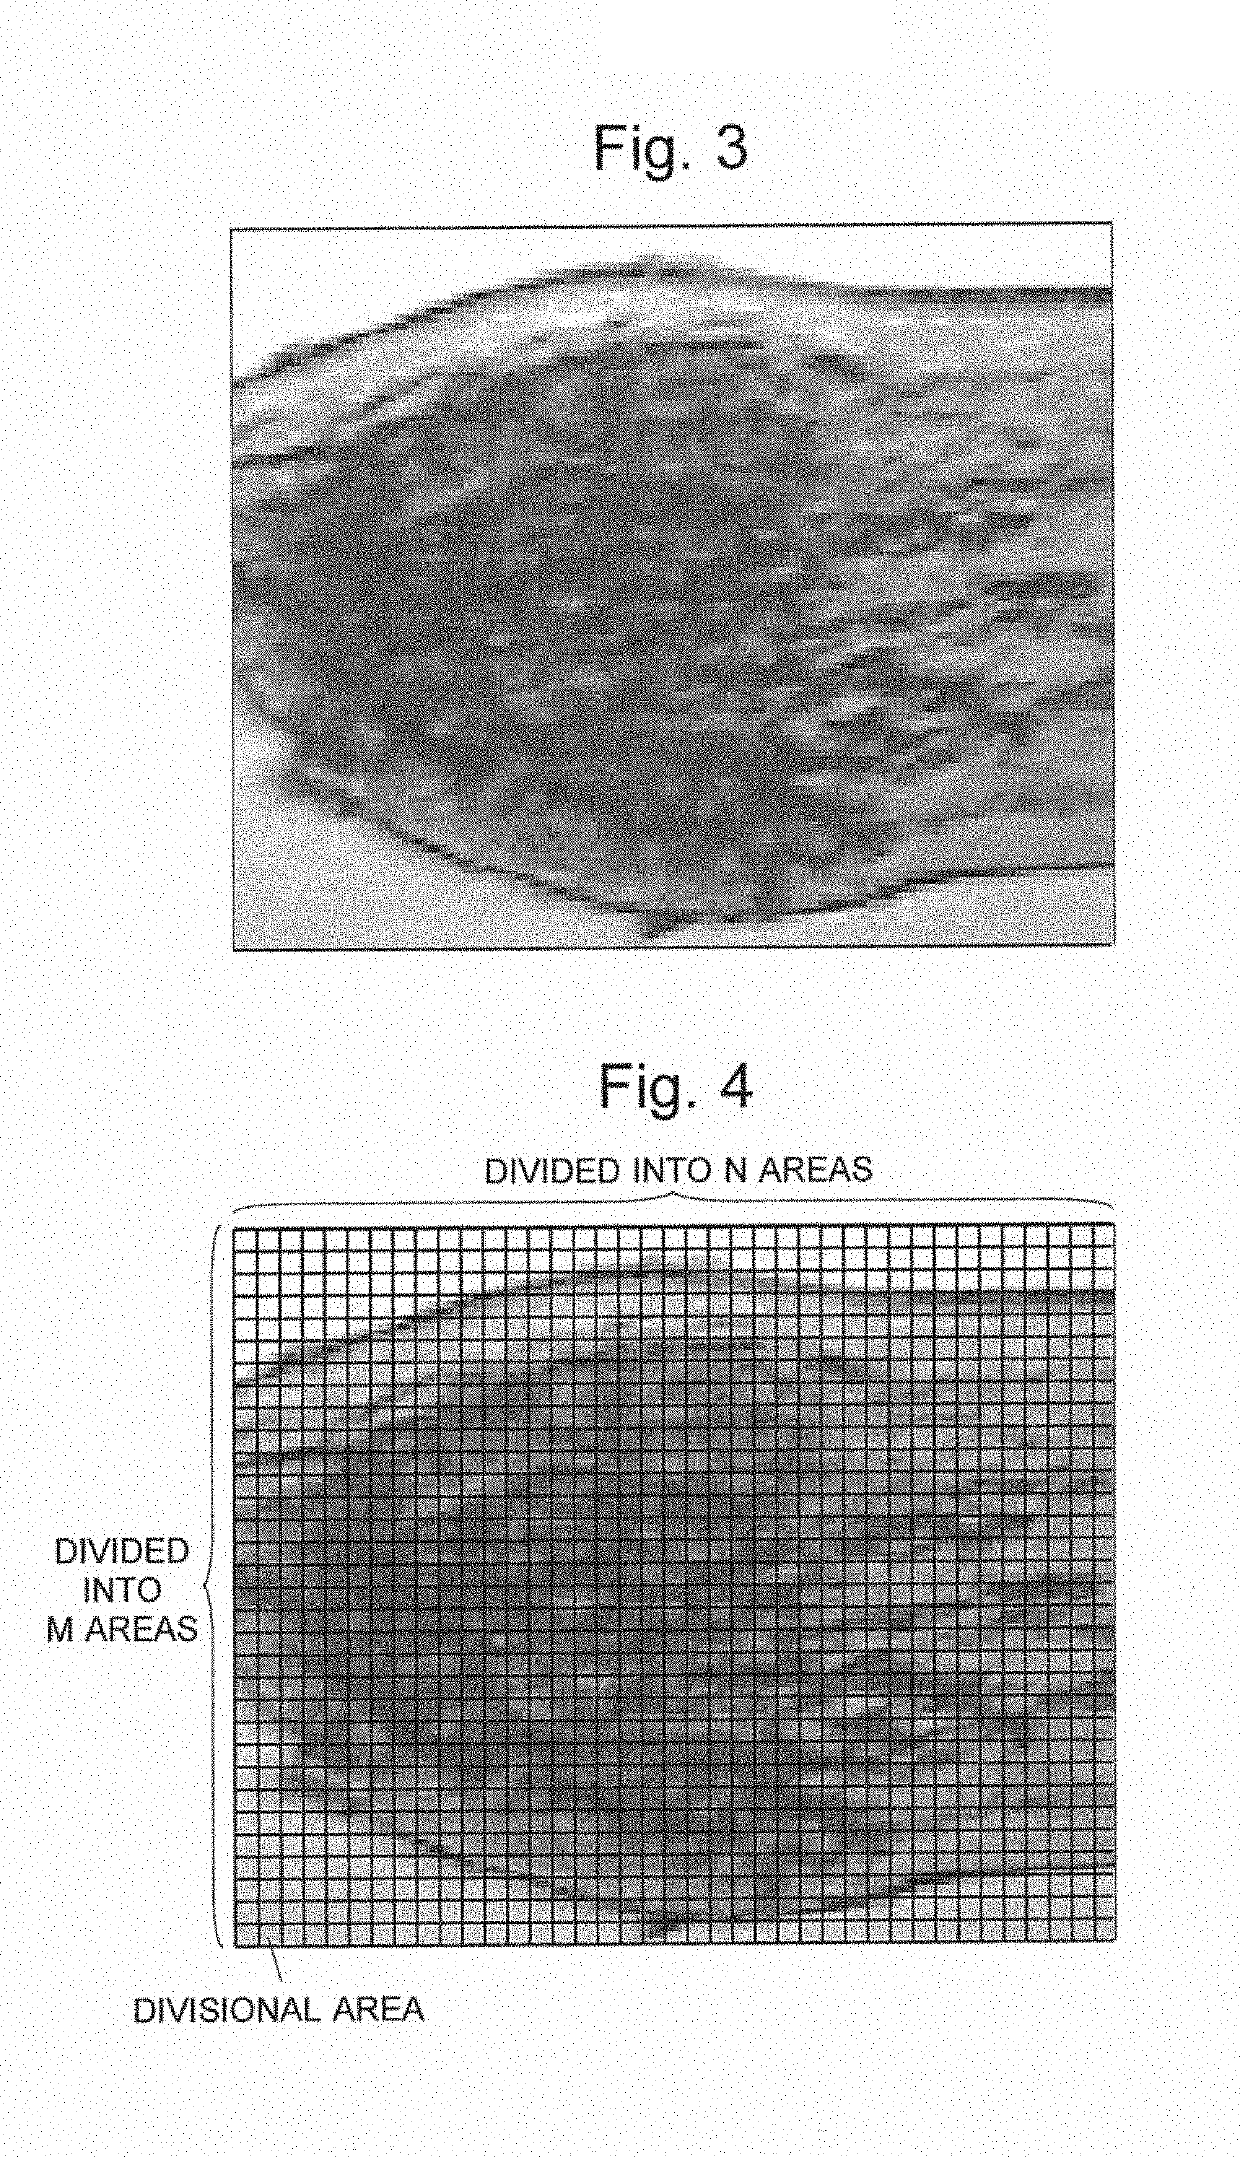
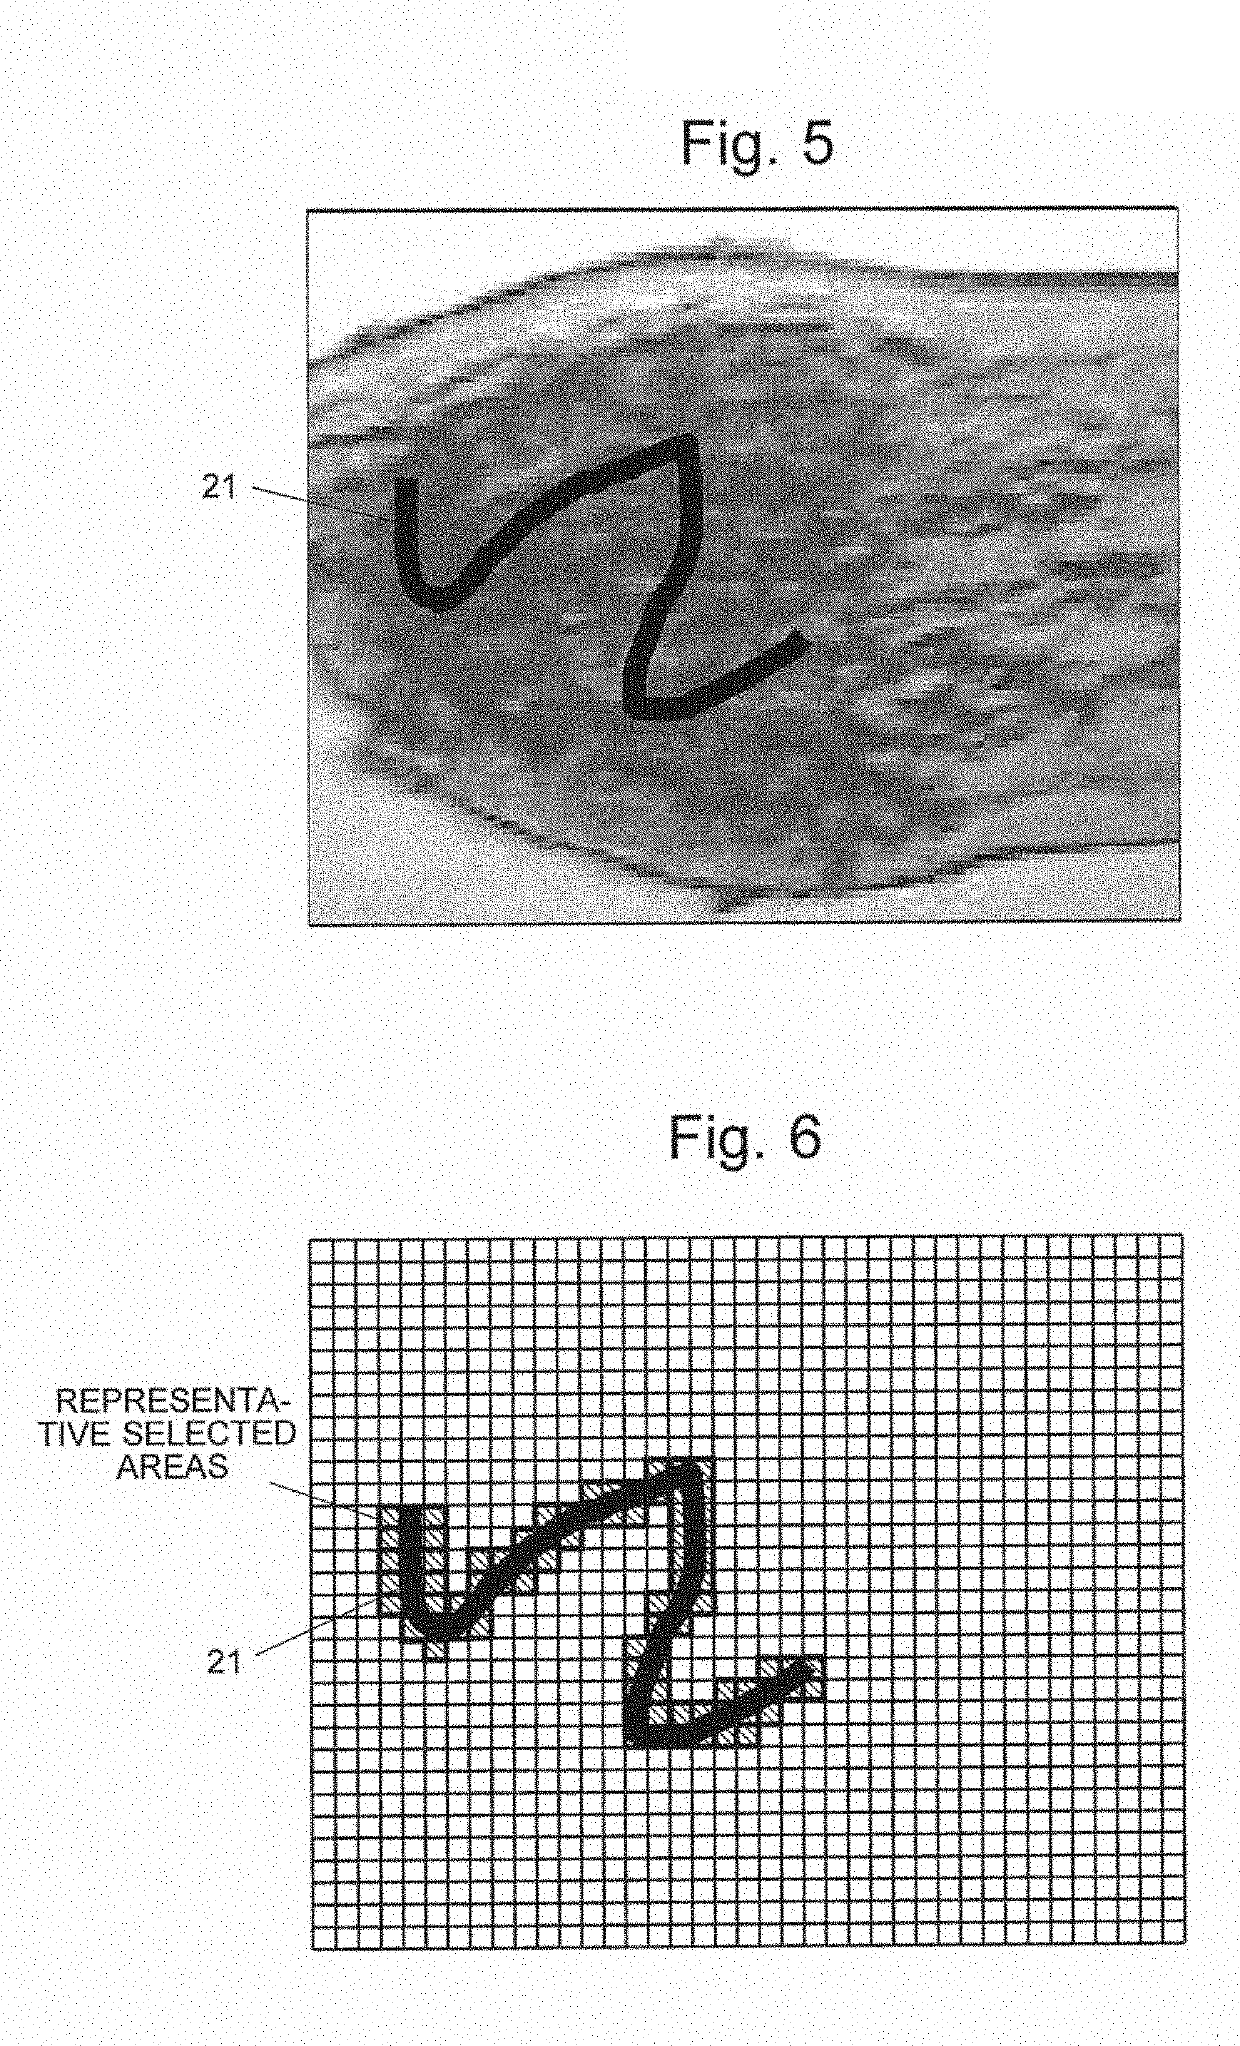
[0022]In the system for setting an analysis target region according to the present invention, an observed image of a sample is divided into a large number of divisional areas, from which users are allowed to select a plurality of divisional areas (representative selected areas). In this operation, only a partial and representative set of the divisional areas needs to be selected. Based on the characteristic quantity data of the representative selected areas, a value range to be set for the analysis target region is calculated. Each divisional area having a characteristic quantity value included in that range is extracted from the observed image and designated as the analysis target region. By this configuration, the analysis target region can be set more quickly and accurately (with neither any excess nor deficiency) than in the case of setting the region by using either an exclusive manual or automatic process.

Problems solved by technology

However, for example, if the region of interest has a complex shape, it is difficult to accurately specify those parameters so as to satisfy the aforementioned condition.

Method used


Image

  • Method for setting analysis target region by extracting, from an observed image divisional areas having a value of image characteristic quantity within a value range
  • Method for setting analysis target region by extracting, from an observed image divisional areas having a value of image characteristic quantity within a value range
  • Method for setting analysis target region by extracting, from an observed image divisional areas having a value of image characteristic quantity within a value range

Examples


embodiments

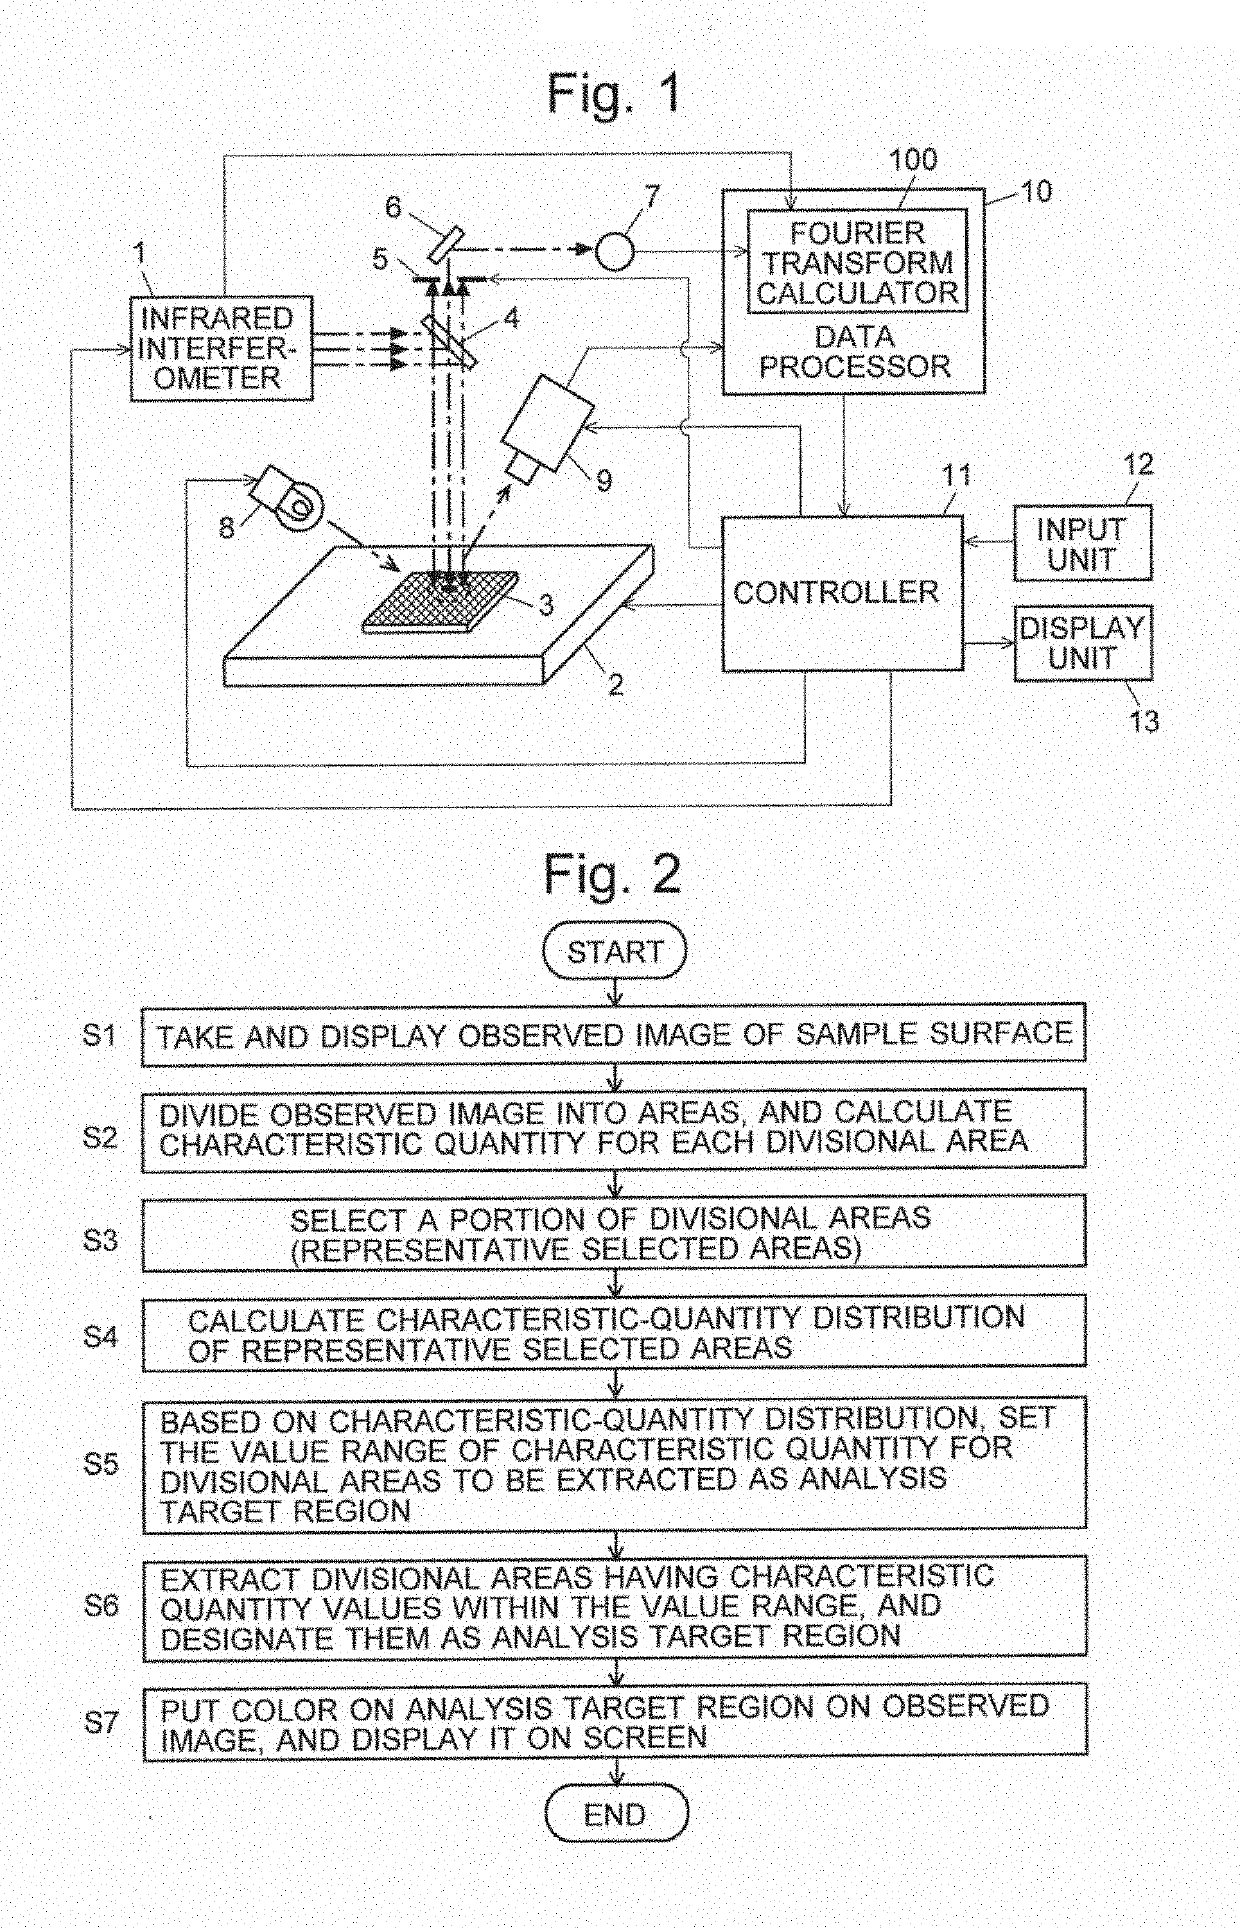
[0034]An infrared microscope as one embodiment of the present invention will be described with reference to the drawings. FIG. 1 is a configuration diagram showing the main components of the infrared microscope of the present embodiment.

[0035]In FIG. 1, an infrared interferometer 1 includes an infrared source, fixed mirror, movable mirror, beam splitter and other devices. It emits an infrared interference light produced by an interference of infrared rays having different wavelengths. The infrared interference light is reflected by a half mirror 4 and cast onto a sample 3 placed on a movable stage 2. When the infrared interference light cast onto the sample 3 is reflected by the surface, the light undergoes absorption at one or more wavelengths (normally, at multiple wavelengths) specific to the substances present on that location. The infrared light reflected from the sample 3 passes through the half mirror 4 and reaches the aperture element 5, which admits only the reflected light...


PUM

PropertyMeasurementUnit
areasaaaaaaaaaa
optical systemaaaaaaaaaa
optical microscopeaaaaaaaaaa

Abstract

A method for setting, within an observed image of a sample, an analysis target region that is a region on which an analysis is to be performed by an analyzer, the method including displaying the observed image of the sample on the display, dividing the observed image into a plurality of divisional areas, calculating a predetermined image characteristic quantity in each of the plurality of divisional areas, designating at least two of the divisional areas of the observed image displayed on the display, calculating a distribution of the values of the image characteristic quantity of the designated divisional areas, determining a value range of the image characteristic quantity for the divisional areas to be extracted as the analysis target region, based on the calculated distribution, and extracting from the observed image each of the plurality of divisional areas having a value of the image characteristic quantity within the value range.

Description

CROSS REFERENCE TO RELATED APPLICATION[0001]This application is a Divisional of U.S. patent application Ser. No. 14 / 442,812, filed on May 14, 2015, which is a National Stage of International Application No. PCT / JP2012 / 079617 filed Nov. 15, 2012, the contents of all of which are incorporated herein by reference in their entirety.TECHNICAL FIELD[0002]The present invention relates to a method for setting an analysis target region within an observed sample image obtained with an observation optical system, such as an optical microscope.BACKGROUND ART[0003]A microspectroscopy apparatus is a device which is provided with an observation optical system for microscopically observing a sample surface and an analyzing system for performing a spectroscopic analysis on a portion of interest within the observed area. For example, a microscopic infrared spectroscopic analyzer which performs an analysis using infrared light has: an illumination optical system acting as the aforementioned analyzing ...

Claims


Application Information

Patent Timeline
Patent Type & Authority Applications(United States)
IPC IPC(8): G02B21/36G01J3/453G01N21/3563G01J3/02
CPCG02B21/36G02B21/365G01J3/453G01N21/3563G01J3/0248G01N2021/3595
Inventor NODA, AKIRAMAEKAWA, HIROSHI
Owner SHIMADZU CORP
Learn More