Method of analysis of the electrocardiogram

a technology of electrocardiogram and analysis method, which is applied in the field of electrocardiogram analysis method, can solve the problem that hv that exceeds these borders is a sign of abnormality

Inactive Publication Date: 2004-06-22
TOOLE J GERALD
View PDF4 Cites 210 Cited by
  • Summary
  • Abstract
  • Description
  • Claims
  • Application Information

AI Technical Summary

Problems solved by technology

There will be defined borders that a normal HV will fall into and any HV that exceeds these borders will be a sign of abnormality.

Method used


Image

  • Method of analysis of the electrocardiogram
  • Method of analysis of the electrocardiogram
  • Method of analysis of the electrocardiogram

Examples


example calculation

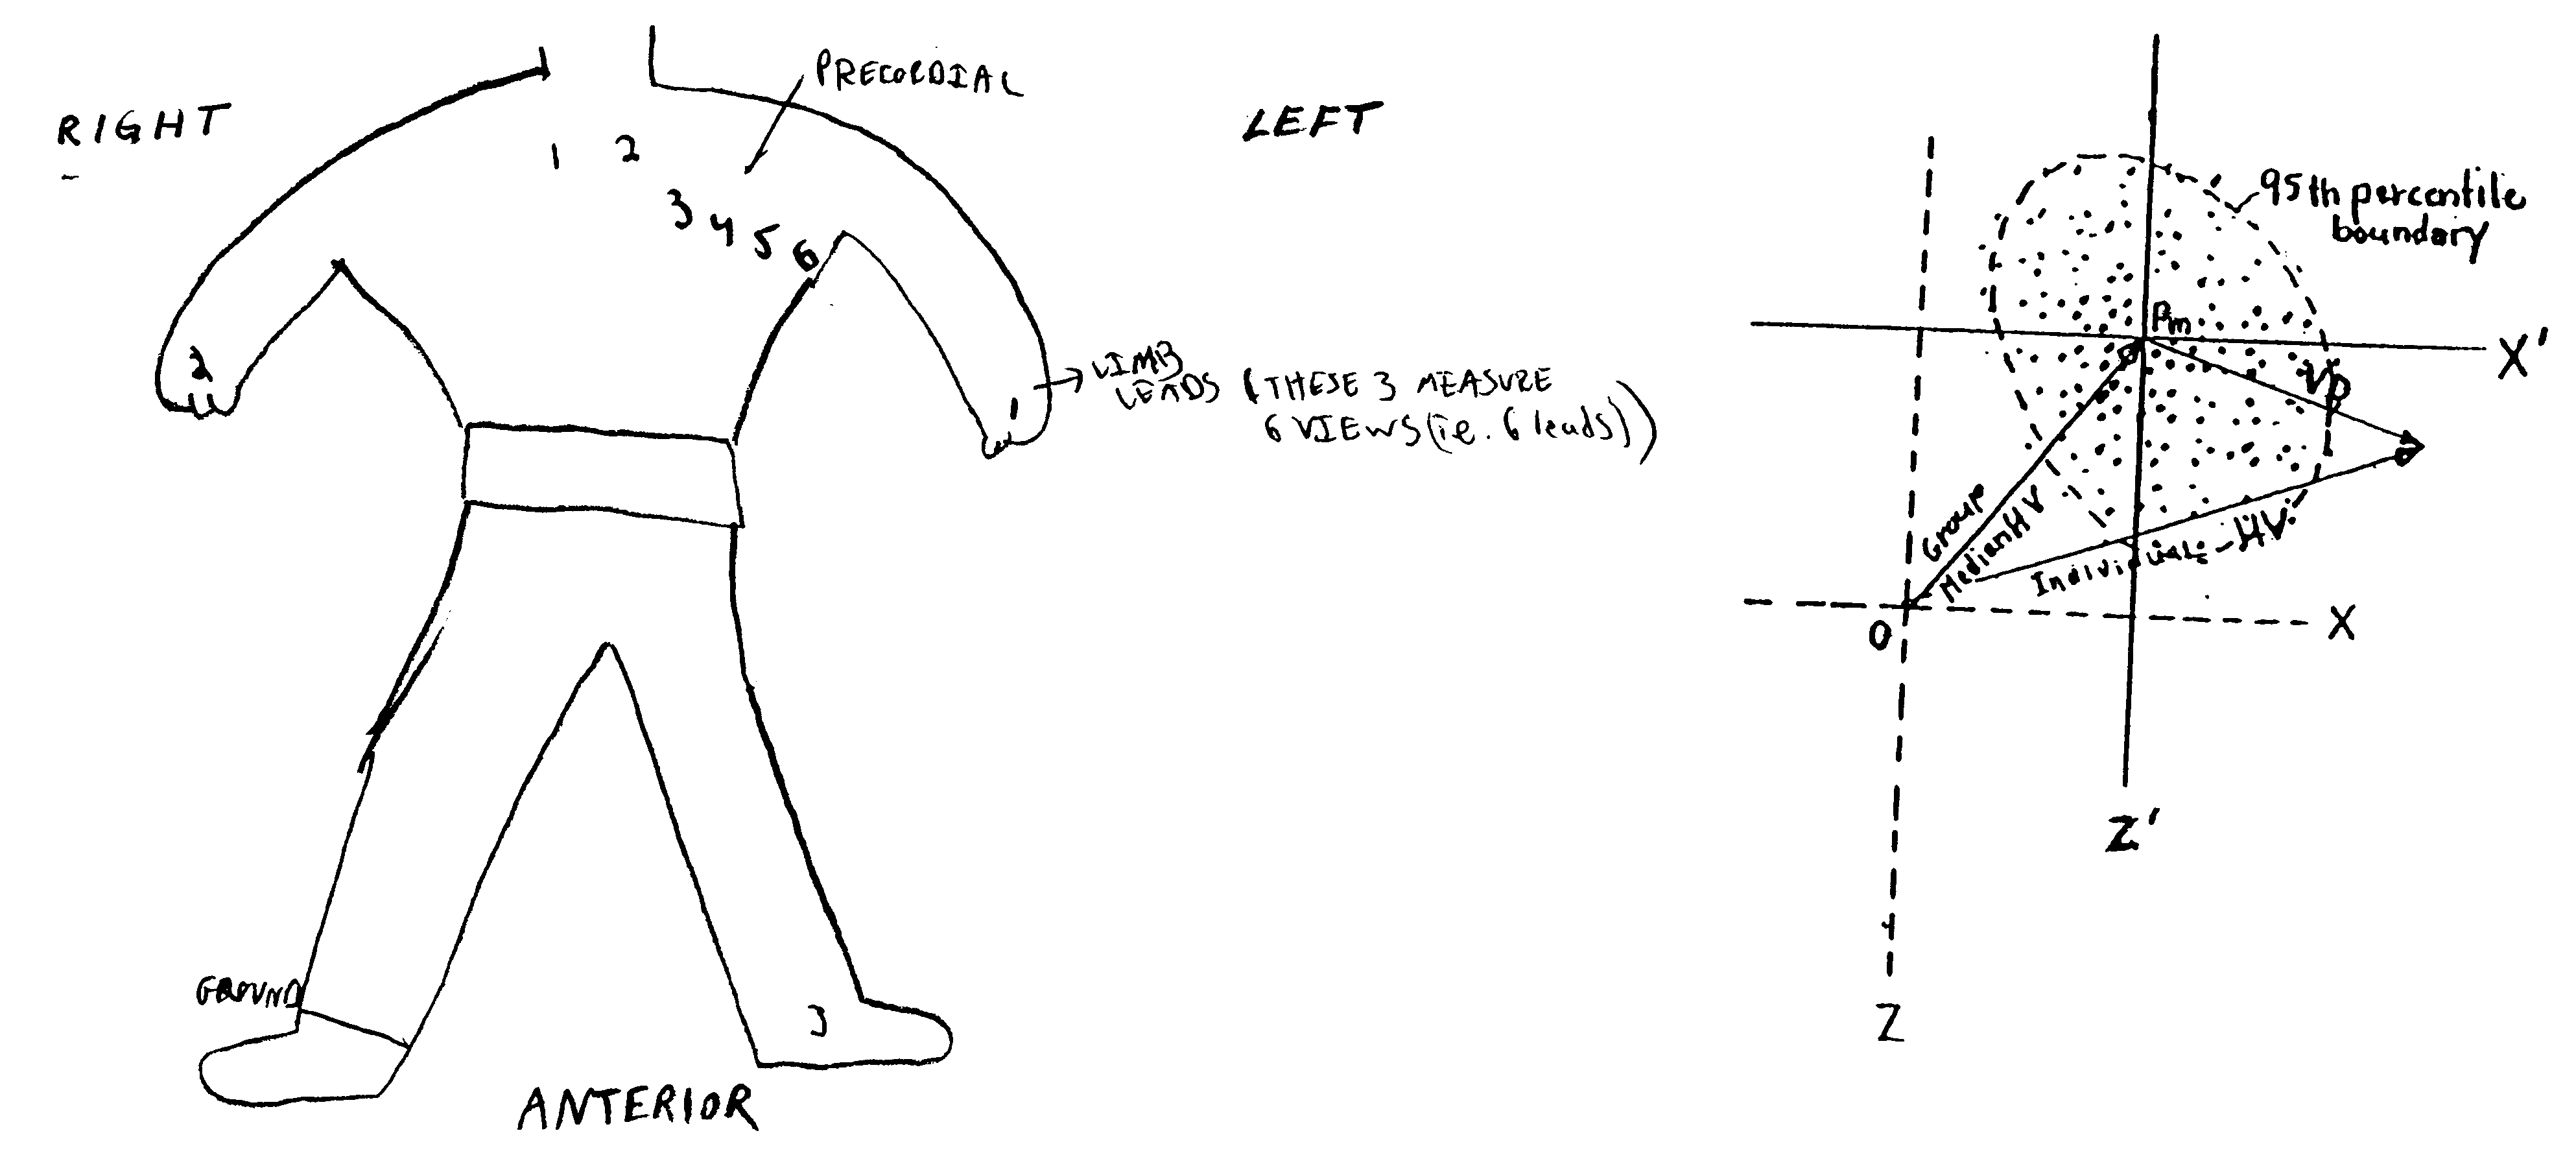
The following input data is given: Patient name, patient number, patient age (which in the example is a 48 year old male) and the patient history (which in this case includes hypertension). In the analysis of the QRS portion of his DHV, the 40 msec. time point of his heart (H in mvolts) is (+1.83, +0.37, +0.81). From the stored data on normals, the group median vector for males 45 to 54 years of age is (+1.07, +0.65, +0.11).

To derive the vector of deviation, D, subtract M from H. The patient's D is (+0.76, -0.28, +0.70). The relation of H, M, and D is shown in FIG. 8 in the frontal plane projection. Translate D to axes X', Y', Z', whose origin is the spatial median center of normal distribution. The coordinates are the same by the Law of Parallelograms.

In the next step, rotate the axes so that the X' axis coincides with D. The coordinates of vector head D become (s, 0, 0, or +1.07, 0, 0) by definition. The position of D within the spatial cluster of normal vectors is shown in the fr...


PUM


Abstract

A method of analyzing the electrocardiogram ("ECG") using a set of vectors mathematically derived from the heart vector. The entire ECG waveform of one representative heartbeat is analyzed as a time series of vectors taken at selected time intervals. The vector set consists of the heart vector, the vector of deviation, vector of abnormality, delta vector, the delta vector deviation, and the delta vector abnormality. The analysis system can be applied to two or any greater number of ECG leads represented on planar axes, orthogonal spatial axes, or four or more axes in multidimensional space. The normal range of the ECG in this method is delineated by an adaptive multi-dimensional polyhedron in space to which the unknown ECG is compared. This is accomplished by utilizing a computer platform and the software program to support the required mathematical calculations.

Description

The electrocardiogram (ECG) presently is analyzed by several different methods. The measurement of the scalar representation of single leads is most common as seen in FIG. 1. The duration and voltage amplitudes of designated deflections, Q, R, S, etc., are measured. Combinations of abnormalities, which are measurements that exceed normal ranges found in selected leads, indicate an abnormality of the myocardium. For example, Q waves of 0.04" duration in leads II, III, and AVF is interpreted as inferior myocardial infarction.Most commonly the standard 12-lead ECG is analyzed in this way. This system of leads consists of 6 limb leads and 6 leads recorded from the precordial area of the chest as positioned in FIG. 2. These leads measure a voltage difference between a positive and a negative electrode or combinations of electrodes. A positive deflection is recorded when an electrical impulse is coming towards the lead and a negative deflection with the impulse going away from the lead. W...

Claims


Application Information

Patent Timeline
Patent Type & Authority Patents(United States)
IPC IPC(8): A61B5/04
CPCA61B5/04011A61B5/341
Inventor TOOLE, J. GERALD
Owner TOOLE J GERALD
Why Eureka
Try Eureka