Multiple chart user interface

a multi-chart and user-friendly technology, applied in the field of multi-chart user-friendly interfaces, can solve the problems of not being able to compare different data scenarios in conventional charting dduis

Inactive Publication Date: 2005-06-14
MICROSOFT TECH LICENSING LLC
View PDF15 Cites 167 Cited by
  • Summary
  • Abstract
  • Description
  • Claims
  • Application Information

AI Technical Summary

Benefits of technology

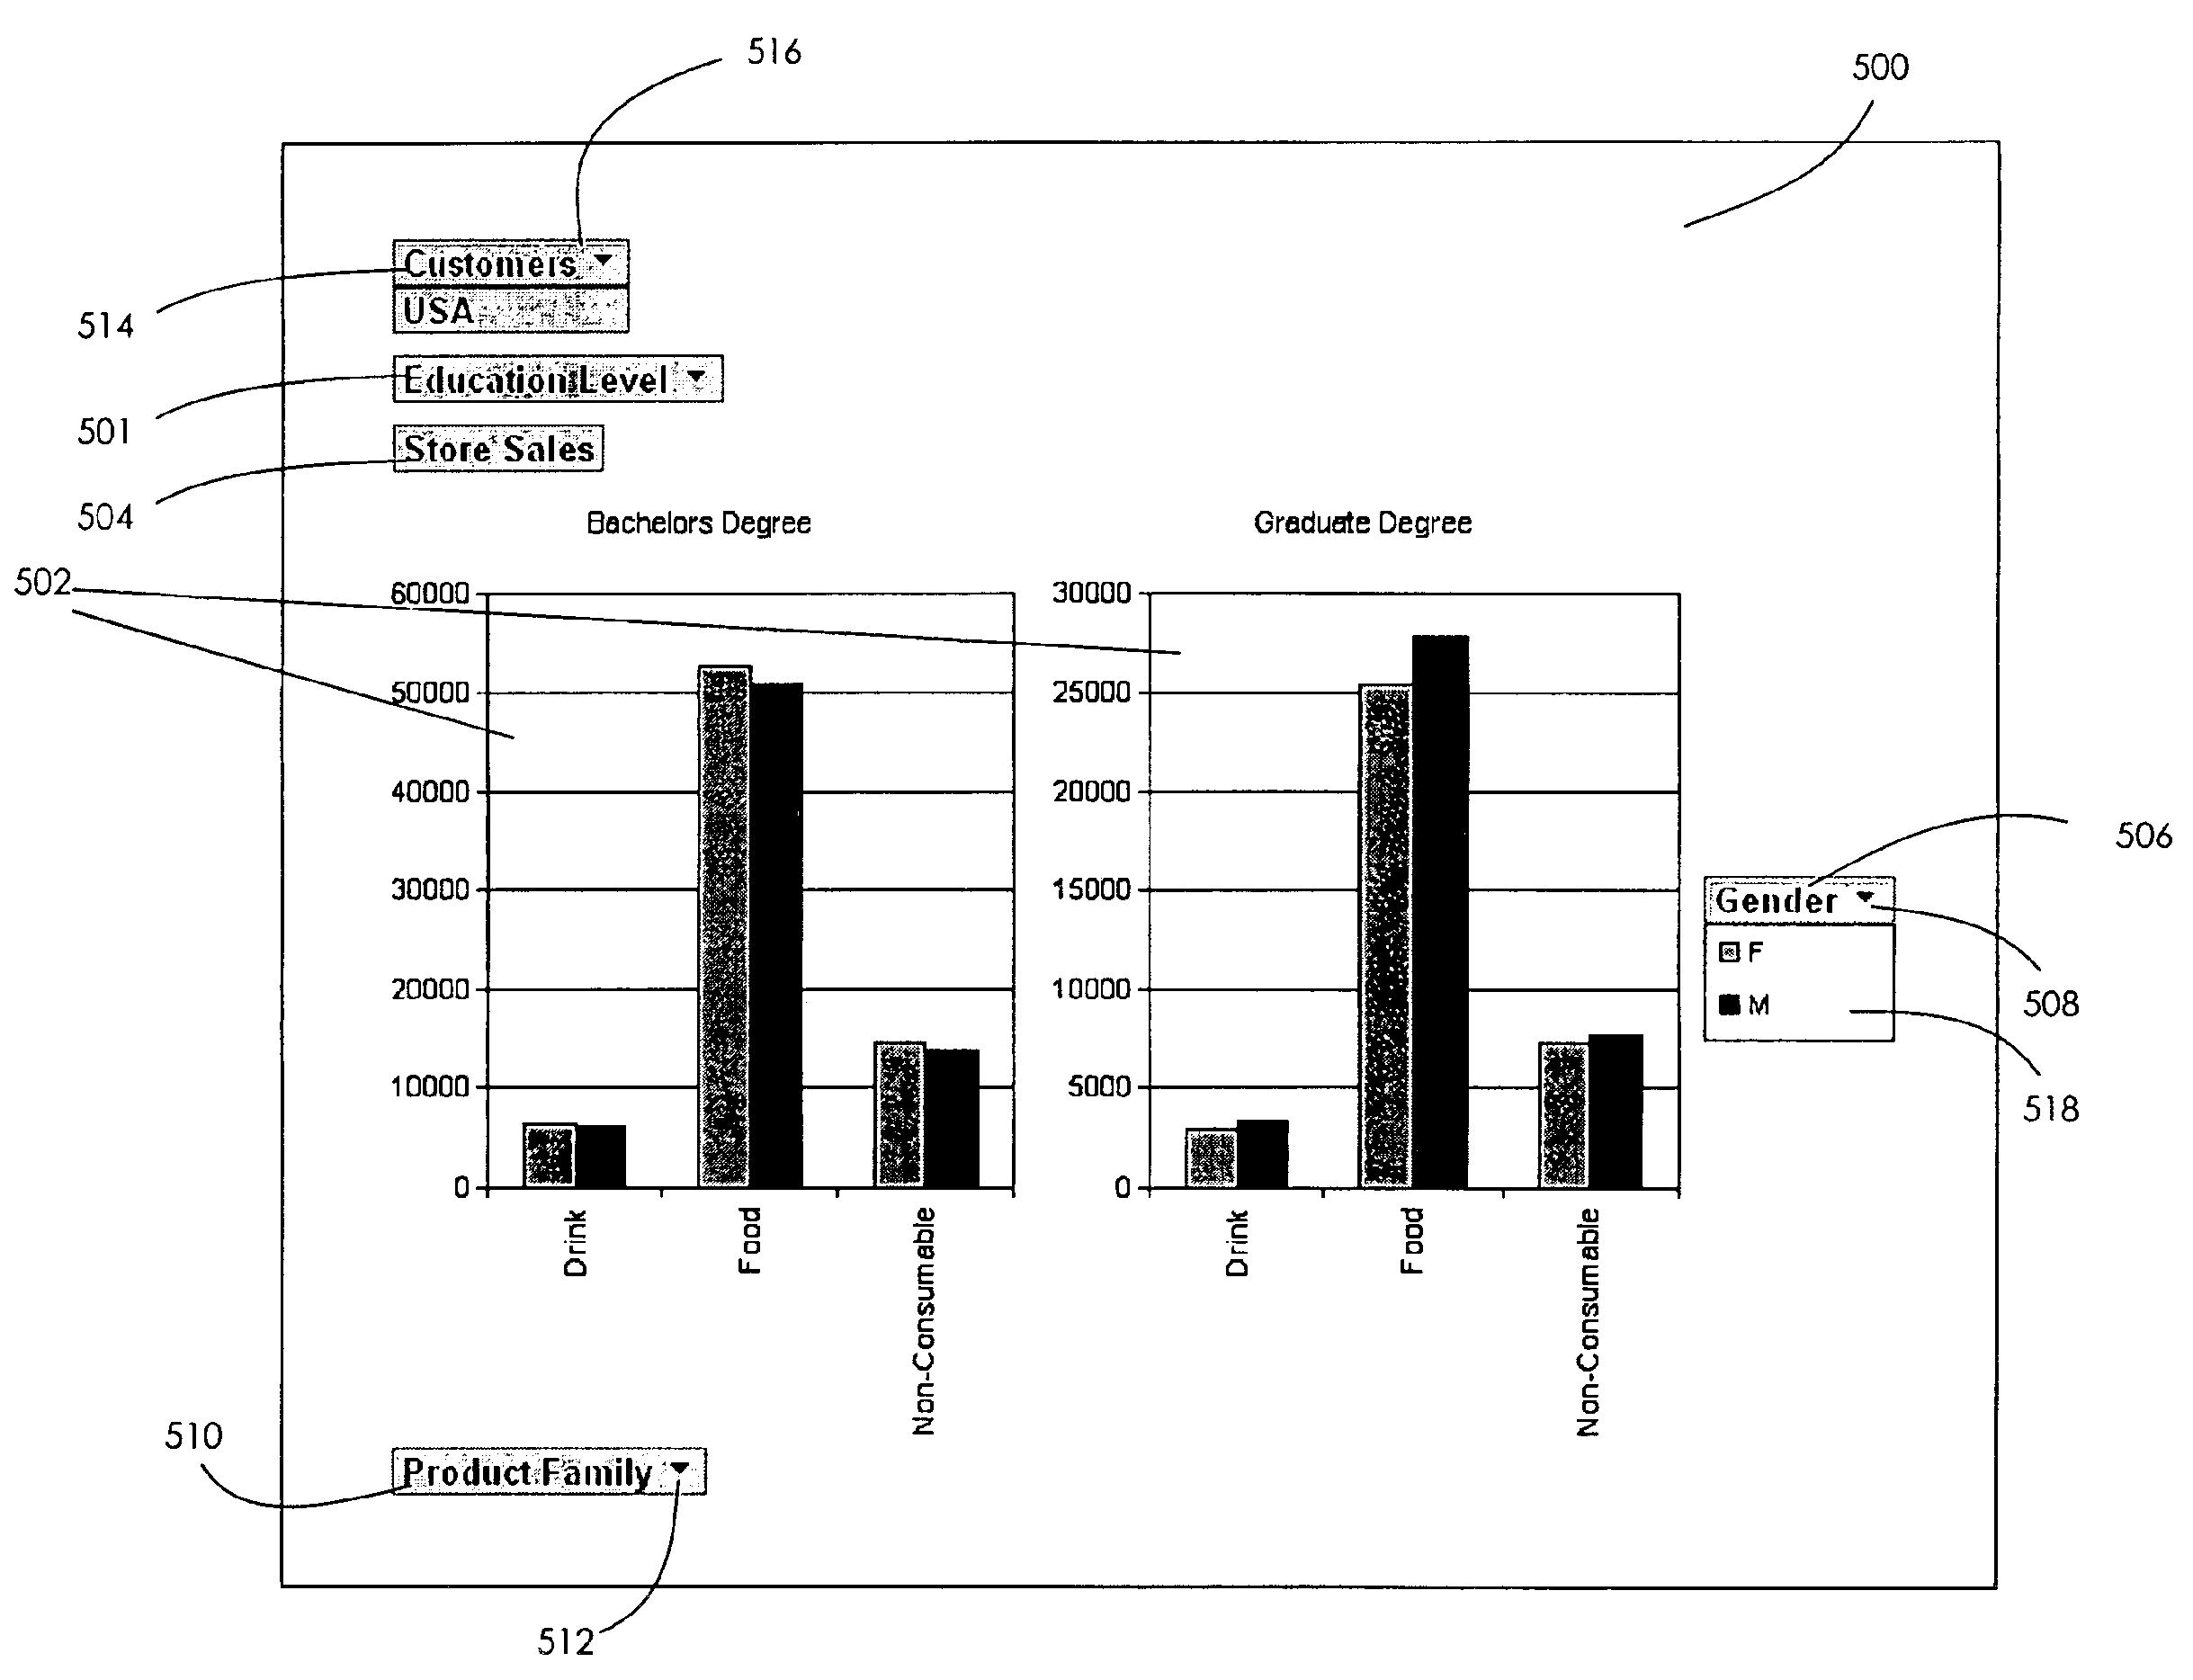
[0007]The present invention meets the above-described needs by providing a charting DDUI that can generate multiple charts simultaneously in an integrated display and supports the drag-and-drop method of adding fields.
[0009]A user can modify the number of generated charts by modifying the number of represented elements in the data field. A drop-down menu is provided next to the data field name (in the multiple data field drop zone). The drop-down menu permits the elimination or addition of unique entries in the data field that are represented in the multiple data field drop zone. For example, if the dropped data field contains three unique entries, dropping the data field into the multiple data field drop zone would generate three, separate charts. However, by eliminating one of the unique entries, one of the charts can be eliminated.

Problems solved by technology

Unfortunately, conventional charting DDUIs do not provide the ability to compare different data scenarios on the same screen.

Method used


Image

  • Multiple chart user interface
  • Multiple chart user interface
  • Multiple chart user interface

Examples


Embodiment Construction

[0021]In an exemplary embodiment of the present invention, a drag and-drop user interface (DDUI) is provided to generate multiple charts in an integrated chart report (i.e., all charts are simultaneously displayed) and to support the drag-and-drop method of adding data fields to the integrated chart report. A chart can be any visual or graphical representation of data. Typically, a data field is a group of data associated with a data source. Data values and characteristics can be represented as data fields in a field list. When a data field is dragged from a field list and dropped into a multiple data field drop zone, the DDUI of an exemplary embodiment can automatically generate additional charts to represent the data in the dropped data field. An additional chart will be generated for each unique entry in a data field. The number of charts can be modified by selecting particular elements in the dropped data field, by means of a drop-down menu. The drop-down menu permits the elimin...


PUM


Abstract

A drag-and-drop user interface (DDUI) can generate multiple charts in an integrated chart report and supports the drag-and-drop method of adding fields to the integrated chart report. When a field is dropped from a field list into a multiple chart drop zone, the DDUI will automatically generate additional charts to represent the data in the dropped field. An additional chart will be generated for each unique entry in a data field. The number of charts can be modified by selecting particular elements in the dropped field, by means of a drop-down menu. The drop-down menu enables the elimination or addition of elements of the dropped field. Each additional field dropped into the multiple chart drop zone will add a chart to the chart report. Conversely, each field dragged out of the multiple chart drop zone will eliminate a chart from the chart report. The DDUI can accommodate various chart types. The multiple chart drop zone can be slightly modified to accommodate the specialized needs of various chart types, for example, x-y, bubble, bar, and pie chart types.

Description

FIELD OF THE INVENTION[0001]The present invention generally relates to providing a graphical data analysis tool to computer users. More particularly, the present invention relates to a user interface capable of generating multiple chart reports in an integrated data analysis tool.BACKGROUND OF THE INVENTION[0002]Modem spreadsheet application programs generally provide sophisticated charting tools for graphically representing data. One such charting tool provides a drag-and-drop user interface (DDUI) that permits a user to populate a chart with data from a data source (e.g., a multi-dimensional database). The primary benefit of the charting DDUI is that the user can quickly change the data that is being presented in the chart. For example, a user can drag-and-drop an icon representing the data field containing the sales of widgets in Washington. The data in the data field will be used to populate the portion of the charting DDUI into which the data field icon was dropped. The user ma...

Claims


Application Information

Patent Timeline
Patent Type & Authority Patents(United States)
IPC IPC(8): G06F3/033G06F3/048
CPCG06T11/206G06F3/0486
Inventor COUCKUYT, JEFFDAVIES, PAULCAHILL, JASON M.
Owner MICROSOFT TECH LICENSING LLC
Why Eureka
Try Eureka