
Automated histogram characterization of data sets for image visualization using alpha-histograms

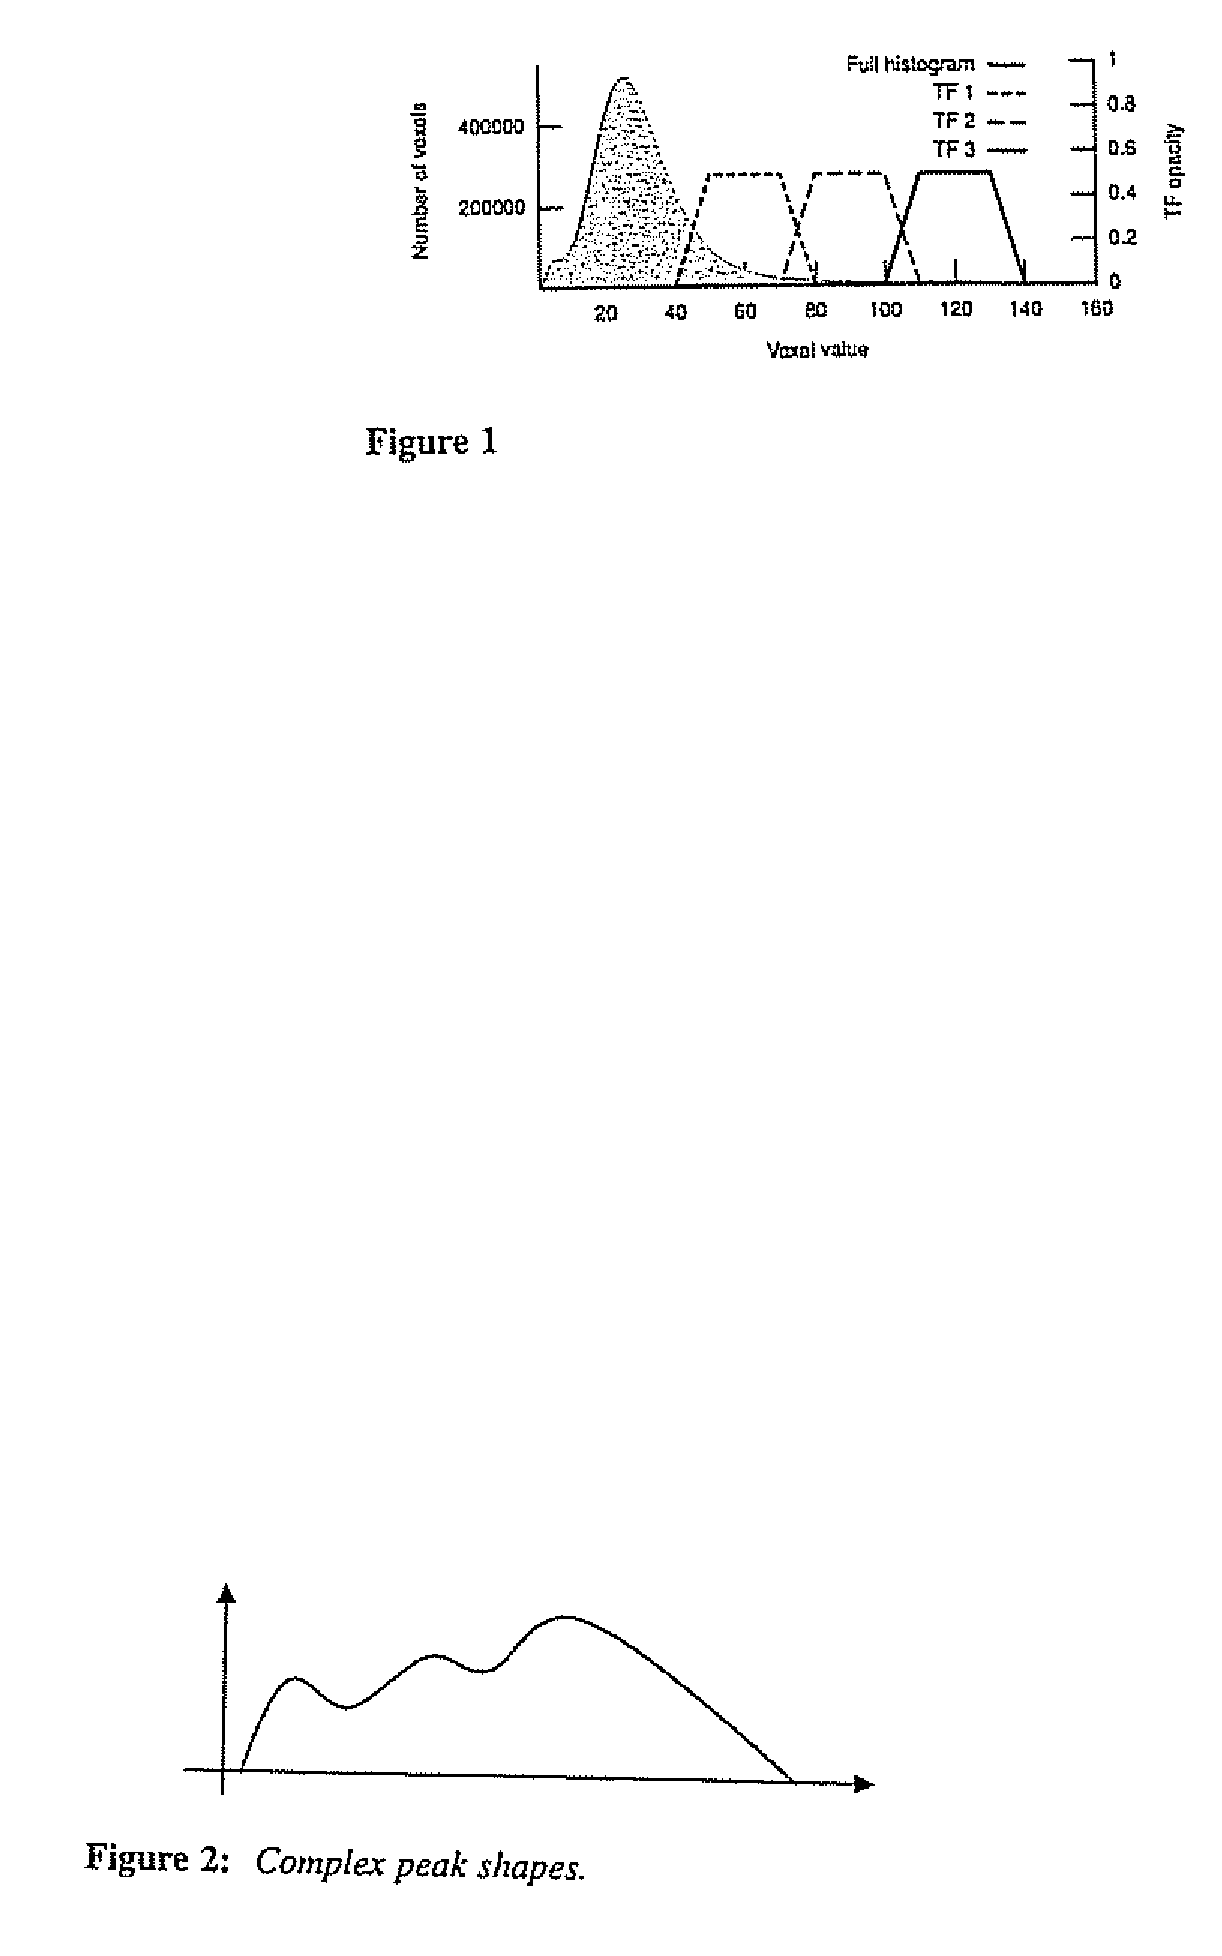
a technology of image visualization and histogram, applied in the field of histogram analysis, can solve the problems of time-consuming manual adjustment of dvr using conventional transfer functions, unable to achieve widespread use of dvr for non-research medical imaging, and difficulty in slice-by-slice viewing of medical data

Active Publication Date: 2010-02-09
SECTRA
View PDF2 Cites 14 Cited by
  • Summary
  • Abstract
  • Description
  • Claims
  • Application Information

AI Technical Summary

Problems solved by technology

Slice-by-slice viewing of medical data may be increasingly difficult for the large data sets now provided by imaging modalities raising issues of information and data overload and clinical feasibility with current radiology staffing levels.
Despite its potential, DVR has not achieved widespread use for non-research medical imaging, particularly in computer network systems with visualization pipelines.
This may be because DVR may need time-consuming manual adjustment using conventional transfer functions (TF) and / or editing tools.
That is, the TF construction can be relatively complex and / or the tissue separation abilities may not be sufficient, particularly where dissimilar tissues have similar intensity values limiting the ability to generate diagnostic clinical renderings.

Method used


Image

  • Automated histogram characterization of data sets for image visualization using alpha-histograms
  • Automated histogram characterization of data sets for image visualization using alpha-histograms
  • Automated histogram characterization of data sets for image visualization using alpha-histograms

Examples


examples

[0133]The test results are divided into two parts. First, synthetic data sets are used to explore the properties of the α-histogram and its variations. These experiences are then applied to a clinical TF adaptation problem, in which tissue detection is a key component. The results concern a standard α-histogram based on 83 blocks, unless stated otherwise.

Synthetic Data Sets

[0134]Tests have been performed on two synthetic data sets with controllable characteristics. As shown in FIGS. 10A and 10J, the first data set is a tube spiraling around a torus, intended to imitate a vessel, designed not to coincide with a Cartesian block structure. Since a block subdivision is performed in the standard α-histogram, the spiral shape is designed not to be aligned with any Cartesian grid. The radius, ρ, sets the width of the “vessel”. The distributions of voxel values have been chosen to mimic real angiography data sets. The vessel has a Gaussian distribution (μ=100, σ=20). The background has a Ga...


PUM


Abstract

Methods and apparatus are configured to provide data to generate and / or render (medical) images using medical volumetric data sets by electronically analyzing a medical volume data set associated with a patient that is automatically electronically divided into a plurality of local histograms having intensity value ranges associated therewith and programmatically generating at least one α-histogram of data from the local histograms used for at least one of peak detection, transfer function design or adaptation, tissue detection or tissue classification.

Description

FIELD OF THE INVENTION[0001]The present invention relates to histogram analysis and may be particularly suitable for transfer function selection or design and medical renderings of imaging data.RESERVATION OF COPYRIGHT[0002]A portion of the disclosure of this patent document contains material to which a claim of copyright protection is made. The copyright owner has no objection to the facsimile or reproduction by anyone of the patent document or the patent disclosure, as it appears in the Patent and Trademark Office patent file or records, but reserves all other rights whatsoever.BACKGROUND OF THE INVENTION[0003]Histograms are used to characterize data sets, for example in Transfer Function design, because of their relatively high information content in a relatively simple format. Some data sets have uncalibrated and / or non-spatially defined features and can include data associated with features of interest as well as minor features, noise and / or materials with overlapping value ran...

Claims


Application Information

Patent Timeline
Patent Type & Authority Patents(United States)
IPC IPC(8): G06K9/00
CPCG06K9/0053G06K9/4647G06T5/40G06T15/08G06T2207/10088G06T2207/10116G06T2207/30101G06V10/507G06F2218/10
Inventor LUNDSTROM, CLAESKNUTSSON, HANS
Owner SECTRA
Learn More