Method of determining inventory levels

a technology of inventory levels and methods, applied in the field of methods of determining inventory levels, can solve the problems of ineffective theory of ordering frequently demanded items, inability to determine when to order infrequently demanded items and in what quantities, and inability to meet customer demand, so as to reduce customer wait time without increasing inventory investment

Active Publication Date: 2012-04-24
LMI CONSULTING LLC
View PDF34 Cites 6 Cited by
  • Summary
  • Abstract
  • Description
  • Claims
  • Application Information

AI Technical Summary

Benefits of technology

[0017]It is one potential goal to provide an ordering policy for sporadic-demand items, with the goal of reducing customer wait-time without increasing inventory investment.

Problems solved by technology

Due to the sporadic demand, however, it is difficult to decide when to order the infrequently demanded items and in what quantities.
However, for items that are infrequently demanded, the theory used for ordering frequently demanded items breaks down and is not effective.
When there is sufficient demand data to characterize the lead-time demand distribution, but theoretical distributions do not fit well, non-parametric techniques, such as the bootstrap method, may apply.
However, for sporadic-demand items—items that experience long and irregular periods of inactivity between demands (i.e., periods of inactivity from six months to several years)—lead-time demand is usually zero.
Forecasting lead-time demand and demand variance for these items is difficult.
As mean and variance cannot be estimated in a meaningful way, a theoretical demand probability distribution is impractical.
Use of empirical demand probabilities is possible, but for many sporadic-demand items, the data are too sparse to build a reasonable lead-time demand distribution.
However, the policies used fail to link inventory investment to service level, and generally do not work well.
However, for very irregular demand, these approaches have not been shown to improve service levels (e.g., reduce customer wait-time) without significantly increasing inventory investment.
A problem inherent in this approach is that the heuristic policy does not link inventory cost to service level.
Further, items may migrate over the course of the year between frequent-demand and sporadic-demand status, causing excessive ordering and changes in ROs.

Method used


Image

  • Method of determining inventory levels
  • Method of determining inventory levels
  • Method of determining inventory levels

Examples


second embodiment

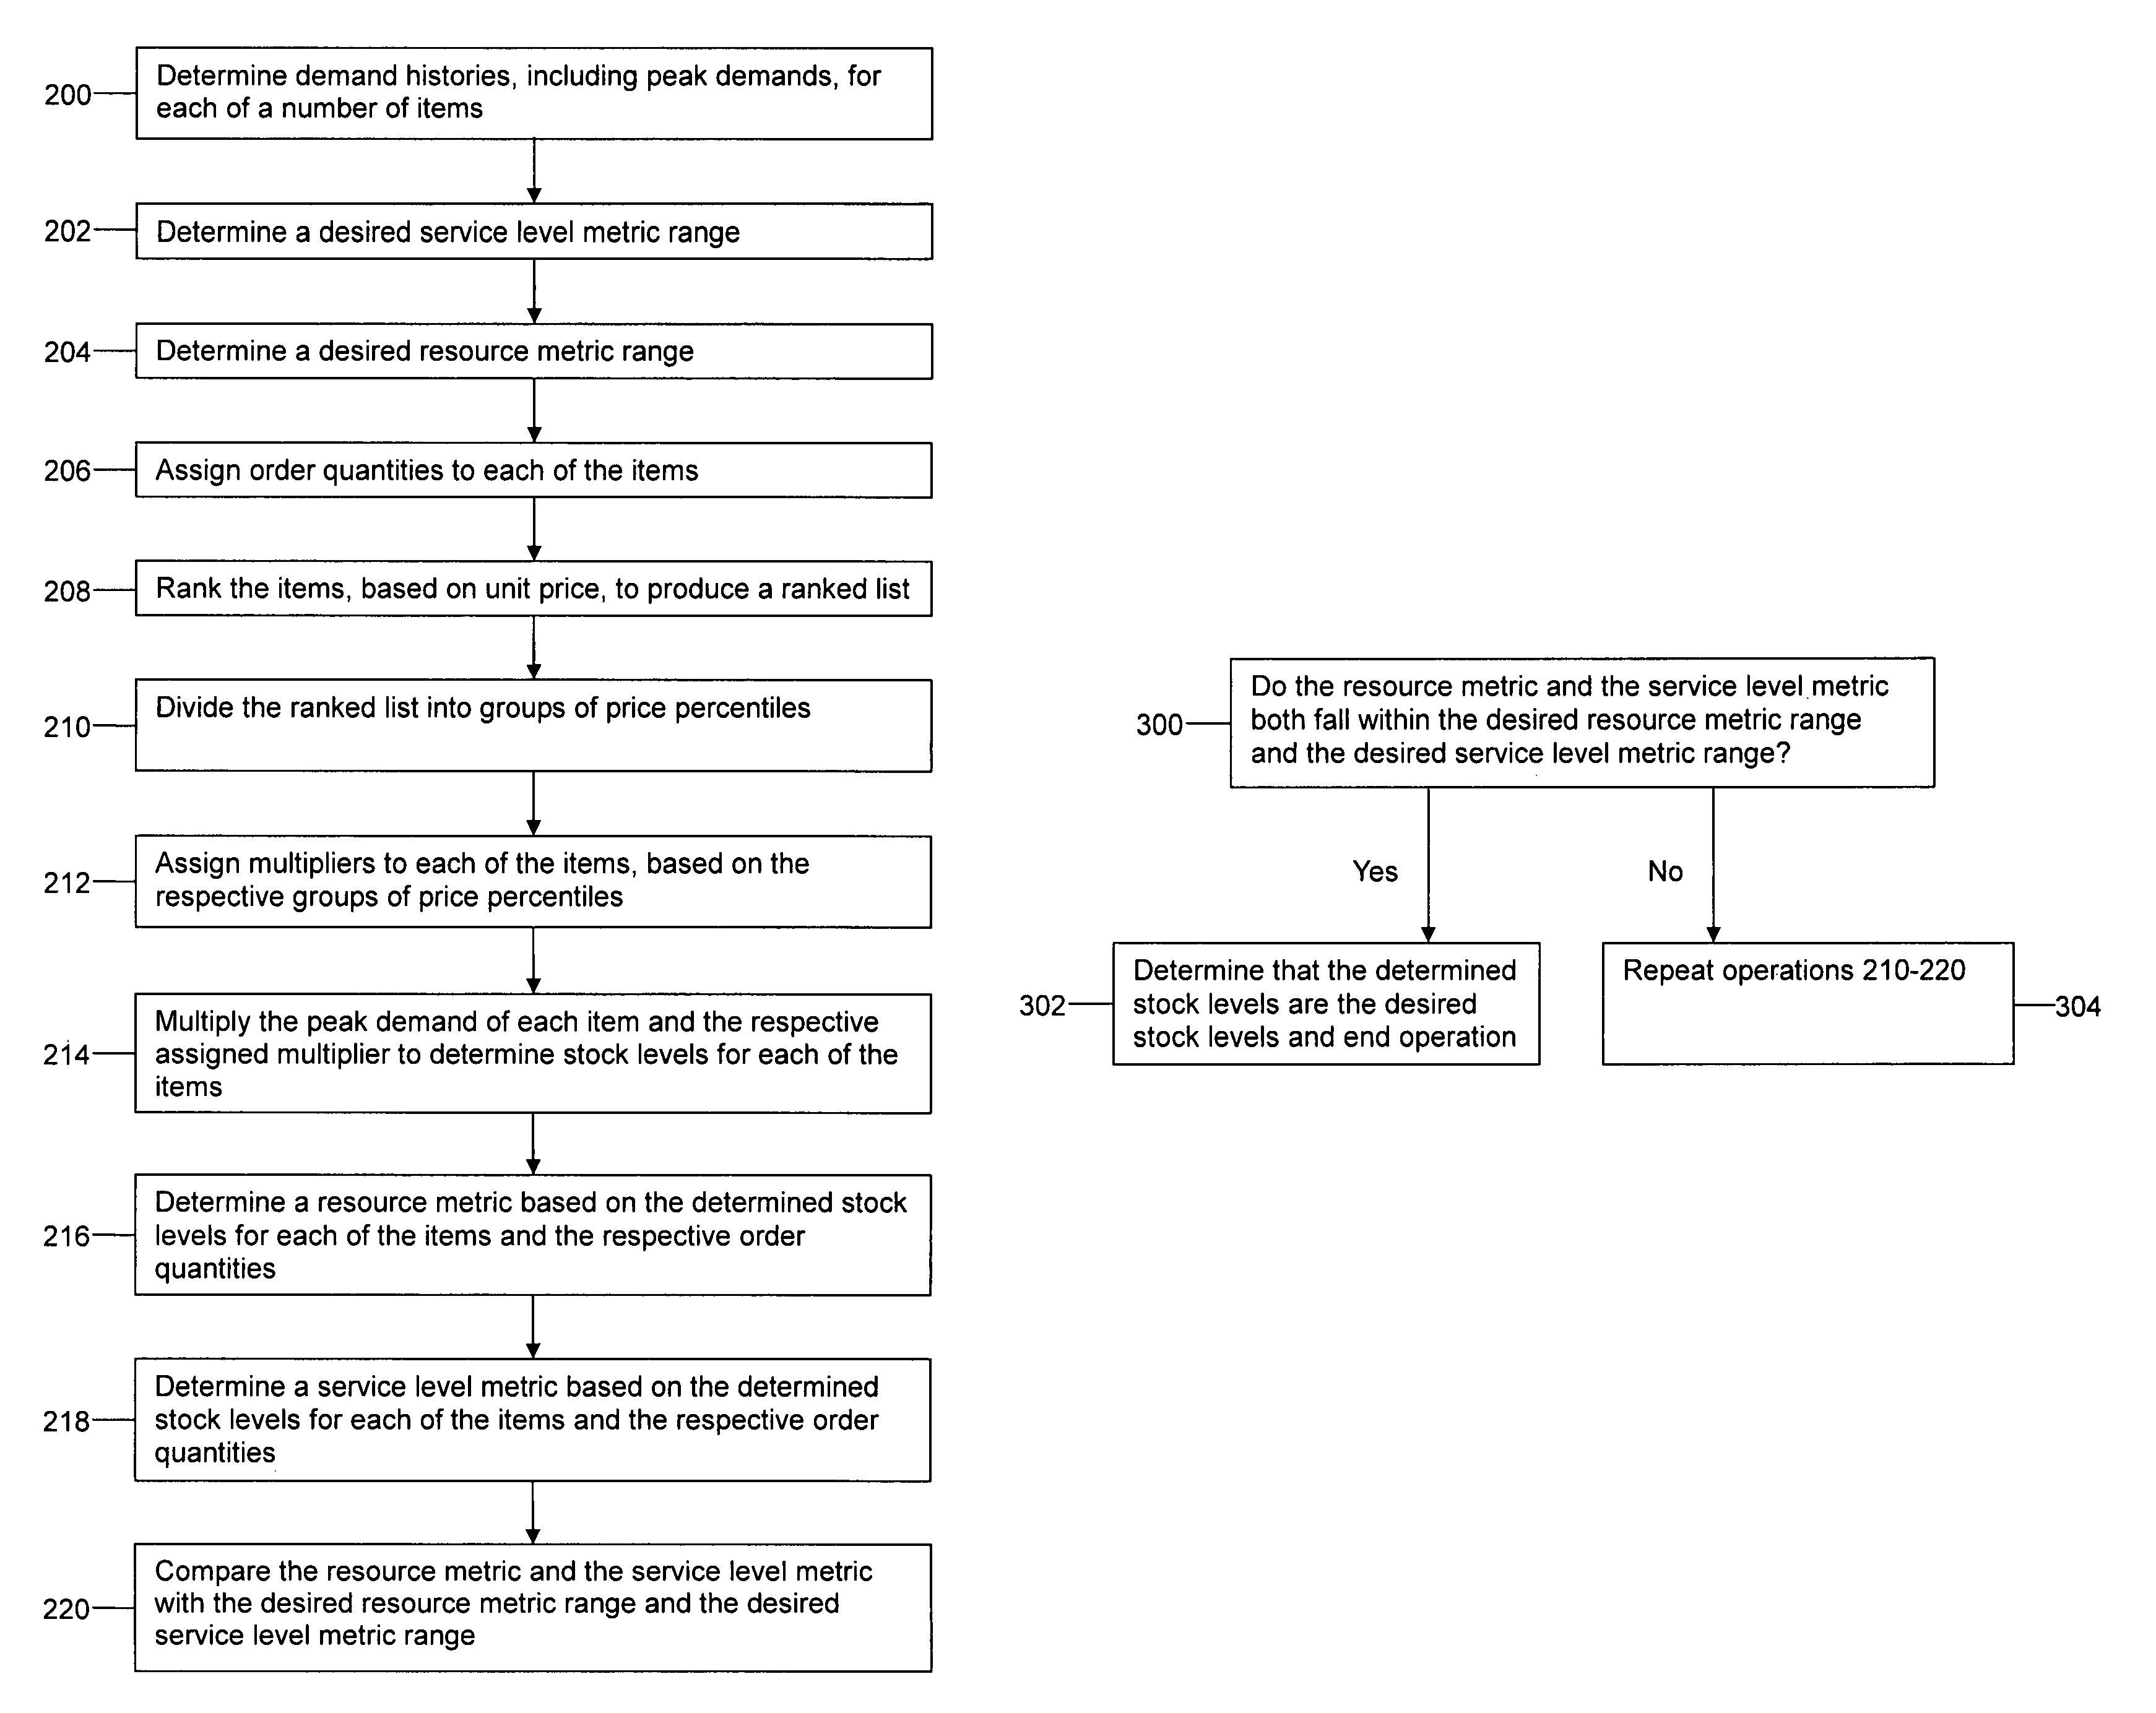
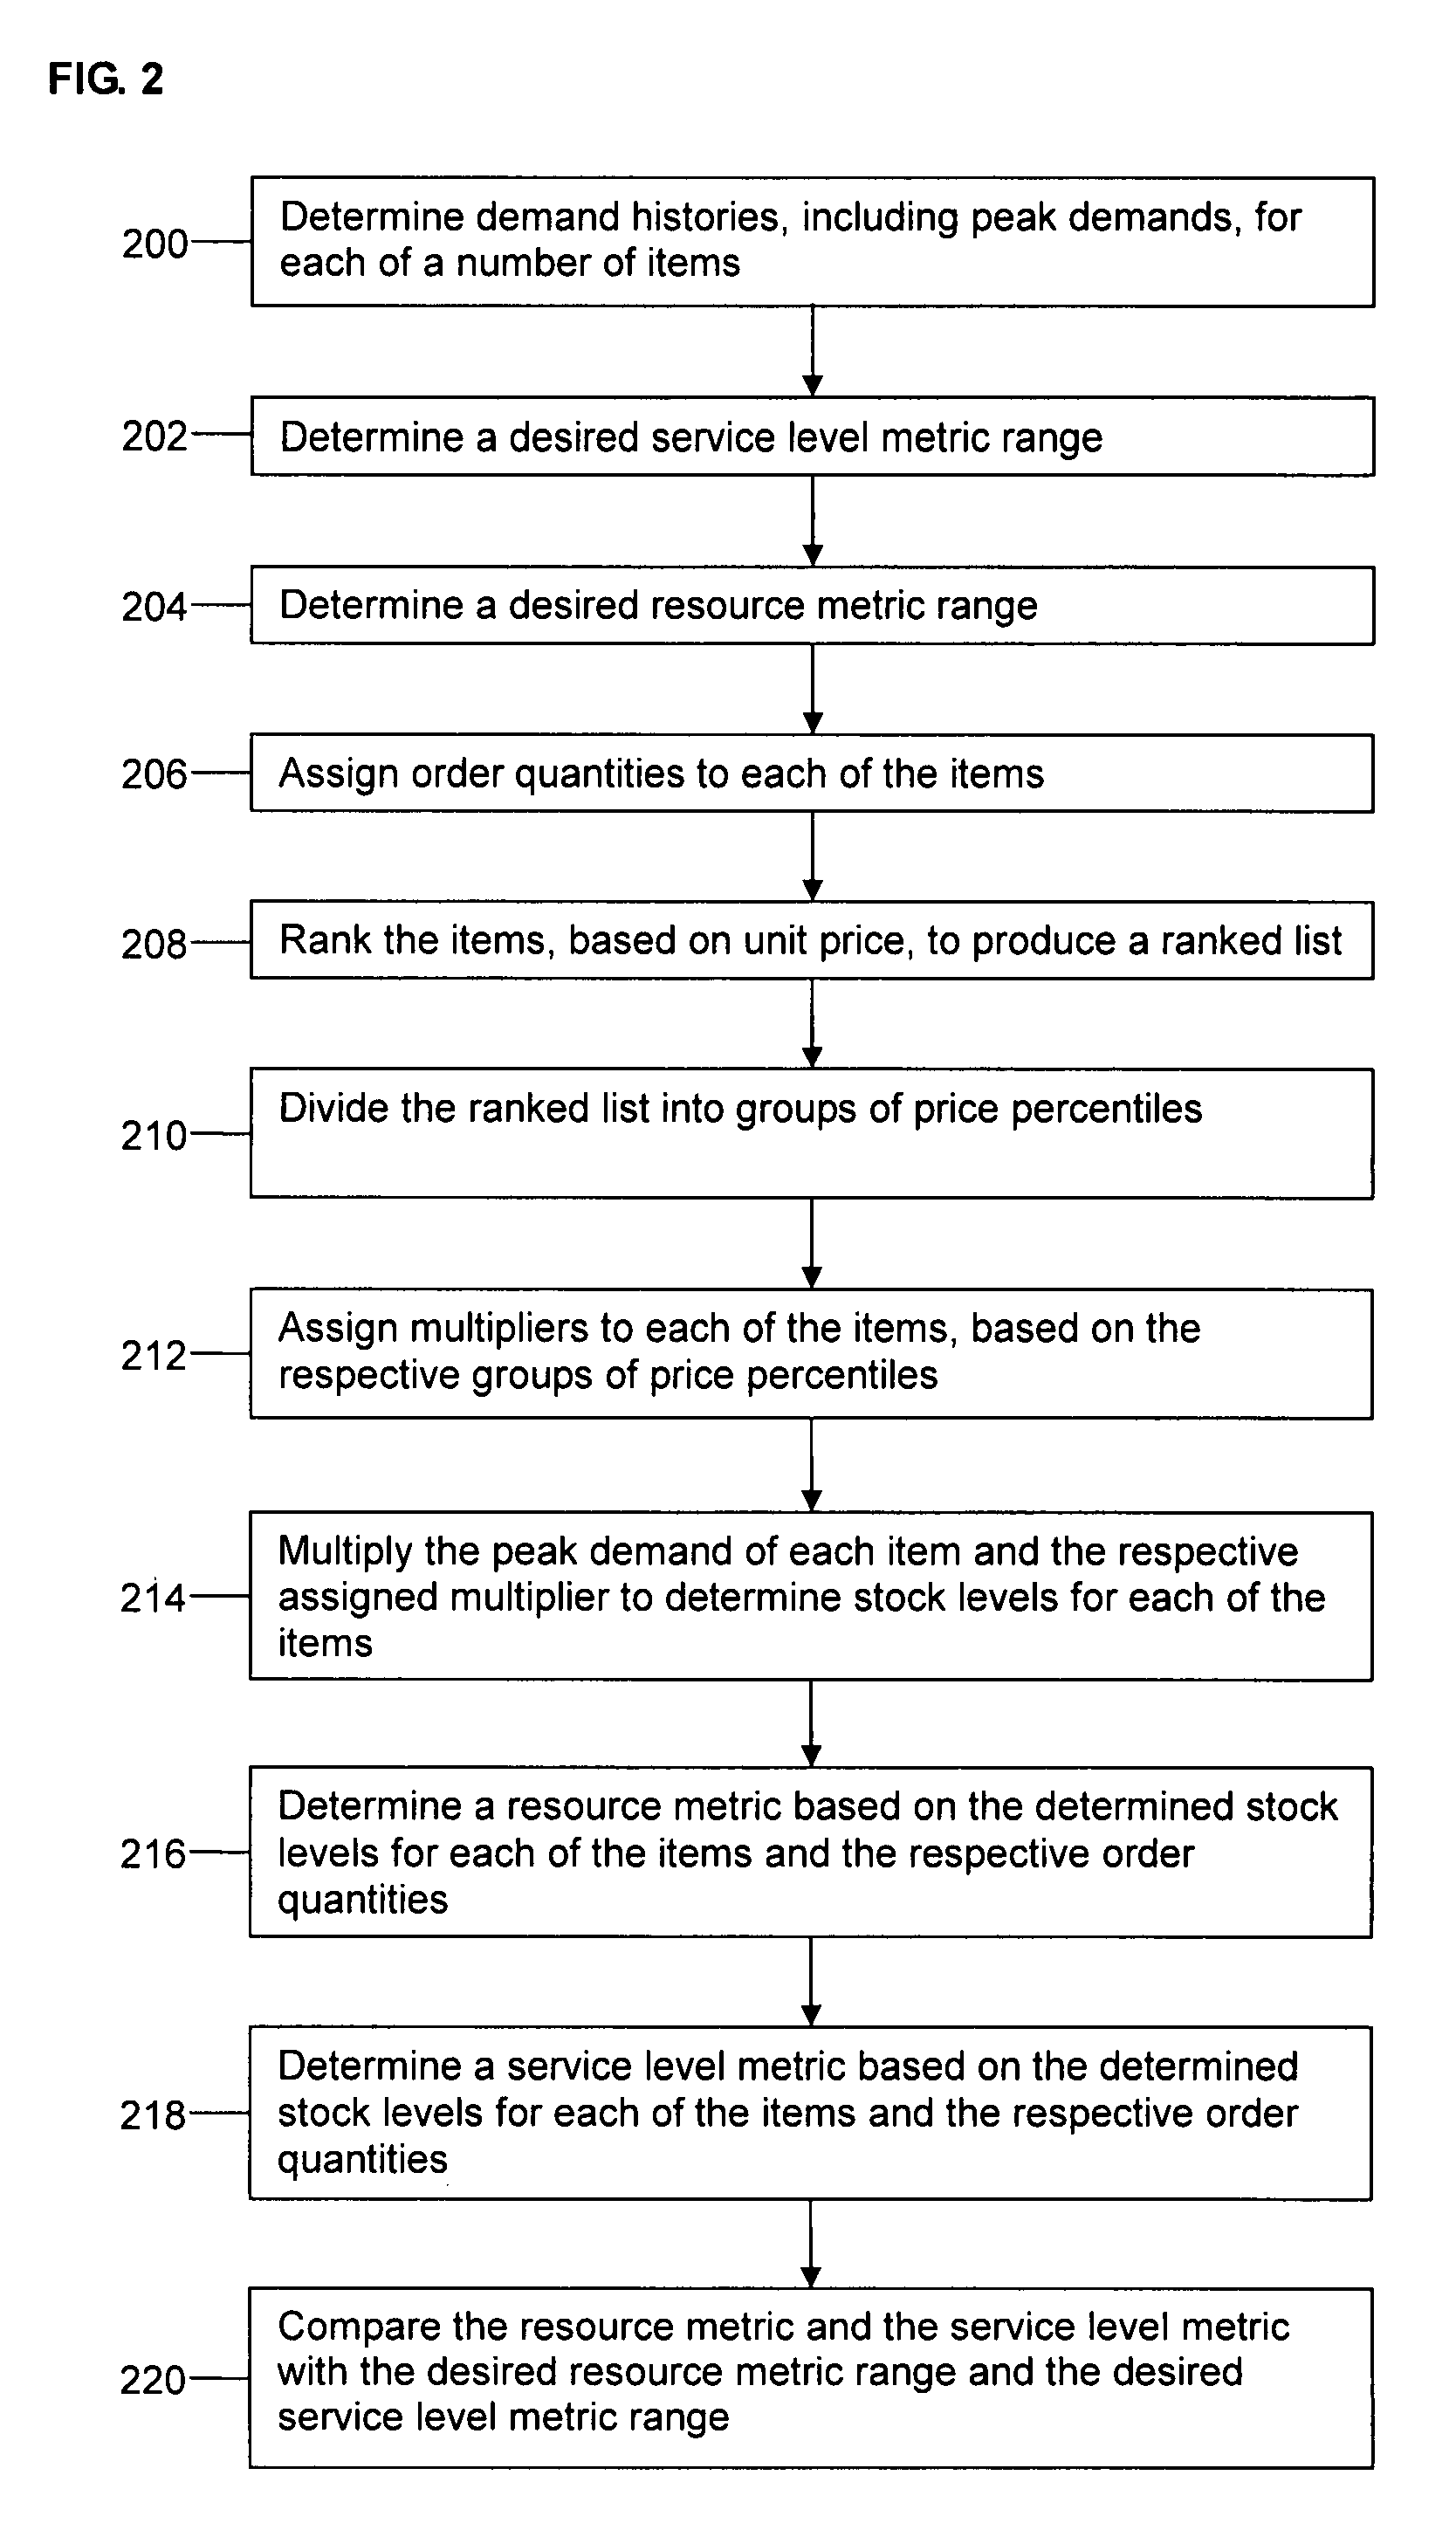
[0050]In a second embodiment, FIG. 4 shows a flowchart for determining desired order quantities. At operation 400, demand histories including peak demands are determined for each of a plurality of items. A desired replenishment workload metric range is determined at operation 402, and at operation 404, a desired resource workload metric range is determined. A desired service level range may additionally be determined at operation 406.

[0051]The items are ranked by unit price in operation 408 and the ranked list is divided into groups of price percentiles at operation 410, for example, a first set of groups of price percentiles and a second set of groups of price percentiles. The first set of groups of price percentiles may be, for example, 1st-26th, 26th-49th, 50th-100th, and 75th-100th percentiles, while the second set of groups of price percentiles may be, for example, 1st-33rd, 34th-66th and 67th-100th percentiles. At operation 412, multipliers are assigned to each of the items in...

first embodiment

[0059]At operation 600, a set of parameters is chosen to be used in creating a metrics curve. The set of parameters is generally chosen based on a parameter representing a source policy determined by using the method of the For example, if the source policy uses a parameter of 1.0, in order to create a curve extending in both directions from the source policy parameter, a set of parameters used will be parameters which are less than and greater than the source policy parameter of (i.e., 0.25, 0.50, 0.75, 1.0, 1.5, 2.0, 2.5 and 3.0). The parameters must vary enough so that there is sufficient variation in the values of the metrics to draw a full curve. FIG. 7 is a chart showing an example of a set of parameters and a set of peak multipliers for each of the parameters.

[0060]At operation 602, for each parameter in the set, the assigned multipliers are multiplied by the parameter to determine parameter-specific multipliers for each parameter. The peak demand of each item is then multip...


PUM


Abstract

A computer-readable medium executing a method of determining desired stock levels is provided. Demand histories, including peak demands, for each of a plurality of items are determined. The items are ranked, based on unit price, to produce a ranked list, which is divided into price percentiles. Multipliers are assigned to each of the items, based on the respective price percentiles, and stock levels are determined for each of the items by multiplying the peak demand of each item and the respective assigned multiplier. Order quantities are assigned to each of the items based on price percentiles. A service level metric and a resource metric are determined based on the stock levels and the respective order quantities, and the service level metric and resource metric are compared with a desired service level range and a desired resource metric range to determine whether the determined stock levels are the desired stock levels.

Description

CROSS-REFERENCE TO RELATED APPLICATION[0001]This application claims priority to U.S. Provisional Application No. 60 / 811,118 entitled Method for Determining Inventory Levels, by Bachman et al., filed Jun. 6, 2006 and incorporated herein by reference.GOVERNMENT RIGHTS[0002]This invention is a result of a collaborative effort between Logistics Management Institute and the Defense Logistics Agency. The U.S. Government has a paid up license in this invention.BACKGROUND[0003]1. Field[0004]The present invention relates generally to a method of determining inventory levels, and more particularly, to a method of determining inventory reorder levels and order-up-to levels.[0005]2. Description of the Related Art[0006]In inventory management, some items are demanded more frequently and some less frequently. For example, certain repair parts that apply to complex systems and are infrequently demanded must still be stocked because they are essential to maintaining that system. Due to the sporadic...

Claims


Application Information

Patent Timeline
Patent Type & Authority Patents(United States)
IPC IPC(8): G06Q30/00
CPCG06Q10/063G06Q10/06311G06Q10/06315G06Q10/06393G06Q10/087G06Q30/0201
Inventor BACHMAN, TOVEY C.DEZWARTE, CAROL A.
Owner LMI CONSULTING LLC
Why Eureka
Try Eureka