Method of determining inventory levels
a technology of inventory levels and methods, applied in the field of methods of determining inventory levels, can solve the problems of ineffective theory of ordering frequently demanded items, inability to determine when to order infrequently demanded items and in what quantities, and inability to meet customer demand, so as to reduce customer wait time without increasing inventory investment
- Summary
- Abstract
- Description
- Claims
- Application Information
AI Technical Summary
Benefits of technology
Problems solved by technology
Method used
Image
Examples
second embodiment
[0050]In a second embodiment, FIG. 4 shows a flowchart for determining desired order quantities. At operation 400, demand histories including peak demands are determined for each of a plurality of items. A desired replenishment workload metric range is determined at operation 402, and at operation 404, a desired resource workload metric range is determined. A desired service level range may additionally be determined at operation 406.
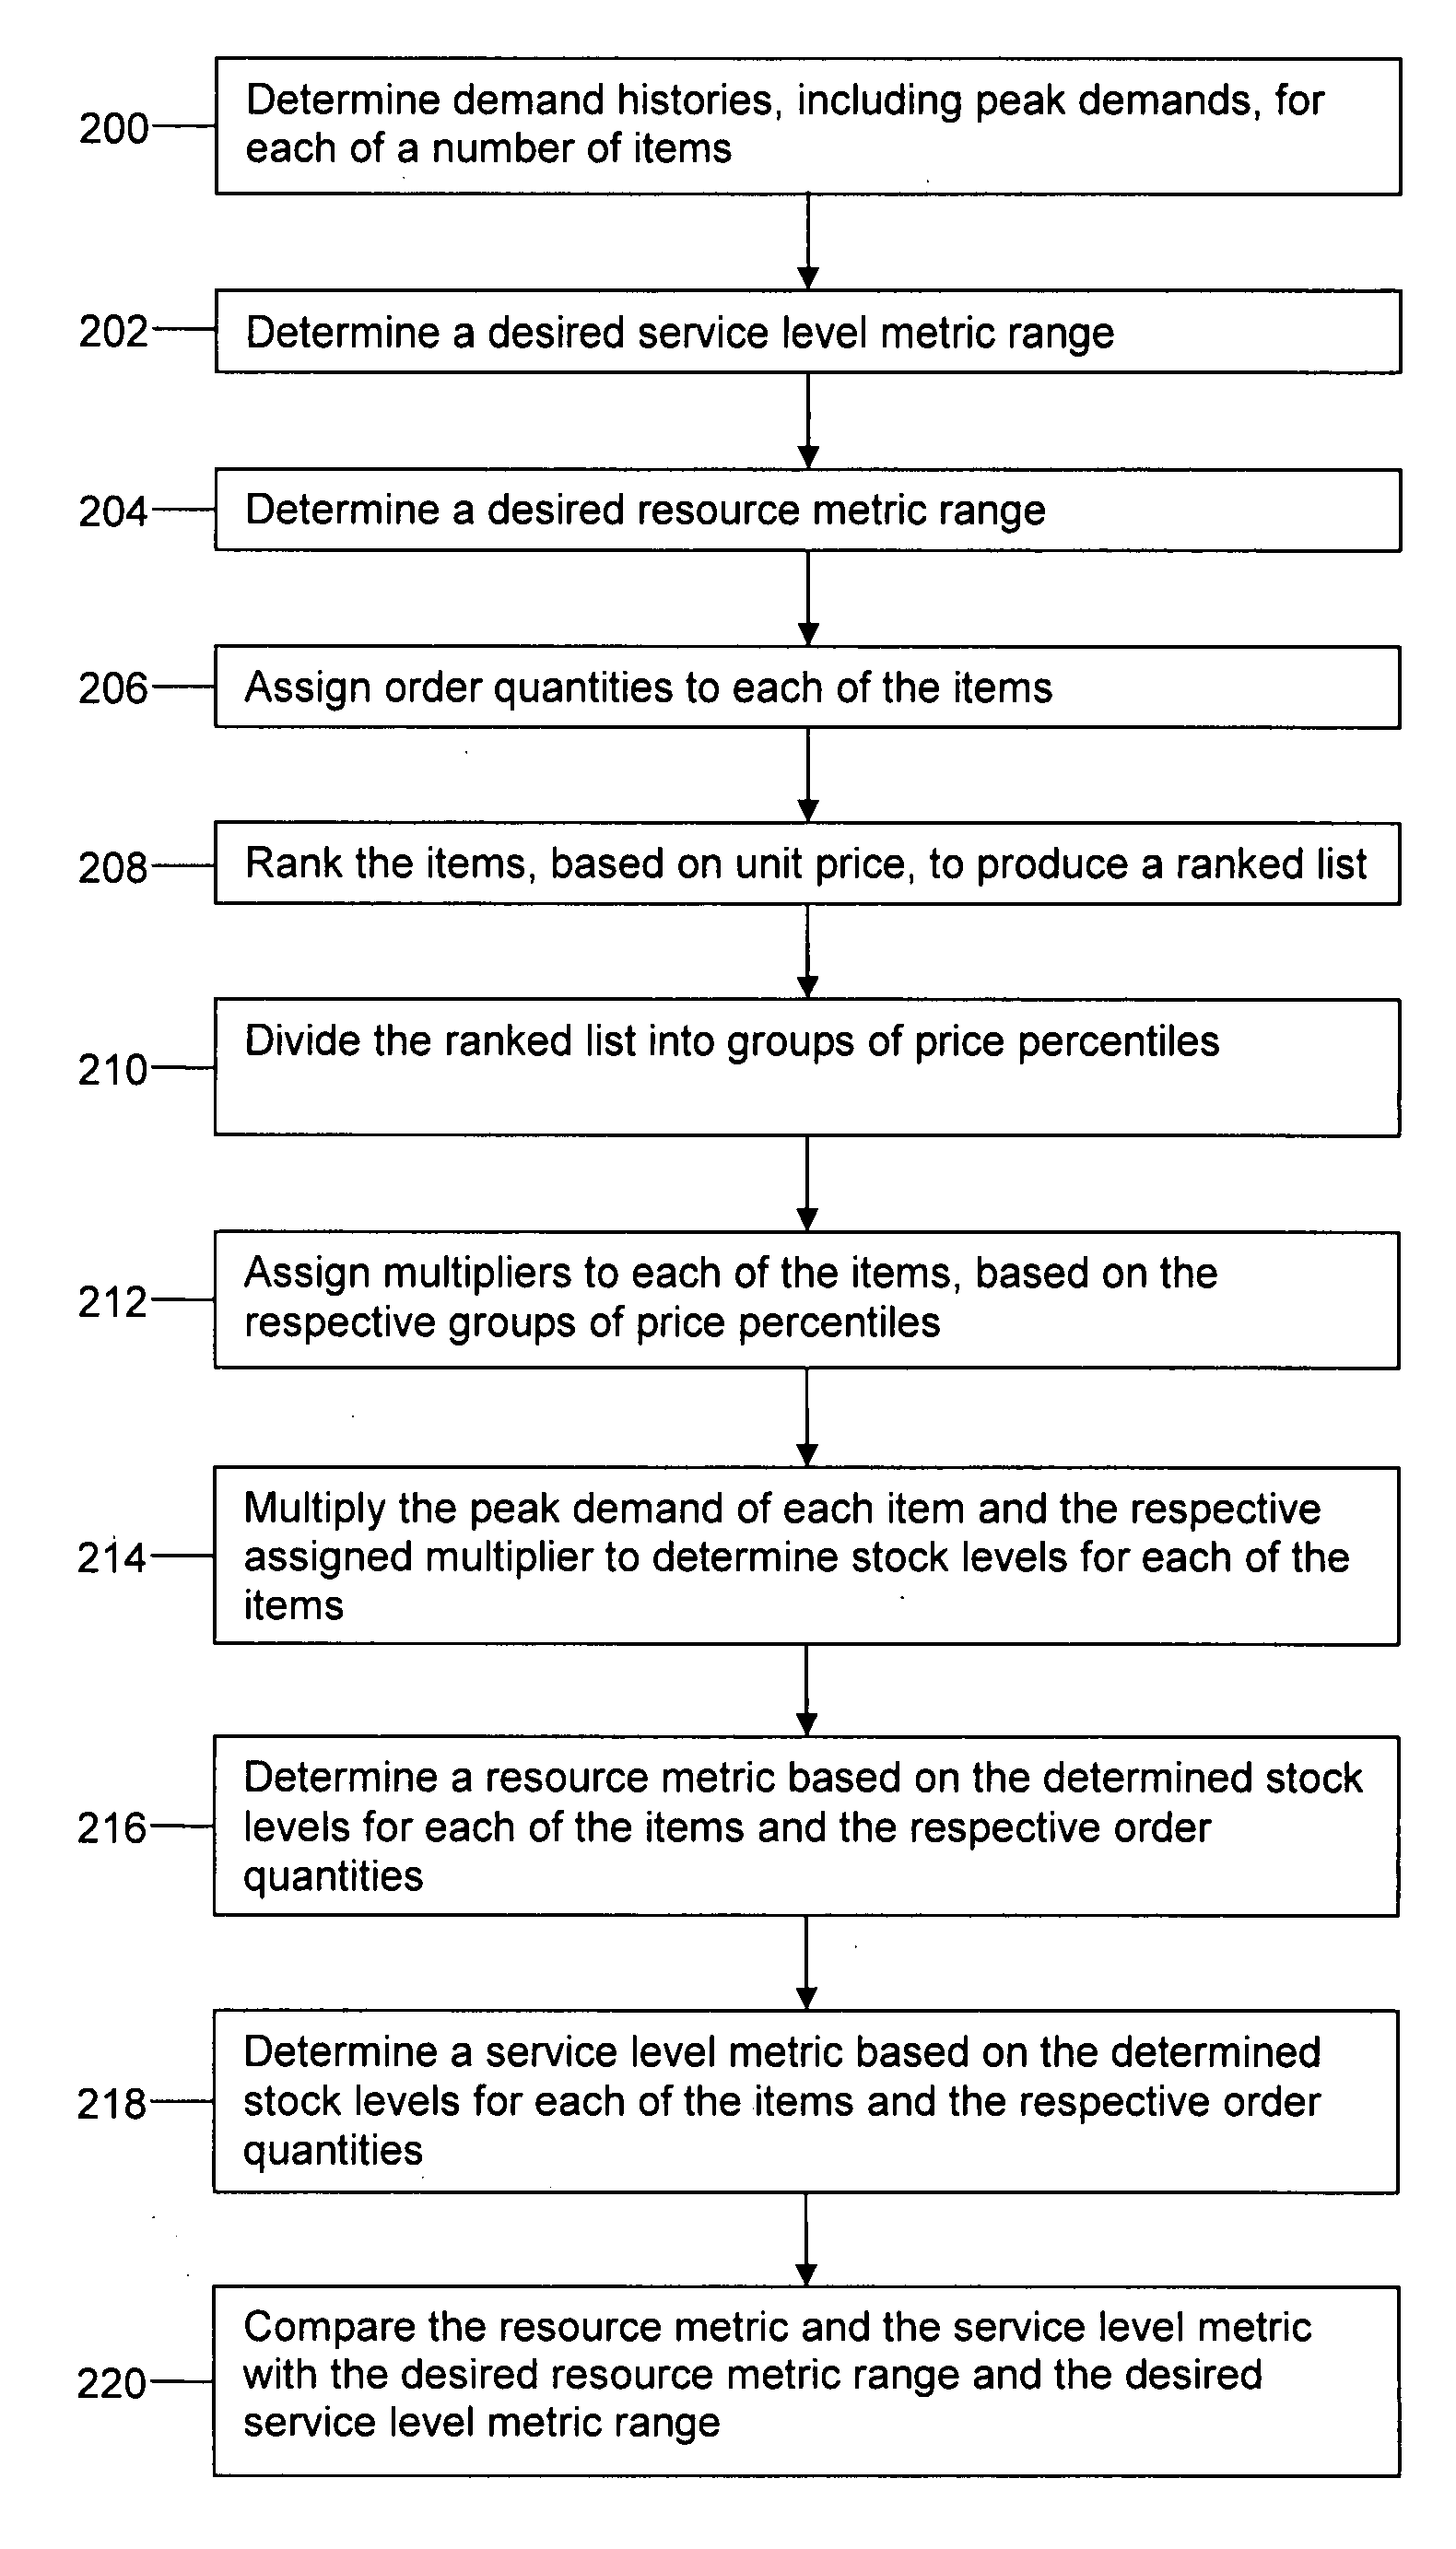
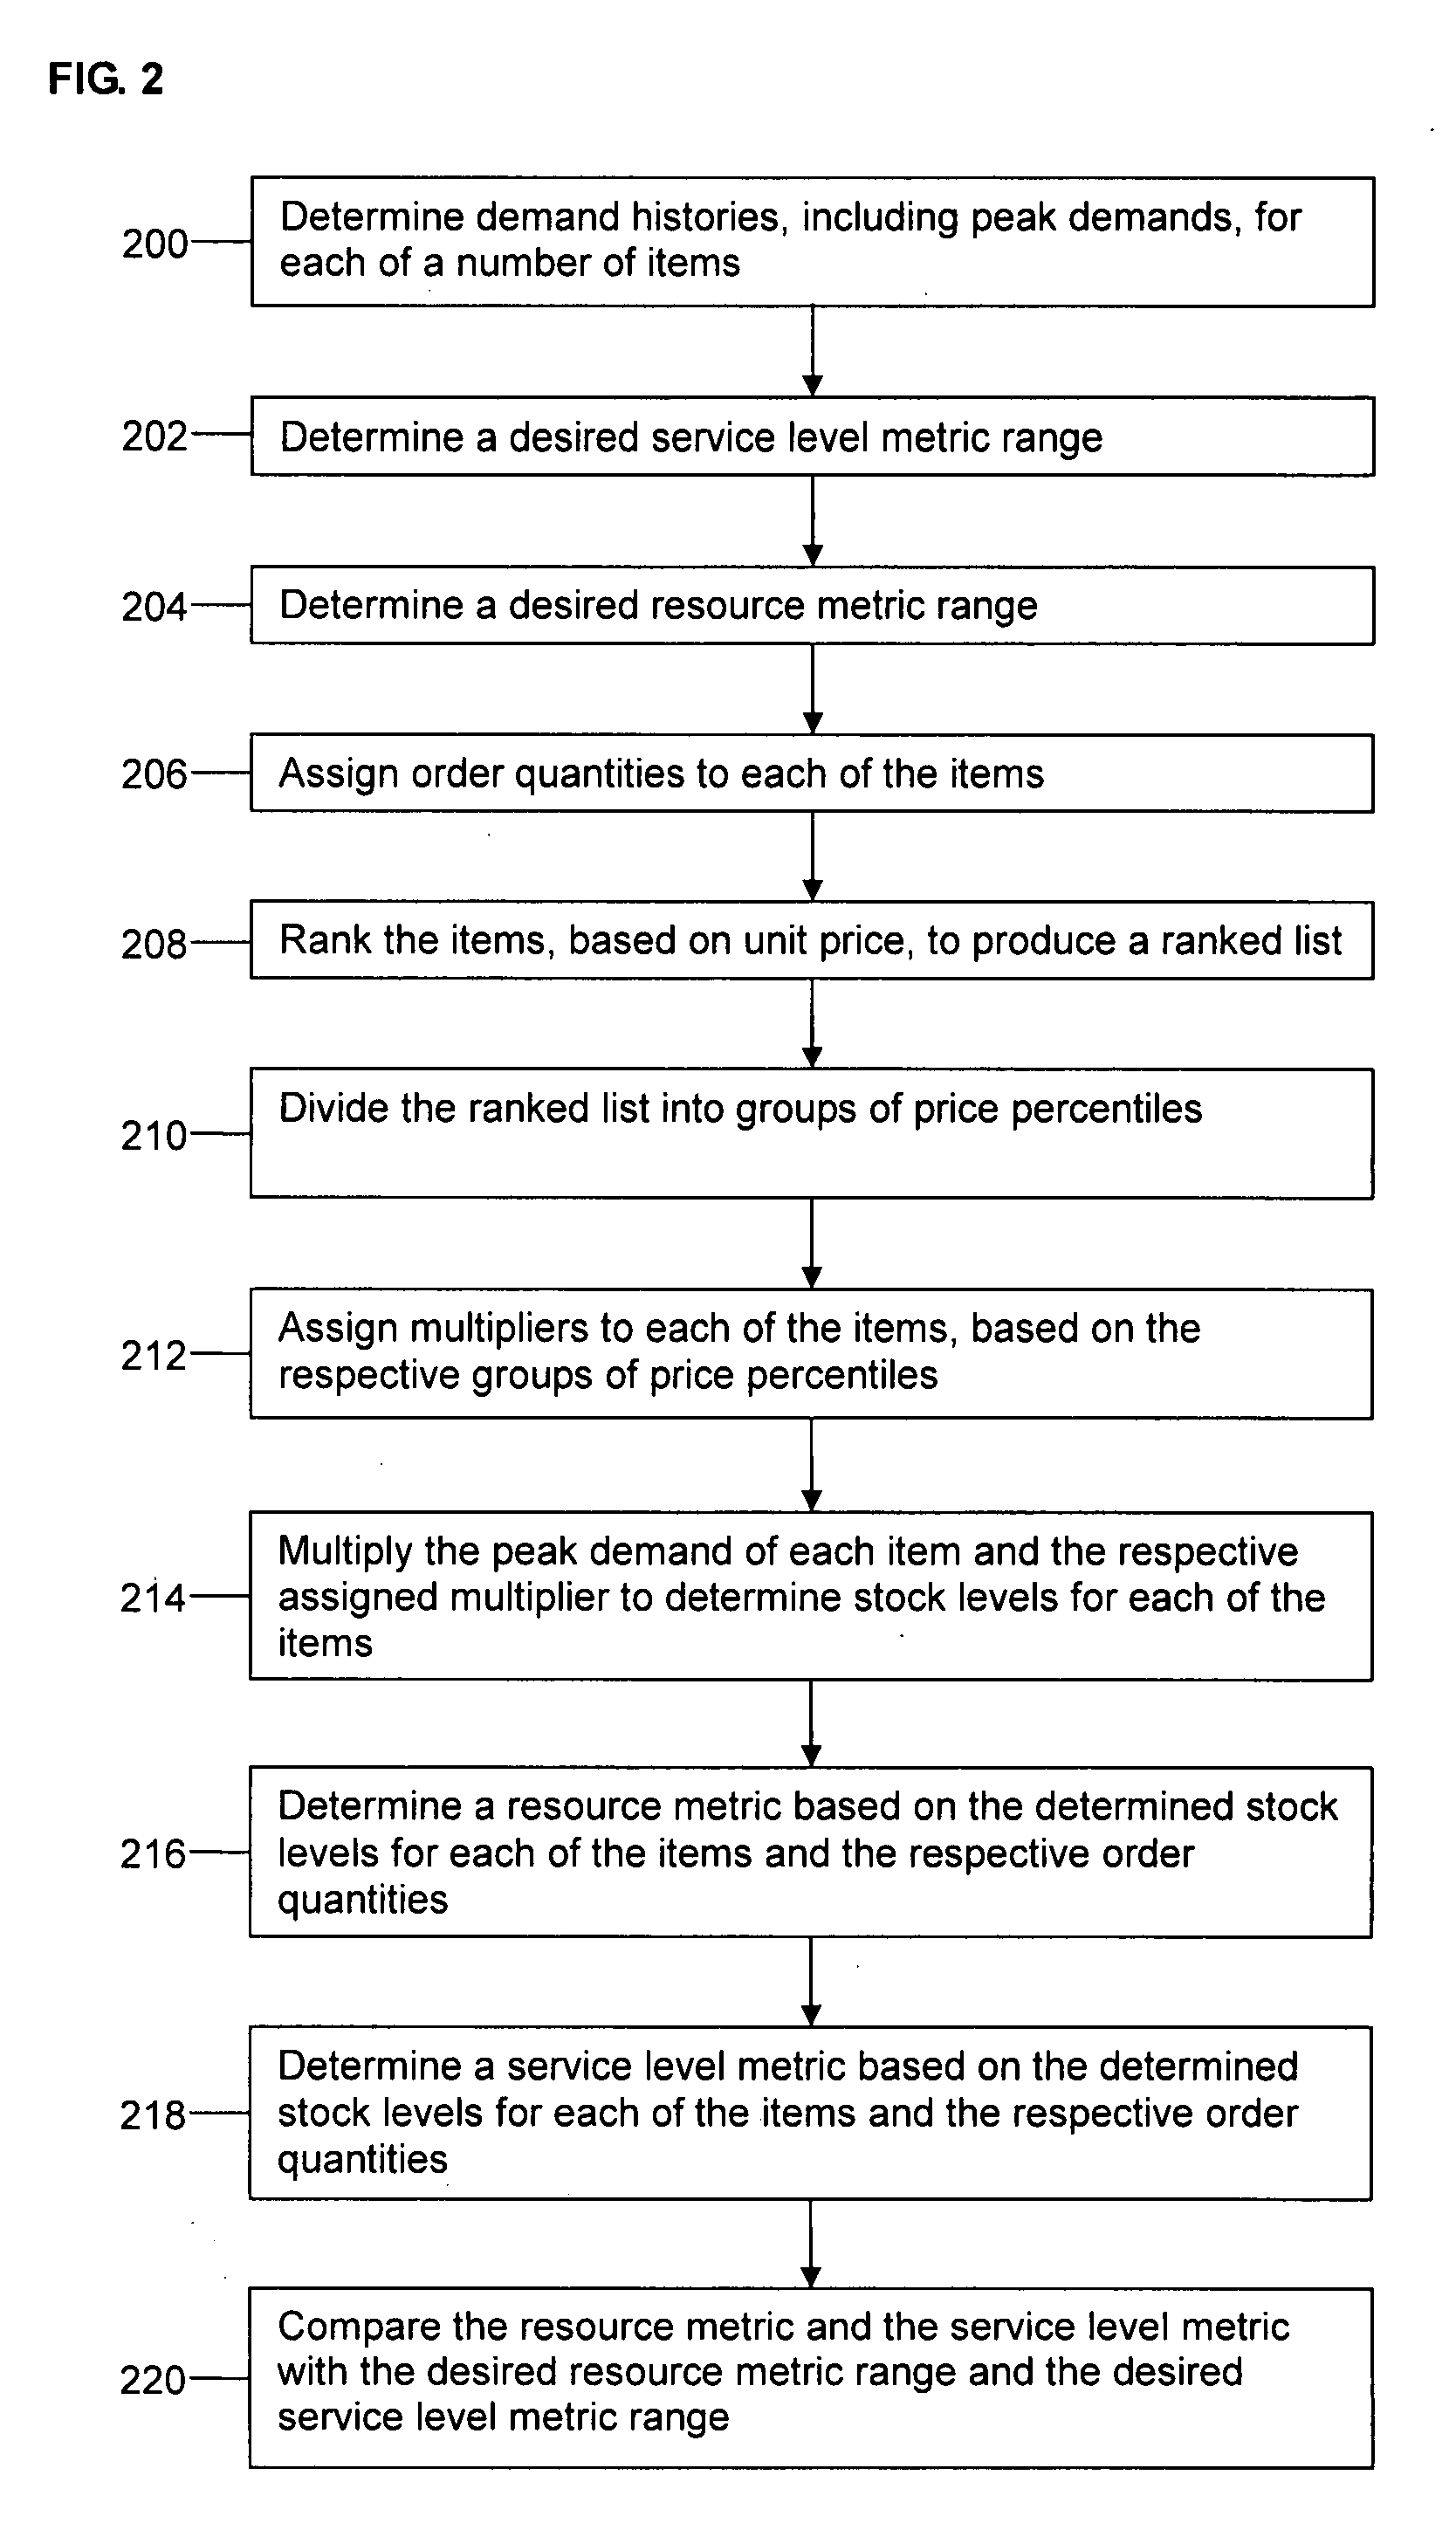
[0051]The items are ranked by unit price in operation 408 and the ranked list is divided into groups of price percentiles at operation 410, for example, a first set of groups of price percentiles and a second set of groups of price percentiles. The first set of groups of price percentiles may be, for example, 1st-25th, 26th-49th, 50th-74th and 75th-100th percentiles, while the second set of groups of price percentiles may be, for example, 1st-33rd, 34th-66th and 67th-100th percentiles. At operation 412, multipliers are assigned to each of the items in t...
first embodiment
[0059]At operation 600, a set of parameters is chosen to be used in creating a metrics curve. The set of parameters is generally chosen based on a parameter representing a source policy determined by using the method of the For example, if the source policy uses a parameter of 1.0, in order to create a curve extending in both directions from the source policy parameter, a set of parameters used will be parameters which are less than and greater than the source policy parameter of 1.0 (i.e., 0.25, 0.50, 0.75, 1.0, 1.5, 2.0, 2.5 and 3.0). The parameters must vary enough so that there is sufficient variation in the values of the metrics to draw a full curve. FIG. 7 is a chart showing an example of a set of parameters and a set of peak multipliers for each of the parameters.
[0060]At operation 602, for each parameter in the set, the assigned multipliers are multiplied by the parameter to determine parameter-specific multipliers for each parameter. The peak demand of each item is then mu...
PUM
 Abstract
Description
Claims
Application Information
 - R&D
- Intellectual Property
- Life Sciences
- Materials
- Tech Scout
- Unparalleled Data Quality
- Higher Quality Content
- 60% Fewer Hallucinations
Browse by: Latest US Patents, China's latest patents, Technical Efficacy Thesaurus, Application Domain, Technology Topic, Popular Technical Reports.
© 2025 PatSnap. All rights reserved.Legal|Privacy policy|Modern Slavery Act Transparency Statement|Sitemap|About US| Contact US: help@patsnap.com


