Method and arrangement for outputting residual errors for a function customized to a set of points

a function and residual error technology, applied in the field of methods and arrangements for displaying residual errors of functions, can solve the problems of difficult visual assignment of residual errors to the fitted function, observer difficulty in distinguishing the quality of the fit of the function to the data points, etc., and achieves the effect of simple and accurate visual assessment of the quality of the fi

Active Publication Date: 2014-02-18
CARL ZEISS MICROSCOPY GMBH
View PDF4 Cites 0 Cited by
  • Summary
  • Abstract
  • Description
  • Claims
  • Application Information

AI Technical Summary

Benefits of technology

[0010]Therefore, it is the object of the invention to improve a method and an arrangement of the type mentioned above so as to enable a simple and accurate visual assessment of the quality of the fit.
[0014]The visual codes can be assigned by means of a lookup table or by means of a functional relationship. In both cases, a deviation should ideally correspond exactly to a visual code. When the store of values is limited, a visual code can be assigned to a plurality of deviations or to a range of deviations. A functional relationship can be linear, for example. The advantage in using a table is that any codes can be defined easily. Accordingly, the display can be suited to specific requirements. For example, the contrast can be increased to make smaller deviations more clearly visible or reduced for a more vigorous suppression of statistical noise. The advantage in using a functional relationship is that it makes possible a quantitative evaluation of the graph when a legend or key representing the code is displayed at the same time. Mixed forms of assignment are also possible. For example, functional relationships with different value ranges can be stored in a table.
[0016]This kind of display makes it possible for the observer to discern the residuals in the graph of the fitted function and to assess the quality of the fit. The observer need not observe two graphs simultaneously, but rather only one individual graph. This has the added advantage that the graphic rendering requires less space because the separate residuals graph can be dispensed with. Alternatively, the display of the graph of the fitted function can be larger so that it can be perceived better.
[0018]In particularly preferred embodiment forms, a first hue is assigned to visual codes for positive residual errors and a second hue is assigned to visual codes for negative residual errors. In this way, areas of the fitted function with positive residual errors can easily be distinguished from those with negative residual errors.
[0019]An intensity or a saturation of the respective visual code is advantageously determined depending on the amount of the residual error in question. In this way, the severity of the deviation of the fit from the data points can be seen easily.

Problems solved by technology

These known forms of data display have the disadvantage that an observer has difficulty distinguishing the quality of the fit of the function to the data points.
With a two-dimensional fit, the visual assignment of the residual errors to the fitted function is particularly difficult because of the perspective and is therefore inaccurate.

Method used


Image

  • Method and arrangement for outputting residual errors for a function customized to a set of points
  • Method and arrangement for outputting residual errors for a function customized to a set of points
  • Method and arrangement for outputting residual errors for a function customized to a set of points

Examples


Embodiment Construction

[0029]It is to be understood that the figures and descriptions of the present invention have been simplified to illustrate elements that are relevant for a clear understanding of the present invention, while eliminating, for purposes of clarity, many other elements which are conventional in this art. Those of ordinary skill in the art will recognize that other elements are desirable for implementing the present invention. However, because such elements are well known in the art, and because they do not facilitate a better understanding of the present invention, a discussion of such elements is not provided herein.

[0030]The present invention will now be described in detail on the basis of exemplary embodiments.

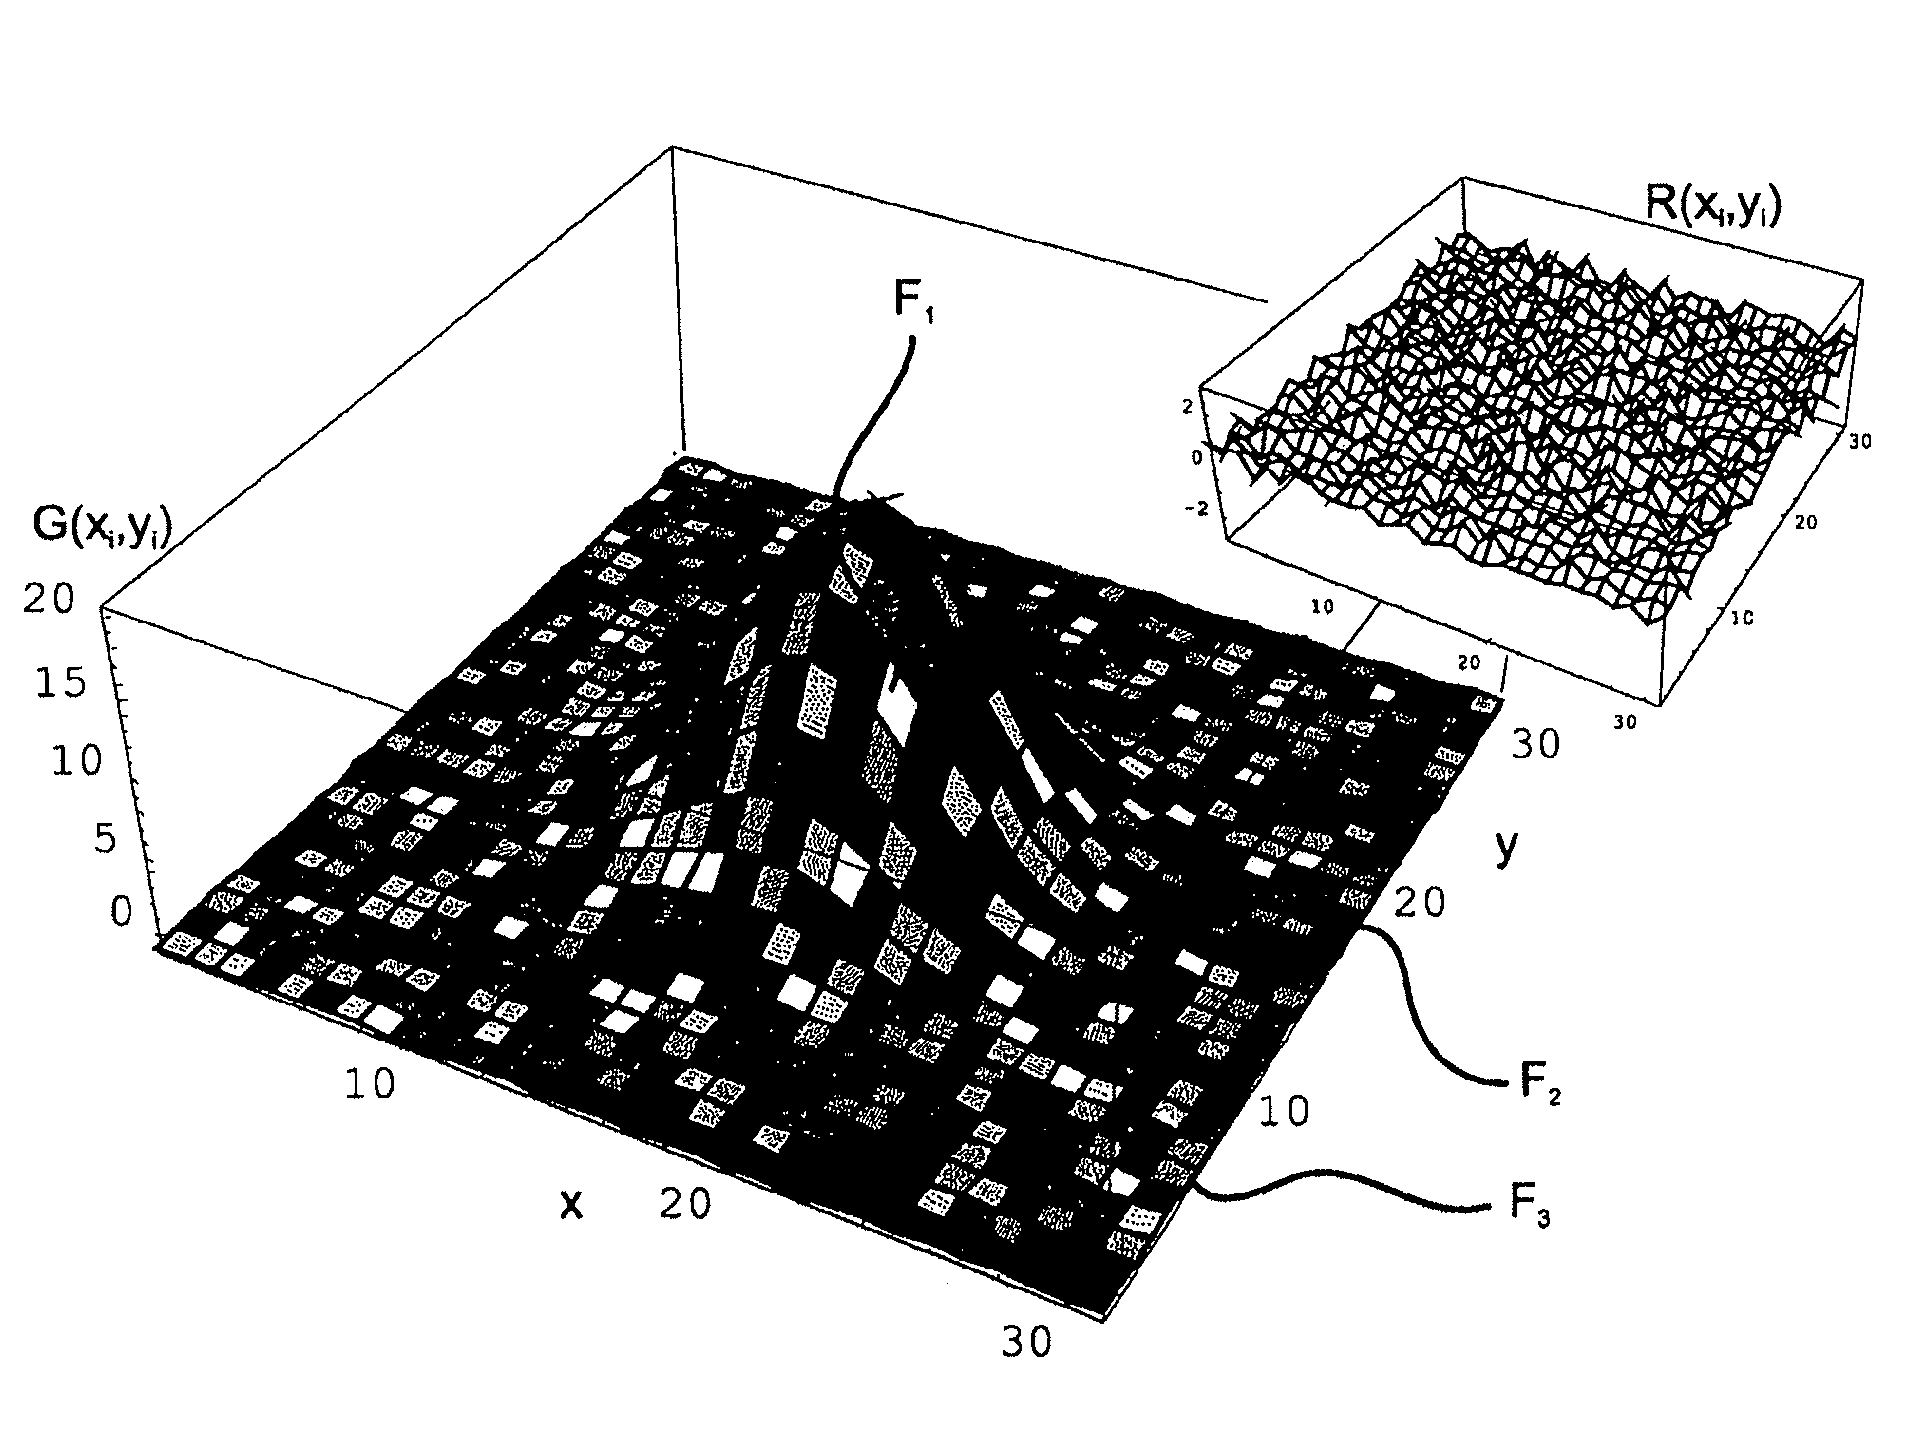
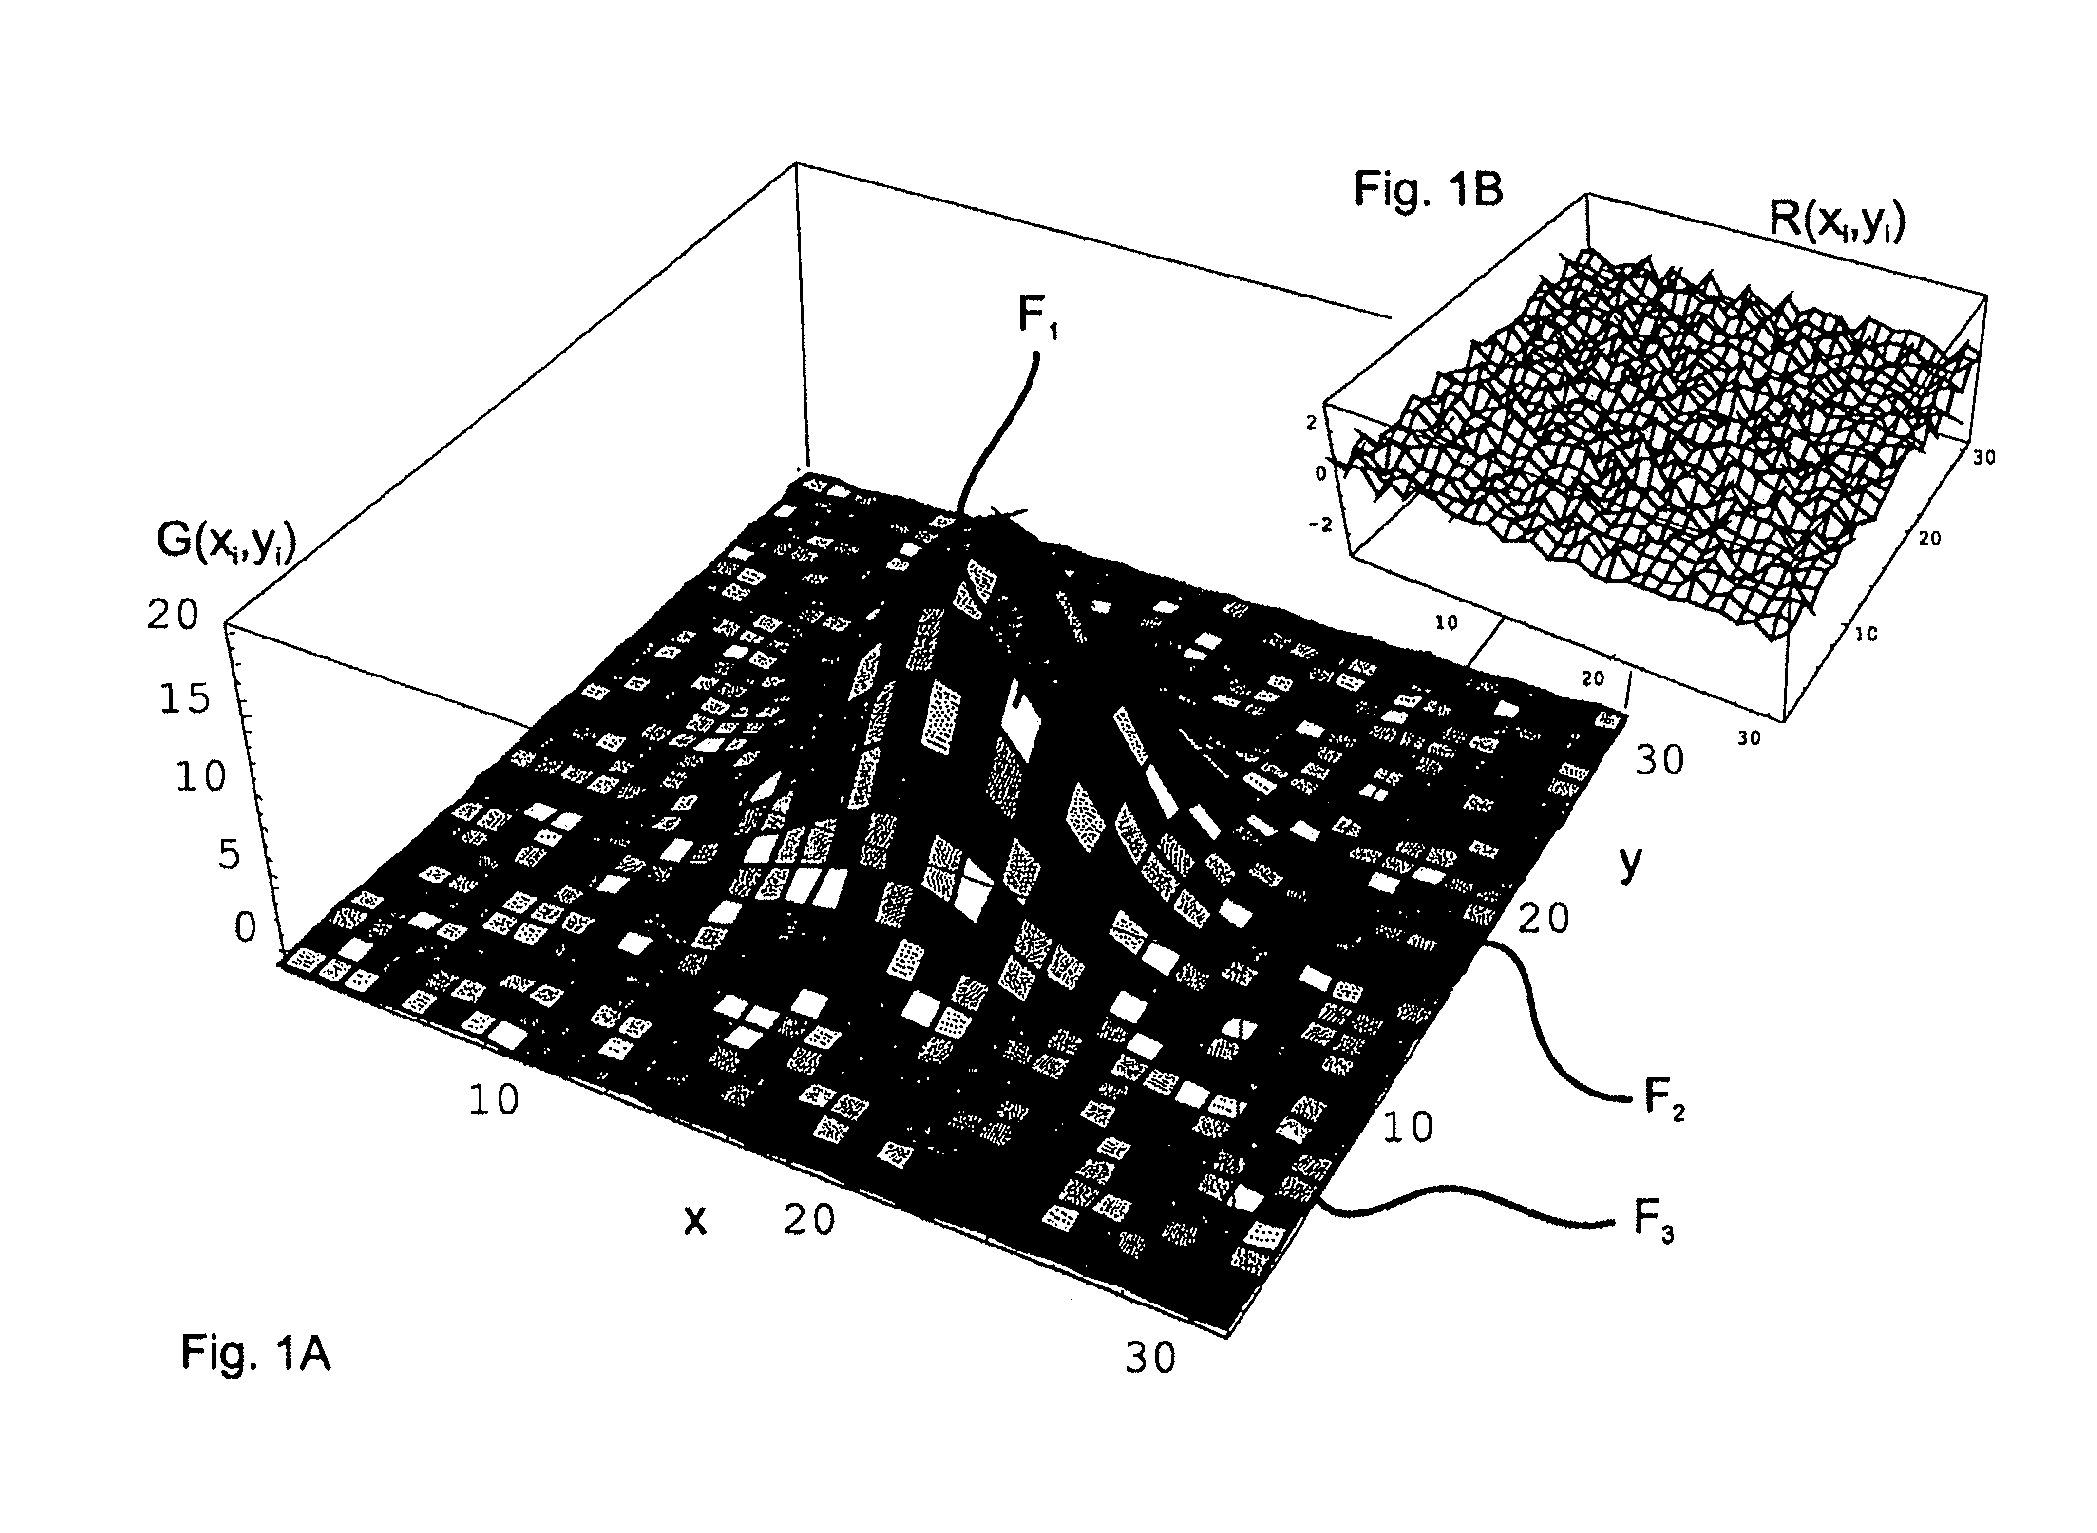
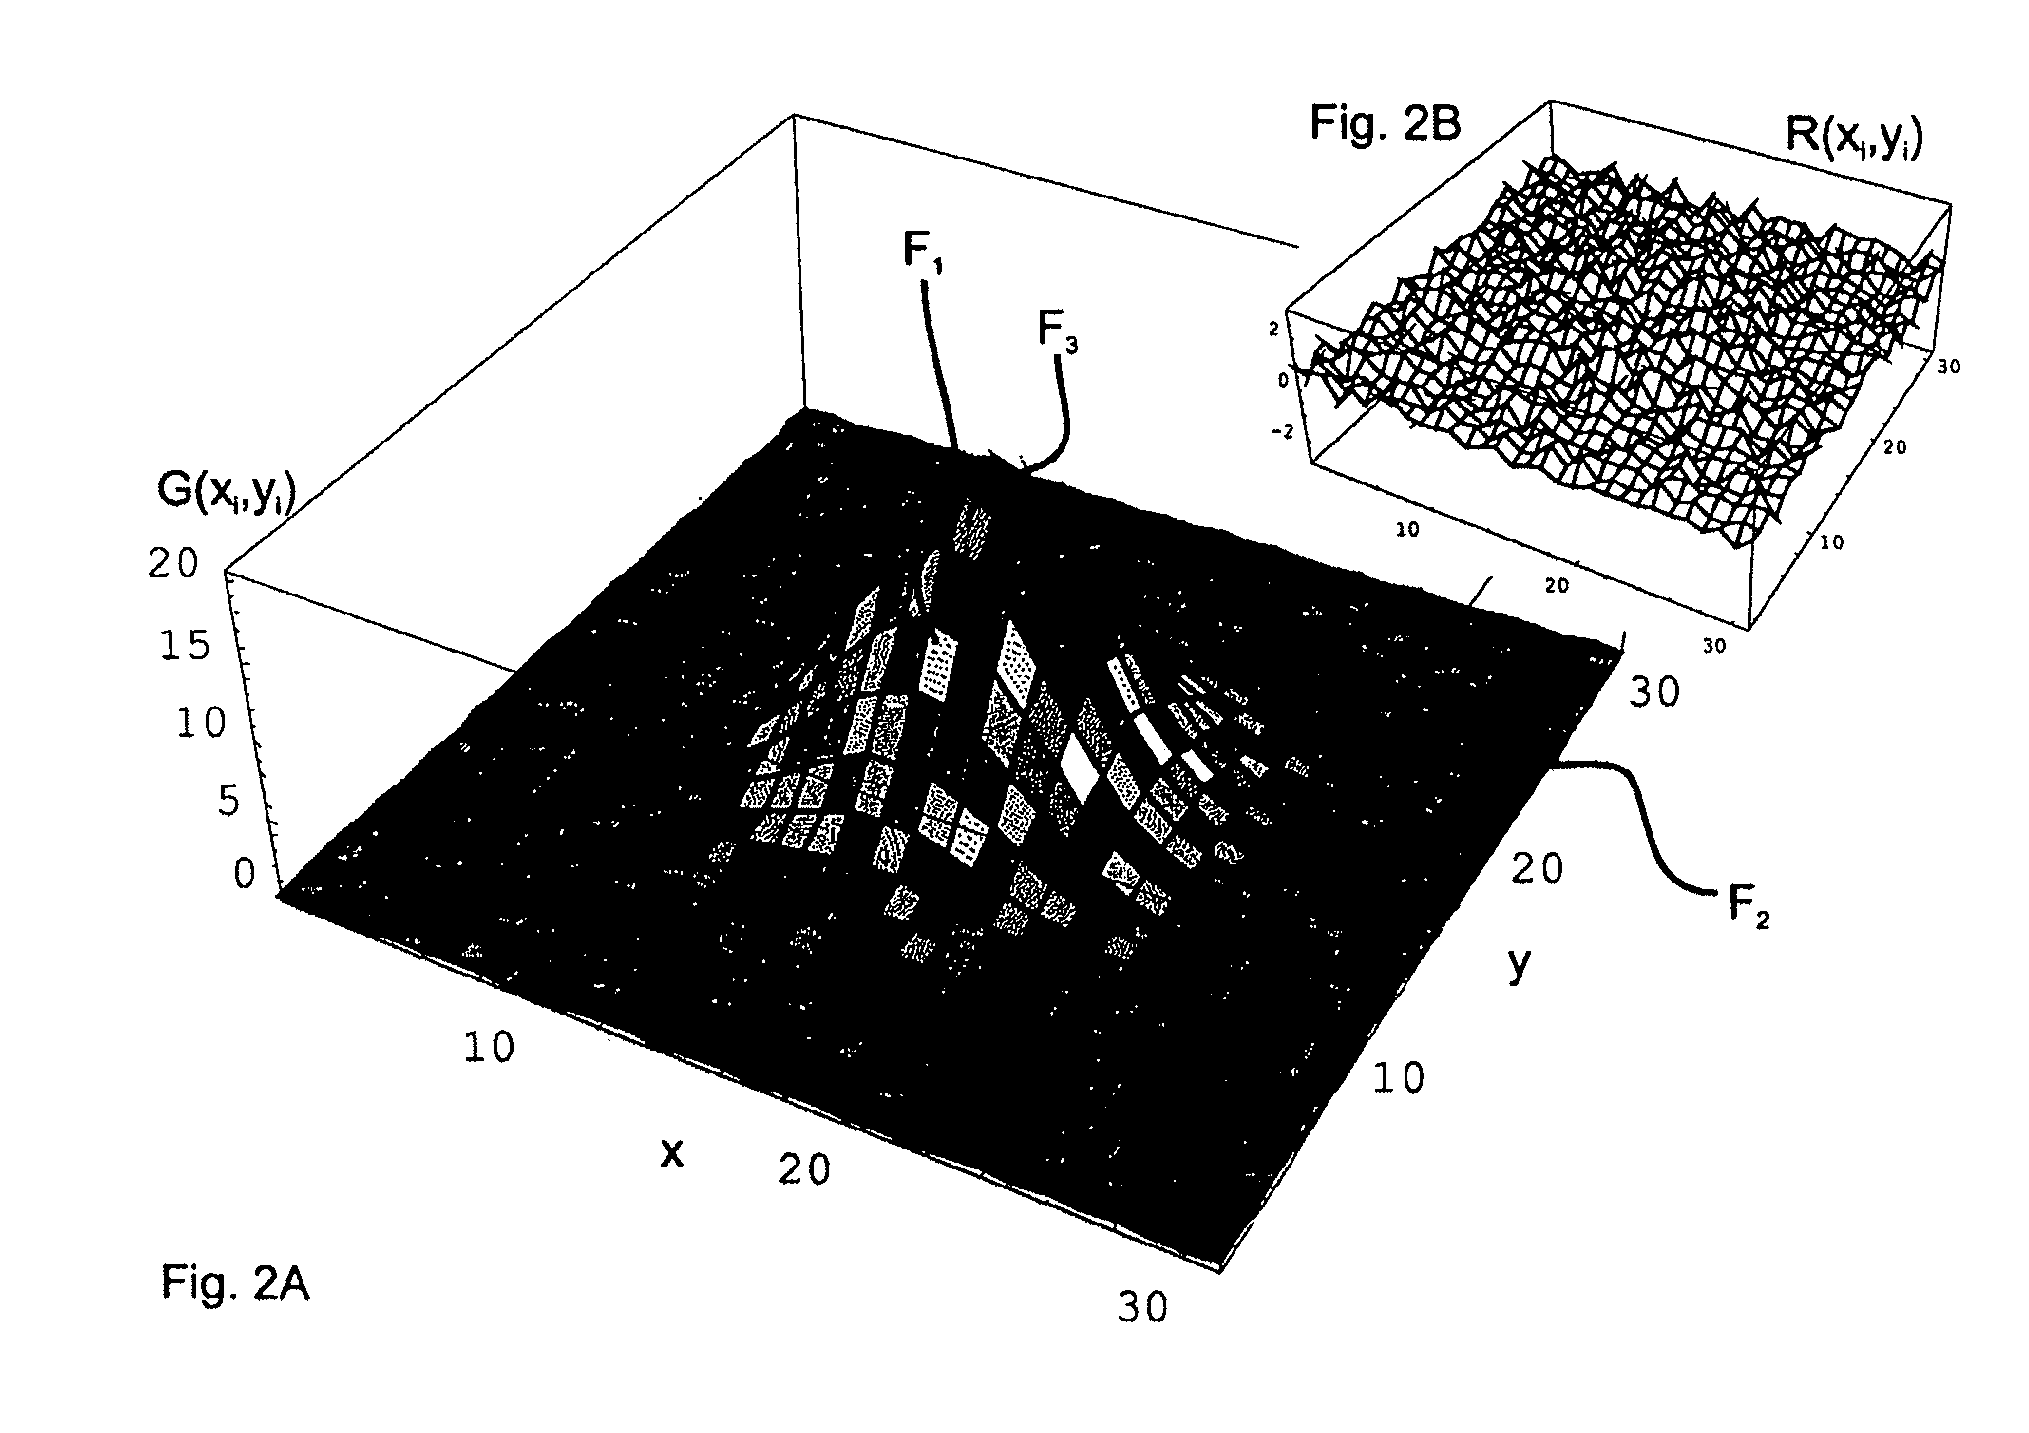
[0031]A graph of a function G(x,y) is shown in each FIG. 1A to 3A in a perspective pseudo-3D grid rendering. The respective function G(x,y) is fitted by means of curve fitting calculations to a set of data points (not shown) that is identical for all of the Figures, for example...


PUM


Abstract

The invention is directed to a method and an arrangement for displaying residual errors of a function which is fitted to a set of points. In the prior art, the residual errors are displayed in a separate graph apart from the function graph so that it is difficult for an observer to discern the quality of the fit of the function to the data points. An improved method and an improved arrangement make it possible to visually assess the quality of the fit in a simple, accurate manner. According to the invention, visual codes are assigned to the fitted function or to the data points of the point set piecewise or pointwise depending on the residual errors, and the fitted function is displayed graphically at an interface, wherein the fitted function is displayed piecewise or pointwise in the form of the assigned visual codes. The invention is preferably used for raster image spectroscopy with laser scanning microscopes.

Description

[0001]The present application claims priority from PCT Patent Application No. PCT / EP2008 / 007701 filed on Sep. 16, 2008, which claims priority from German Patent Application No. 10 2007 045 666.4 filed on Sep. 25, 2007, the disclosure of which is incorporated herein by reference in its entirety.BACKGROUND OF THE INVENTION[0002]1. Field of the Invention[0003]The invention is directed to a method and an arrangement for displaying residual errors of a function which is fitted to a set of points.[0004]2. Description of Related Art[0005]A set of points comprises a plurality of discrete data points. At least two coordinates of a correspondingly multi-dimensional number space and a one-dimensional or multi-dimensional value are assigned to each of these points. The points can directly represent measurement data or can be derived indirectly from measurement data. A fitted function is an implicitly or explicitly defined assignment rule. It may or may not be constant and can be defined continu...

Claims


Application Information

Patent Timeline
Patent Type & Authority Patents(United States)
IPC IPC(8): G06T11/20
CPCG06T11/206
Inventor HEIDKAMP, MARCUSWAGNER-CONRAD, STEPHANWEISSHART, KLAUS
Owner CARL ZEISS MICROSCOPY GMBH
Why Eureka
Try Eureka