

Method for transforming table into diagram in the process of typesetting and system thereof
A table and chart technology, applied in the direction of editing/combining graphics or text, special data processing applications, instruments, etc., can solve problems such as inconvenient use, low typesetting efficiency, and inability to convert tables into charts, etc., to enhance typesetting effects and improve typesetting efficiency effect
- Summary
- Abstract
- Description
- Claims
- Application Information
AI Technical Summary
Problems solved by technology
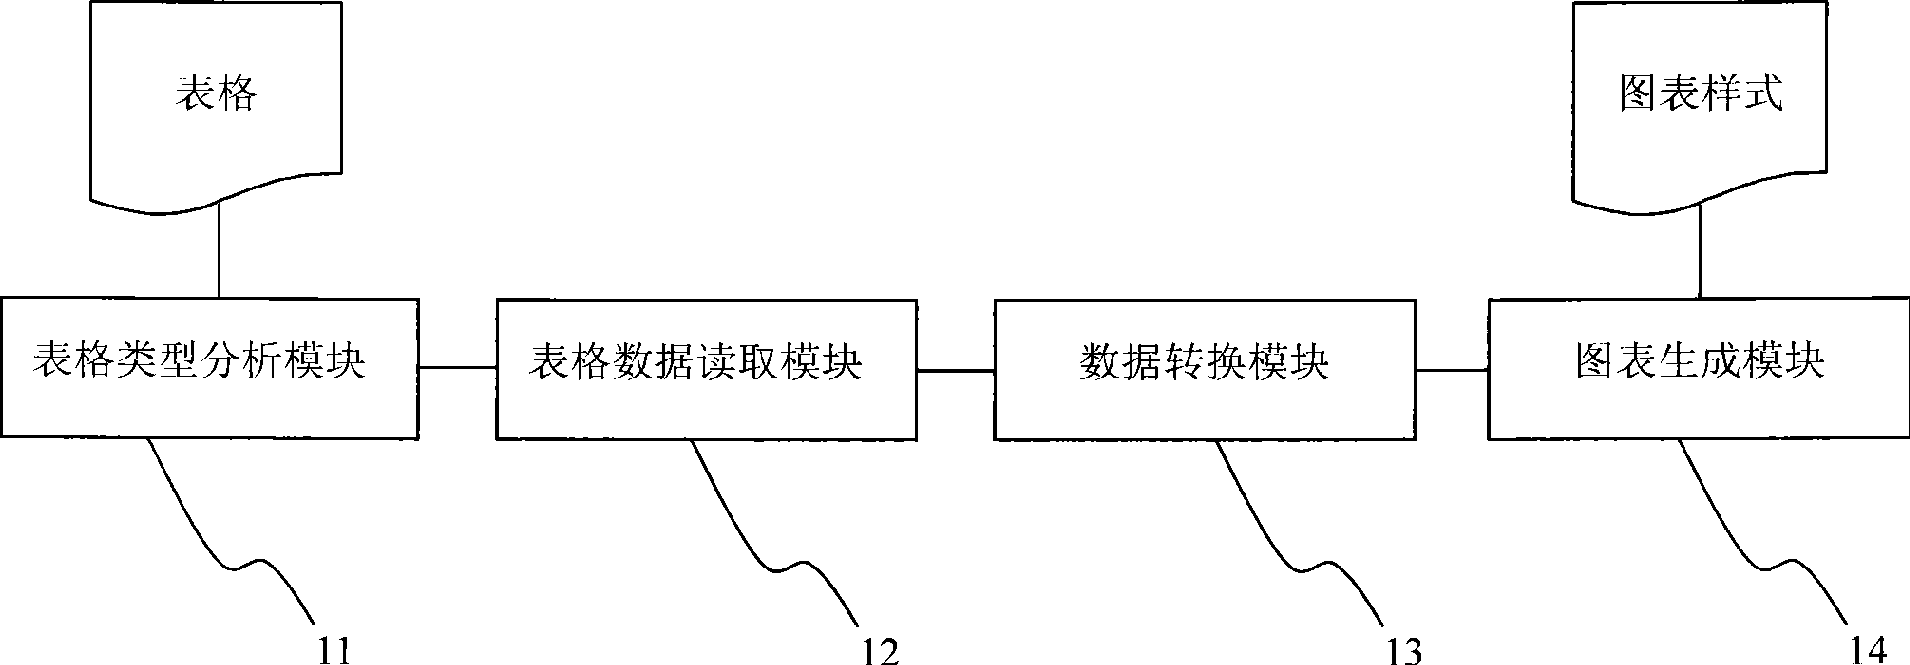
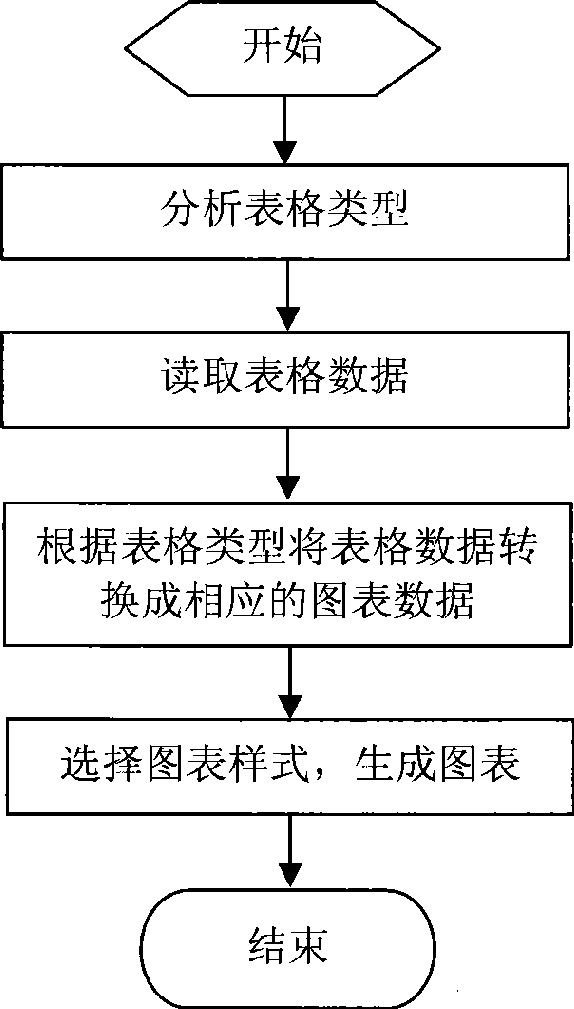
Method used
Image

Examples
Embodiment 1
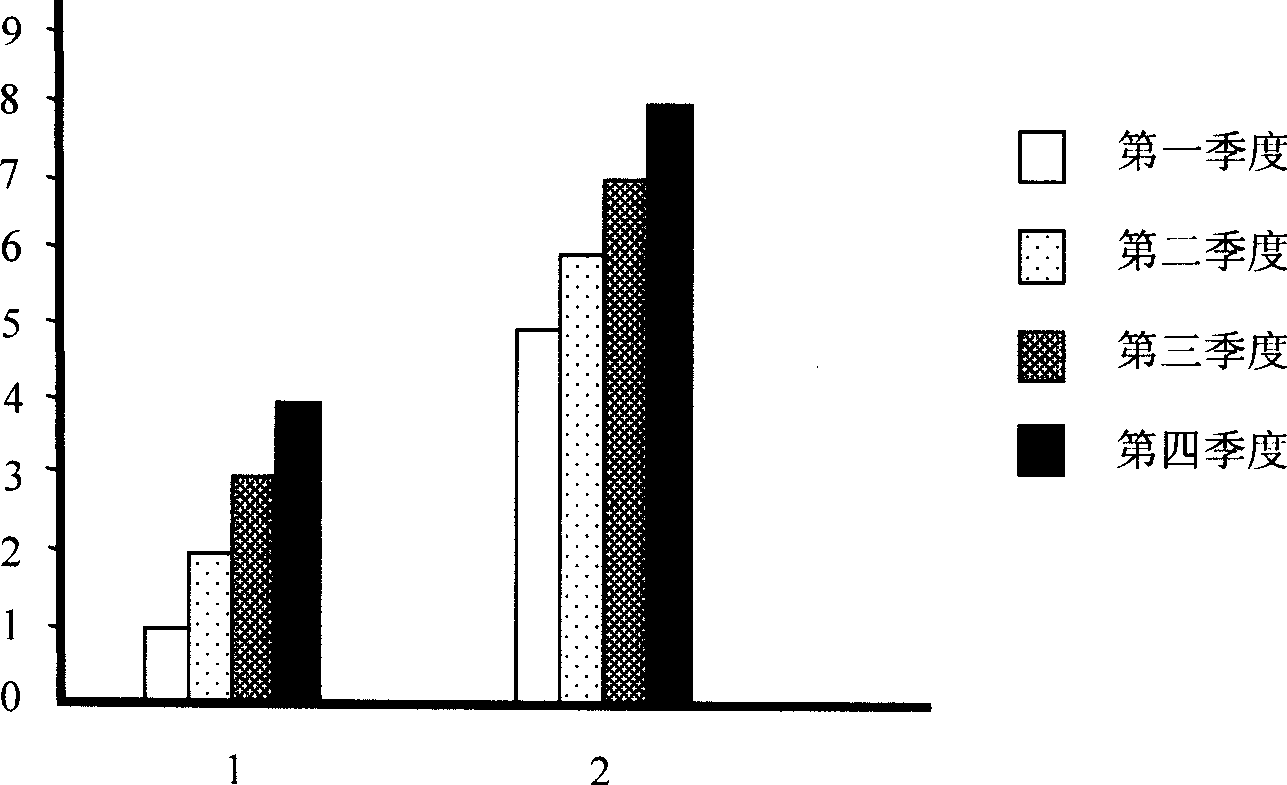
[0041] Taking the conversion of the table shown below into a column chart as an example, the specific implementation manner of the present invention is illustrated.
[0042] 1st quarter Q2 Q3 Q4 1 2 3 4 5 6 7 8
[0043]In the above table, the data in the first row of cells contains text, and the data in other cells is numbers. Assuming that the data in the table is read horizontally based on the behavior, the data in the cells of each row except the first row is used as the sequence data in the chart, that is, "1, 2, 3, 4" is used as the data of the chart sequence 1, and "5, 6, 7, 8" as the data of Chart Sequence 2. The sequence name adopts the default value, which is generally a natural number sequence, that is, the name of sequence 1 is 1, and the name of sequence 2 is 2. Use the column names "Q1, Q2, Q3, Q4" in the first row of the table as the legend for the chart. The final converted column chart is as follows Figure 3.1 shown.
[0...
Embodiment 2
[0047] Taking the conversion of the table shown below into a column chart as an example, the specific implementation manner of the present invention is illustrated.
[0048] 2001 1 2 3 4 year 2002 5 6 7 8
[0049] In the above table, the data in the cells in the first column contains text, and the data in the other cells are numbers. Assume that the table data is read horizontally based on the behavior, and each row of data except the first column is used as the sequence data in the chart, that is, "1, 2, 3, 4" is used as the data of the chart sequence 1, and "5, 6, 7, 8" as the data of chart sequence 2. Take the row names in the first column as the series names, i.e. the name "2001" for series 1 and "2002" for series 2. Legends use default values, which are example 1, example 2, example 3 and example 4 in this embodiment. The final converted column chart is as follows Figure 4.1 shown.
[0050] If the table data is read vertically based on the...
Embodiment 3
[0052] Taking the conversion of the table shown below into a column chart as an example, the specific implementation manner of the present invention is illustrated.
[0053] 1st quarter Q2 Q3 Q4 2001 1 2 3 4 year 2002 5 6 7 8
[0054] In the above table, the data in the cells in the first row and the first column contains text, and the data in other cells is numbers. Assuming that the table data is read horizontally based on the behavior, each row of data except the first row and the first column is regarded as the sequence data in the chart, that is, "1, 2, 3, 4" is used as the data of the chart sequence 1," 5, 6, 7, 8" as the data of Chart Sequence 2. Take the row names in the first column as the series names, i.e. the name "2001" for series 1 and "2002" for series 2. Use the column names "Q1, Q2, Q3, Q4" in the first row as legend. The final converted column chart is as follows Figure 5.1 shown.
[0055] If the tabular data is r...
PUM
 Abstract
Description
Claims
Application Information