Three-dimensional space visualized display method and system of transmission line

A three-dimensional space, transmission line technology, applied in electrical digital data processing, special data processing applications, instruments, etc., can solve problems such as increasing the complexity of business work, not being able to "out-of-the-box, and out-of-the-box" , to achieve the effect of eliminating the manual interactive modeling link

Inactive Publication Date: 2013-10-02
SHENZHEN ADAM SOFTWARE
View PDF3 Cites 1 Cited by
  • Summary
  • Abstract
  • Description
  • Claims
  • Application Information

AI Technical Summary

Problems solved by technology

[0009] ●Firstly, human-computer interaction modeling makes the line 3D visualization system unable to be "out of the box" under the premise of 3D geographic data
The reason is that the structure of the transmission line model is business-related, and it is impossible to complete all the modeling work "in advance", that is, the 3D modeling of the line cannot be separated from the specific business data
In other words, for 3D modeling of transmission lines, only part of the standardized facility models can be constructed independently of specific business data, while those 3D modeling describing the spatial relationship between facilities is a non-standardized application work that does not involve actual business data. The model cannot be constructed in the case of
Therefore, due to the existence of human-computer interaction modeling, the 3D visualization system for transmission lines is still unusable even after all software and hardware installation and application function development are completed, before the 3D modeling for specific business data is completed. This is what is said to not work "out of the box", thus causing further problems for system apps:
In this way, non-electric business technologies such as interactive 3D modeling are brought into the operation and management of transmission lines, which increases the complexity of business work, which not only increases the cost of system operation, but also It will also reduce the overall reliability and availability of the system due to the increase in the complexity of business technology

Method used


Image

  • Three-dimensional space visualized display method and system of transmission line
  • Three-dimensional space visualized display method and system of transmission line
  • Three-dimensional space visualized display method and system of transmission line

Examples


Embodiment Construction

[0054] The method and system of the present invention are mainly used to provide three-dimensional visualization application support tools for transmission line operation management activities, such as a power transmission line operation monitoring system, a power transmission business integrated information visualization display system, and a three-dimensional display system for transmission line design schemes. Supported by the results, it is promoted to a whole new level of technology. The system of the present invention can be developed and implemented on various computer operating systems, graphics engine software packages (such as OpenGL, etc.), and database systems using high-level programming languages, and can also be based on graphics processing software (such as general graphics software packages, CAD software, GIS, etc.) Platform software, etc.) secondary development and implementation, can run on various general computer hardware platforms.

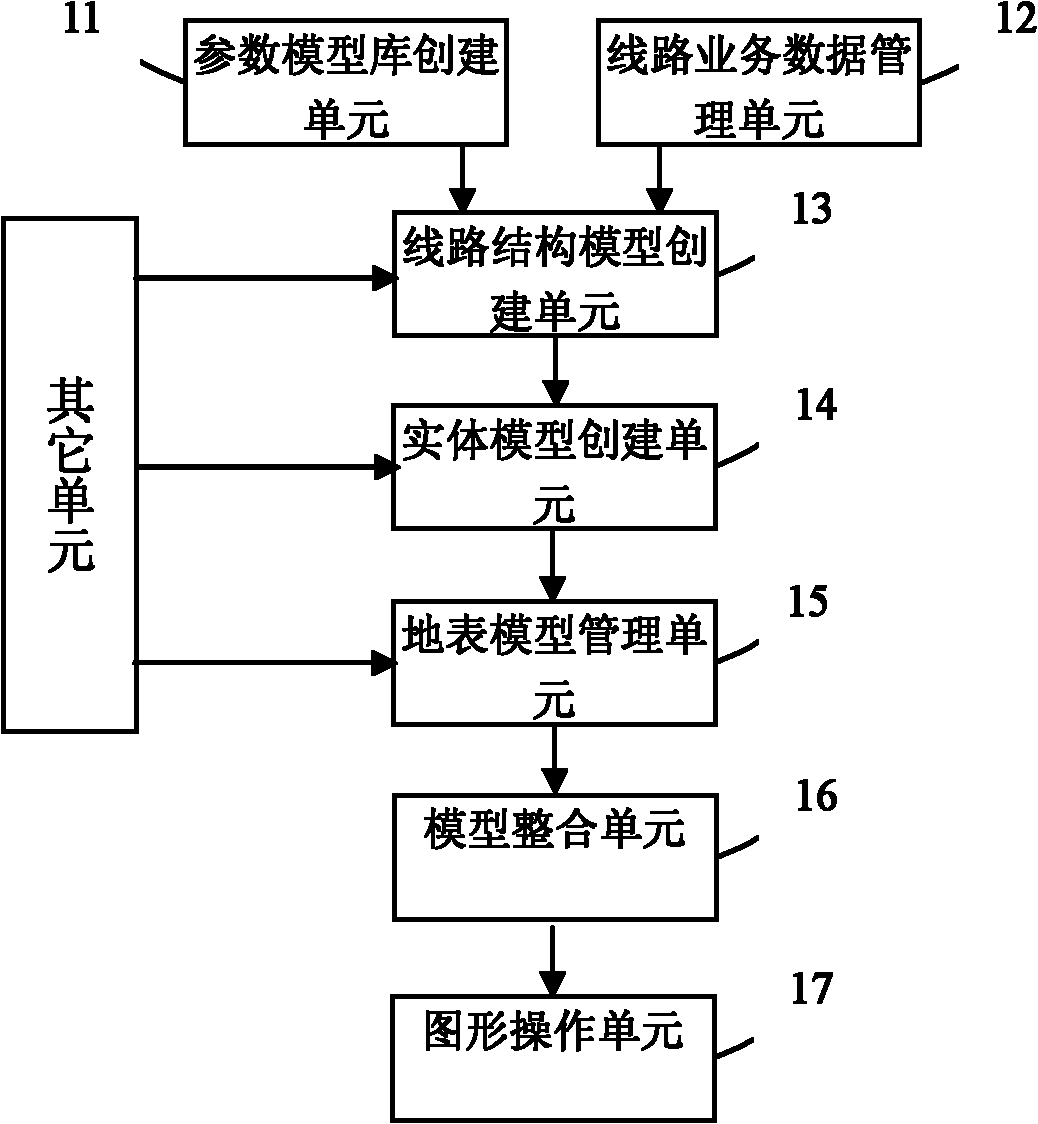
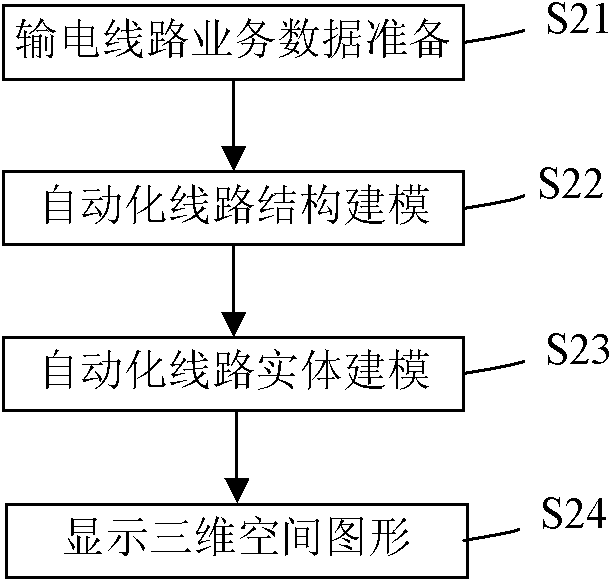
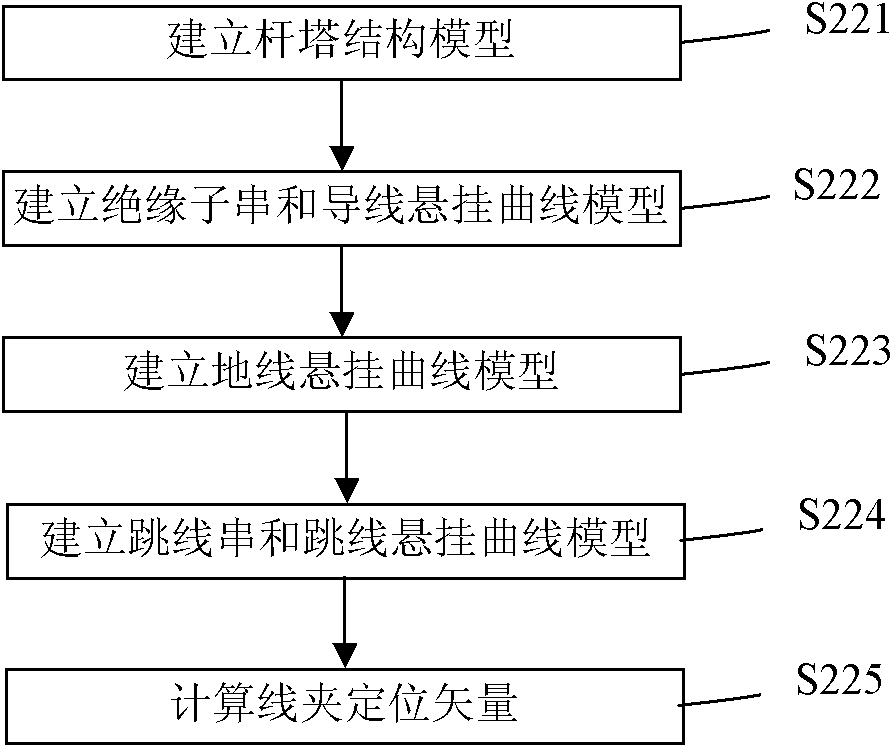
[0055] like figure 1...


PUM


Abstract

The invention relates to a three-dimensional space visualized display method of a transmission line, comprising the following steps of: a, under the driving of transmission service data, obtaining functional and structural parameters by a parameter model base of a line facility structure and automatically establishing a line structure model with a deign precision; b, establishing a line three-dimensional solid model based on the line structure model; and c, displaying the data of the line solid model to obtain a three-dimensional space image of the transmission line, wherein each type of the line facility is classified according to types and at least comprises a set of parameter model; and the parameter model comprises facility functional and structural parameters. The invention further provides a visualized display system of the three-dimensional space of the transmission line and the system is driven by the service data to directly and automatically generate a three-dimensional model with the deign precision; according to the invention, an artificial interactive modeling link in the professional visualized system of the transmission line is eliminated, so that full-automatic information processing work from the transmission service data to the line three-dimensional model and the three-dimensional image is realized.

Description

technical field [0001] The present invention relates to the field of computer data visualization processing, and more specifically, the present invention relates to a three-dimensional visualization display method and system for transmission lines directly driven by service data. Background technique [0002] High-voltage transmission lines have the characteristics of long working distances and tower equipment distributed in the wild environment. The lines also cross with other power lines, communication lines, and rivers and gullies. The inspection and monitoring of lines has always been a difficult task for power grid companies. , it is very necessary to use 3D visualization technology to comprehensively and visually display the transmission line corridor scene and related information in operation management. [0003] At present, there are two main types of 3D visualization systems for transmission lines. One is a general-level visualization system with simplified line fac...

Claims


Application Information

Patent Timeline
Patent Type & Authority Patents(China)
IPC IPC(8): G06F17/50
Inventor 吕珂李毅
Owner SHENZHEN ADAM SOFTWARE
Why Eureka
Try Eureka