Quartile graph-based data quality detection method and system

A data quality and detection method technology, applied in the data field, can solve problems such as lack

Active Publication Date: 2013-12-25
SHENZHEN AUDAQUE DATA TECH
View PDF0 Cites 5 Cited by
  • Summary
  • Abstract
  • Description
  • Claims
  • Application Information

AI Technical Summary

Problems solved by technology

The quartile map is just a display tool and can only be used to show the distribution of one-dimensional data
Therefore, there is a lack of a method to display and analyze the distribution of two-dimensional data by using the basic characteristics of the quadrant graph, and has the function of data error correction

Method used


Image

  • Quartile graph-based data quality detection method and system
  • Quartile graph-based data quality detection method and system

Examples


Embodiment Construction

[0027] In order to make the purpose, technical solution and advantages of the present invention more clear, the present invention will be further described in detail below in conjunction with the accompanying drawings and embodiments. It should be understood that the specific embodiments described here are only used to explain the present invention, not to limit the present invention.

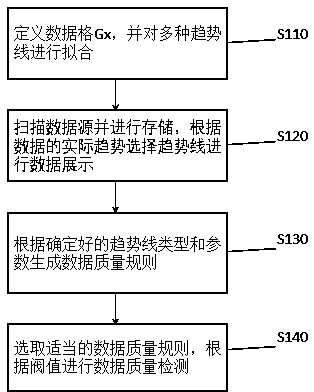
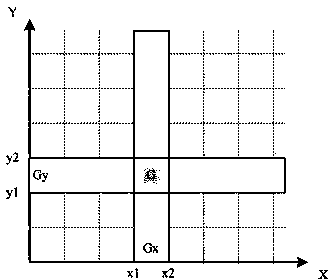
[0028] The present invention provides a data quality detection method and system based on a quartile map. The present invention stores data by defining a data grid Gx, uses a quartile map to display data, and generates data quality based on a determined trend line. Rules, and then set thresholds according to the rules for data quality inspection, realizing data display and abnormal data analysis, data error correction and other applications when the amount of data is huge.

[0029] Such as figure 1 It is a specific flow diagram of a data quality detection method based on a quartile map provide...


PUM


Abstract

The invention provides a quartile graph-based data quality detection method. The method comprises the steps of: defining data grids Gx, and fitting various trend lines; scanning and storing a data source, and selecting one trend line for displaying data according to practical data trend; generating data quality rules according to the type and parameters of the confirmed trend line; selecting proper data quality rules, and performing data quality detection according to threshold values. According to the method, the applications of data display, abnormal data analysis, data error correction and the like can be realized under the condition of massive data by defining the data grids Gx to store the data, displaying the data through a quartile graph, and generating the data quality rules according to the confirmed trend line and performing data quality detection according to the threshold values set based on the rules. In addition, another embodiment of the invention provides a quartile graph-based data quality detection system.

Description

technical field [0001] The invention relates to the field of data, in particular to a method and system for detecting data quality based on a quartile map. Background technique [0002] The quartile graph is a graph showing the distribution of one-dimensional data. It can intuitively show the distribution of data, including five data points: the lowest digit, the quarter digit, the median digit, the three-quarter digit, highest bit. Among them, the lowest bit and the highest bit correspond to the minimum value and the maximum value respectively. A quarter bit means that 25% of all data is less than this value. Similarly, the median bit means that 50% of all data is less than this value. Three-thirds means that 75% of all data is less than this value. The quartile map is just a display tool and can only be used to show the distribution of one-dimensional data. Therefore, there is a lack of a method for displaying and analyzing the distribution of two-dimensional data and h...

Claims


Application Information

Patent Timeline
IPC IPC(8): G06F19/00G16B45/00
CPCG16C99/00G06F16/2462G06F16/248G06T11/206
Inventor 王明兴樊文飞贾西贝
Owner SHENZHEN AUDAQUE DATA TECH
Why Eureka
Try Eureka