
Frequency domain correlation analysis method for cardiac mapping signals

A technology of cardiac mapping and analysis methods, which is applied in the directions of diagnostic recording/measurement, medical science, sensors, etc., and can solve the problems of inability to reflect the degree of correlation between two signals in the frequency domain, low coherence coefficient, and large limitations.

Active Publication Date: 2016-11-23
FUDAN UNIV
View PDF2 Cites 6 Cited by
  • Summary
  • Abstract
  • Description
  • Claims
  • Application Information

AI Technical Summary

Problems solved by technology

Moreover, correlation analysis cannot reflect the degree of correlation between the two signals in the frequency domain
Although coherence analysis can be used to analyze the degree of correlation between two signals in the frequency domain, its application is limited (for signals at different origin locations, the coherence coefficients at all frequencies are low), it is difficult to analyze multiple Complex arrhythmia signal at point of origin (eg, atrial fibrillation)

Method used


Image

  • Frequency domain correlation analysis method for cardiac mapping signals
  • Frequency domain correlation analysis method for cardiac mapping signals
  • Frequency domain correlation analysis method for cardiac mapping signals

Examples


Embodiment 1

[0040] Example 1: The F correlation method of the present invention is used for sinus rhythm mapping signals (consistent rhythms in different parts) and atrial fibrillation signals (multiple rhythms exist, and rhythms in different parts may be inconsistent), and the traditional correlation analysis and Correlation analysis for comparison. In this embodiment, epicardial mapping signals are used, and the workflow is as follows:

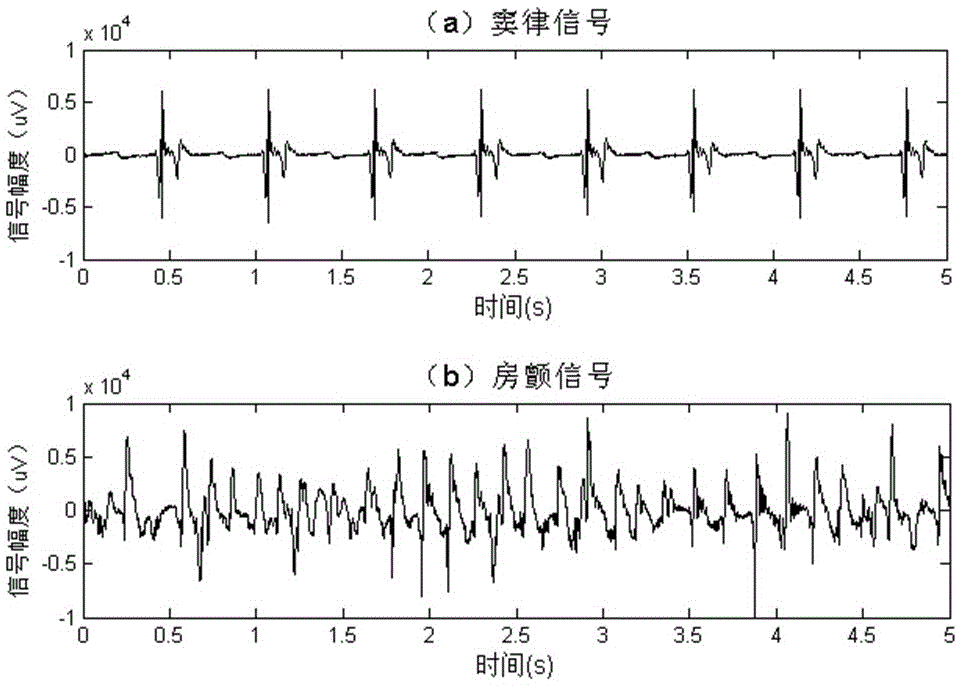
[0041] (1). Using epicardial mapping technology to collect epicardial mapping signals (digital signals) of dogs. Such as figure 1 as shown, figure 1 (a) is the sinus rhythm signal at a certain mapping point, figure 1 (b) is the atrial fibrillation signal at another mapping site. figure 1 (a) with figure 1 (b) Not collected at the same time.

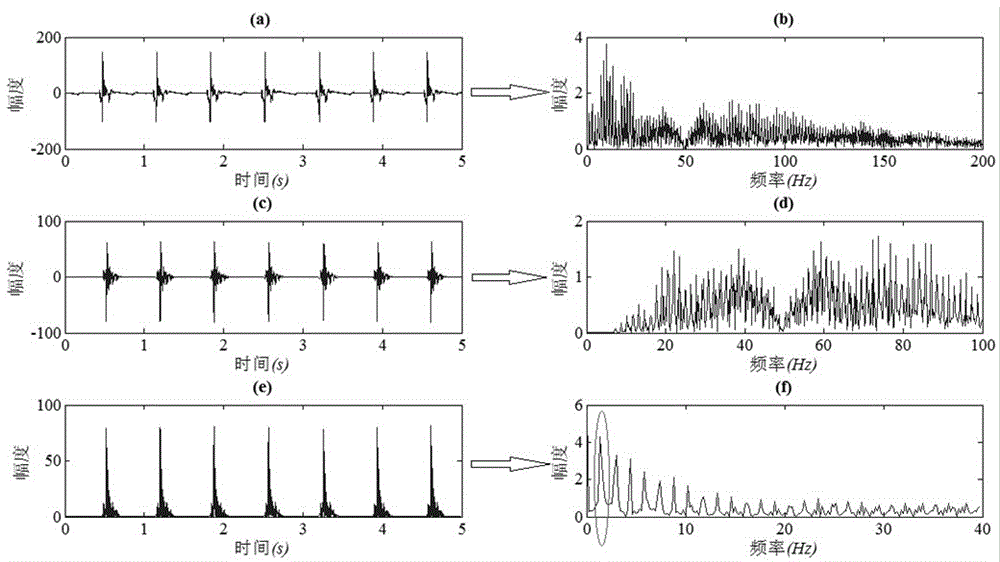
[0042] (2). Perform 20-100Hz band-pass filtering on the sinus rhythm signal collected in step (1). Such as figure 2 as shown, figure 2 (a) is a period of 5s sinus rhythm signal at a certain mapping ...

Embodiment 2

[0057] Example 2: Figure 8 It is an embodiment in which the F-correlation of the present invention (calculation steps are the same as in Embodiment 1) is applied to the time dimension of 128-way mapping signals. In this example, the electrical signals of 128 points on the outer surface of the atrium are collected simultaneously and continuously collected at a certain sampling frequency. will t 1 The signal collected at time and t 1 Each corresponding channel of the signal that starts to be collected at +Δt moment implements the F correlation of the present invention (such as taking Δt=10s, the signal duration is 5s, that is, No. 1 channel t 1 A period of 5s long signal collected from time to time is related to channel 1 t 1 Another 5s long signal collected at +10s is subjected to F-correlation; all 128 signals are implemented sequentially), and two indicators F-C of F-correlation are obtained max and F-f max . Figure 8 It is a schematic diagram of the result when Δt=10...

Embodiment 3

[0058] Embodiment 3: FIG. 9 is an embodiment in which the F-correlation of the present invention (calculation steps are the same as in Embodiment 1) is applied to the spatial dimension of 128-way mapping signals. This example is taken from 128 channels of atrial epicardial signals collected synchronously when atrial fibrillation occurs, with a duration of 5 s. Implement the F-correlation of the present invention for each two-way signal, and obtain two corresponding indexes F-C respectively max and F-f max . In this way, F-C max and F-f max The results of the two F correlations form a 128*128 matrix, and the matrix is ​​represented by an image, as shown in Figure 9. Comparative analysis of multiple images at different times or videos composed of multiple continuous images can help analyze and study the occurrence and maintenance mechanism of arrhythmia.


PUM


Abstract

The invention relates to a frequency domain correlation analysis method for cardiac mapping signals. The frequency domain correlation analysis method specifically comprises the following steps: electrocardiosignals are obtained with a cardiac mapping technology; power spectra containing dominant frequency peaks are obtained through preprocessing; the power spectra of two signals are correlated, and a correlation coefficient function with frequency as an independent variable is obtained; the maximum correlation coefficient F-Cmax is analyzed, and the frequency at the maximum value, namely, the maximum correlation frequency Ffmax is obtained. The frequency domain correlation analysis method not only can be applied to time dimension, namely, evaluation of the degree of correlation of signal rhythms in different time periods in the same position, but also can be applied to spatial dimension, namely, evaluation of the degree of correlation of the signal rhythms in different spatial positions in the same time period, can be used for studying correlation characteristics of electrical activity rhythms of myocardia in different positions and different time periods of the heart, can be used for analyzing sinus rhythm signals or arrhythmia signals, has certain application value in electrophysiological mechanism research and clinical medicine, and can be extended to quantitative research of all electrophysiological rhythm signals.

Description

technical field [0001] The invention relates to a frequency domain correlation (F correlation) analysis method of cardiac mapping signals. Background technique [0002] Cardiac mapping technology is a technical method that uses multiple electrode points to collect cardiac electrical signals. At present, the development trend of "large number and high precision" of mapping sites is present, so as to study and analyze the electrical activity of the heart in more detail. By analyzing the changes of each mapping signal during arrhythmia and their correlations and differences, researchers can understand the electrophysiological mechanism of arrhythmia in detail, and find key factors closely related to the triggering and maintenance mechanism of arrhythmia . [0003] Rhythm analysis is an emerging direction of cardiac mapping signal analysis, which aims to study the rhythmic (that is, periodic) state of the cardiomyocyte group corresponding to the mapping signal participating in ...

Claims


Application Information

Patent Timeline
Patent Type & Authority Applications(China)
IPC IPC(8): A61B5/0402A61B5/00
CPCA61B5/7203A61B5/7235A61B5/7246A61B5/7271A61B5/316A61B5/318
Inventor 杨翠微李文海辛毅王彦磊王德玺张轻舟李章俊
Owner FUDAN UNIV
Learn More