Automatic method to delineate or categorize an electrocardiogram

a technology of electrocardiogram and automatic method, which is applied in the field of temporal signal analysis, can solve the problems of slow and expensive interpretation of ecgs, small portion of anomalies that can be easily spotted, and one third of ecgs performed

Active Publication Date: 2017-04-27
KONINKLJIJKE PHILIPS NV
View PDF5 Cites 99 Cited by
  • Summary
  • Abstract
  • Description
  • Claims
  • Application Information

AI Technical Summary

Benefits of technology

[0024]A fully convolutional neural network which first gives a dense prediction of the probability of presence of each wave on each time stamp of the ECG, then post-processes the signal to produce its delineation. This novel approach of the delineation, using convolutional networks, allows the processing of ECGs of any duration, analyzing all types of waves in the same way, without being constrained by their positions.

Problems solved by technology

However, without specific expertise and / or regular training, only a small portion of these anomalies can be easily spotted.
Unfortunately, today, it is estimated that only one third of ECGs are performed in settings where cardiology expertise is readily available.
Their interpretations are of high quality but are slow and expensive to obtain.Prior art automated ECG interpretation softwares, which are mainly developed by ECG device manufacturers.
They provide low quality interpretation (false alarms are very frequent) but deliver them in seconds.
This computation is made very unstable by the use of thresholds.
The approach is also limited as it can neither deal with multiple P waves nor with “hidden” P waves.
This process can however be cumbersome since the feature design is not straightforward, and the model, usually Gaussian, is not well adapted.
Also, none of these works has considered the situation of hidden P waves.
However, they do not reflect the way the cardiologists analyze the ECGs and are crude simplifications.
It is therefore extremely difficult for an algorithm to learn how to discriminate different diseases by simply comparing raw data.
Indeed, these prior arts only limit the classification to an attempt to identify normal ECG versus abnormal ECG, or to perform a beat-to-beat analysis.

Method used


Image

  • Automatic method to delineate or categorize  an electrocardiogram
  • Automatic method to delineate or categorize  an electrocardiogram
  • Automatic method to delineate or categorize  an electrocardiogram

Examples


example 1

for Delineation

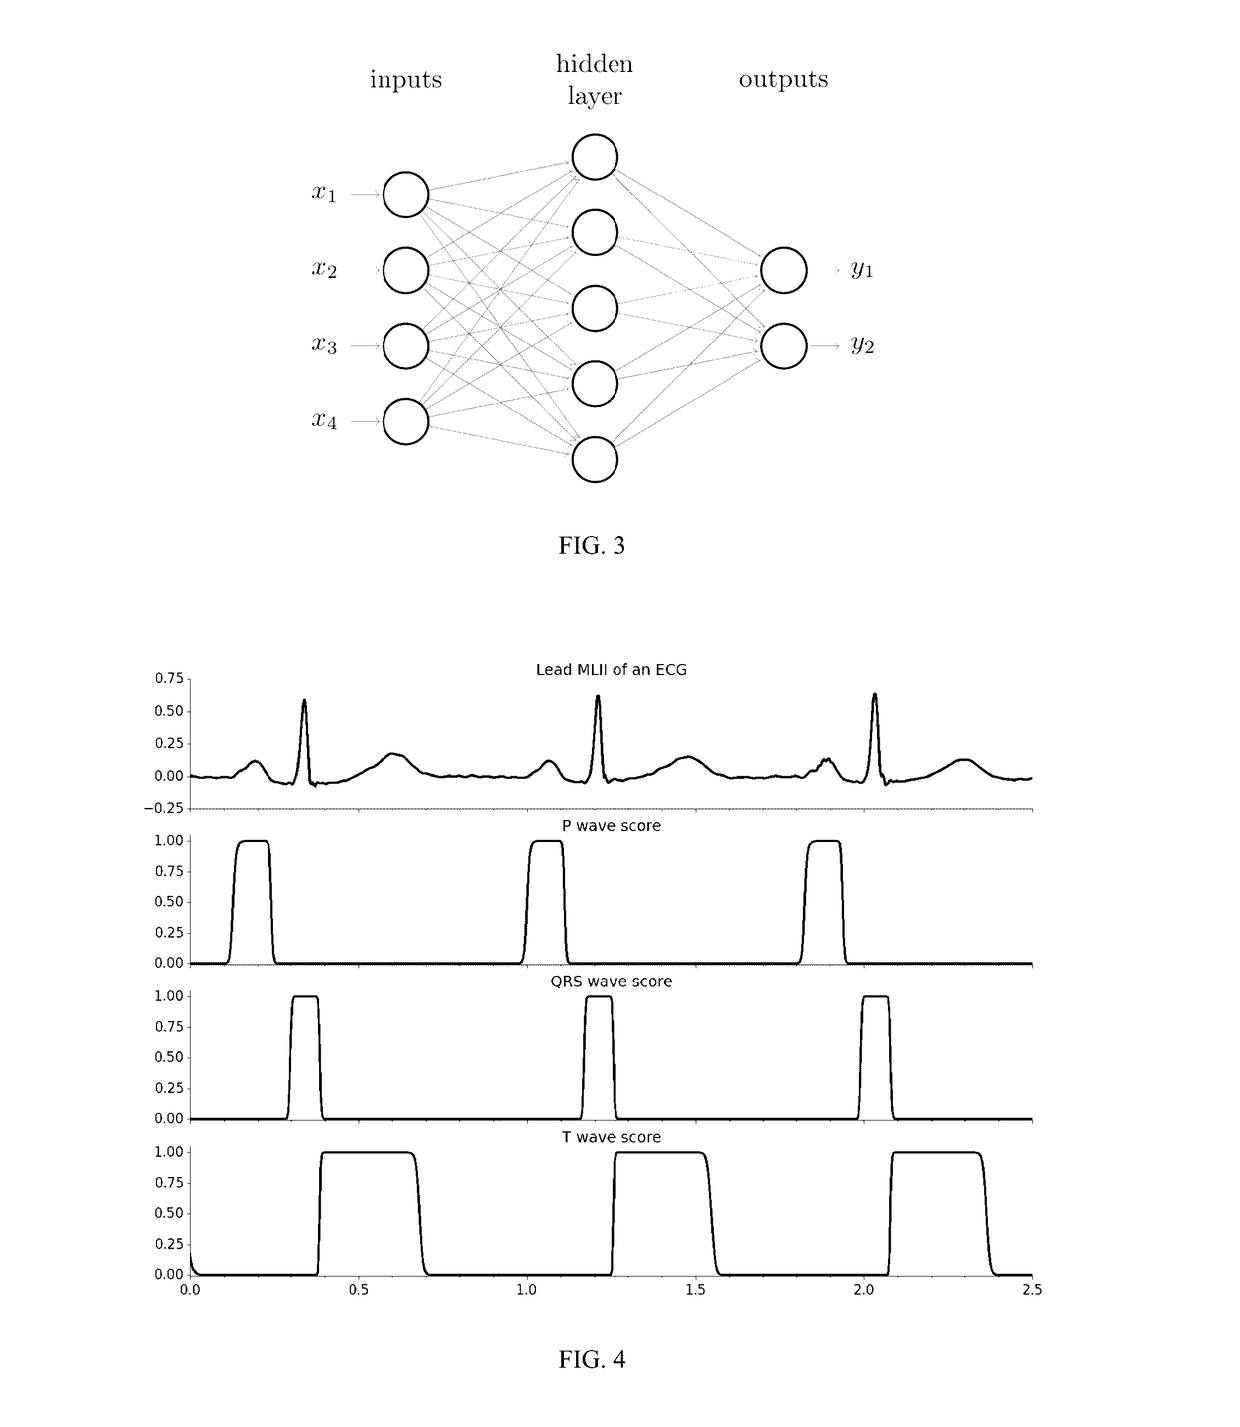
[0104]This training was performed on 630 ECGs and the network evaluated on about 900 beats from 70 different patients which were not used for the training phase. The false positive rate was 0.3% for QRS complexes and T waves detection and their false negative rate was 0.2%. They were respectively 5.4% and 4.2% for P waves. The precision of the wave onsets (beginnings) and offsets (ends) are detailed below:

PointStandard Deviation (ms)Bias (ms)P wave start11.2−1.6P wave end11.2−4.0QRS complex start6.3−2.1QRS complex end3.9−1.1T wave end16.1−4.6

[0105]Compared with state-of-the art algorithms, the precision was improved. In FIG. 5 for instance, the ECG exhibits an atrioventricular block which means that the P waves and the QRS complexes are completely decoupled. In this example, the P waves are regular and QRS complexes happen at random times. One can observe in this example that the algorithm correctly found two P waves between the first QRS complex and the second QRS co...

example 2

for Multi-Label Classification

[0106]A network has been trained using about 85,000 ECGs and has been evaluated on a Dataset including 20,000 patients which were not used in the training phase. For the evaluation purpose, the multi-label classification obtained was simplified to normal (no anomaly) / abnormal if need be. The results in terms of accuracy, specificity and sensitivity were the following:

AccuracySpecificitySensitivity0.910.880.92

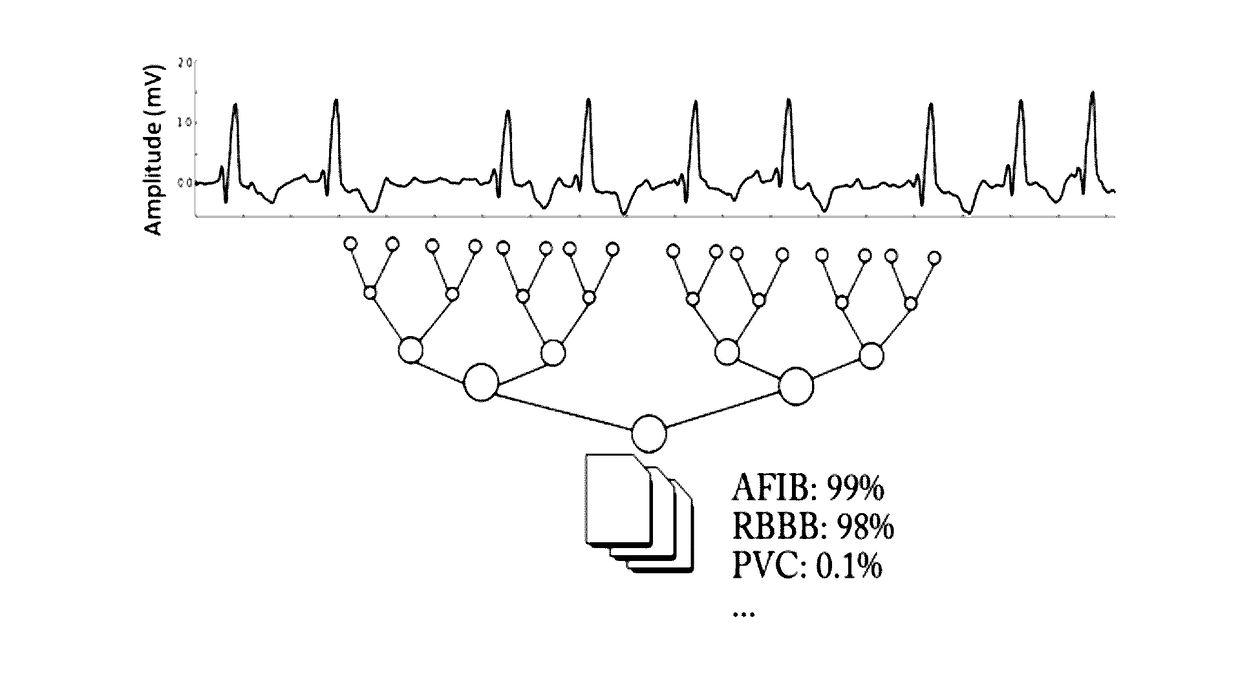
[0107]A graphical representation of how a standard multi-label is used on ECGs is displayed in FIG. 6. The ECG is given as input to the network, which aggregates the information locally and then combines it layer by layer to produce a high-level multi-label classification of the ECG, in this example correctly recognizing atrial fibrillations and a right bundle branch block. Such networks however take a fixed size as input and the process must be reproduced at different locations so as to analyze the whole signal. FIG. 7 is an example of a graphic re...

example 3

[0108]In another embodiment, the applicant combines features described above in examples 1 and 2. Such combination enables to combine the advantages of both networks in a unique network, providing similar results for both the delineations and the multi-label classifications.


PUM


Abstract

A method for computerizing delineation and / or multi-label classification of an ECG signal, includes: applying a neural network to the ECG whereby labelling the ECG, and optionally displaying the labels according to time, optionally with the ECG signal.

Description

FIELD OF INVENTION[0001]The present invention relates to temporal signal analysis, preferably ECG analysis, using at least one neural network.BACKGROUND OF INVENTION[0002]The electrocardiogram (ECG) is a graphic representation of the electrical activity of the heart. It is recorded from the body surface using a number of electrodes placed in specific predefined areas. It is considered as a fundamental tool of clinical practice. It is a simple, non-invasive exam that can be performed by any health professional. Placing the electrodes is not considered as a medical procedure, yet in some countries, the prescription of the ECG by a doctor is essential for it to be performed. The ECG constitutes the first step in cardiovascular diseases (CVD) diagnosis, and is used multiple times throughout the life of a CVD patient. CVD constitute the first global cause of death.[0003]An ECG is composed of multiple temporal signals, called lead signals, such as the standard 12-lead ECG shown in FIG. 1....

Claims


Application Information

Patent Timeline
Patent Type & Authority Applications(United States)
IPC IPC(8): A61B5/04G06F19/00A61B5/00
CPCA61B5/04012G06F19/3431A61B5/7264A61B5/7203A61B5/7267G16H50/30G16H50/20A61B5/349A61B5/316
Inventor RAPIN, JEREMYLI, JIAMASSIAS, MATHURIN
Owner KONINKLJIJKE PHILIPS NV
Why Eureka
Try Eureka