Method of displaying charts in data visualization

A chart and data technology, applied in the field of data processing, can solve problems such as low efficiency

Inactive Publication Date: 2017-05-10
TIANJIN NANKAI UNIV GENERAL DATA TECH
View PDF6 Cites 2 Cited by
  • Summary
  • Abstract
  • Description
  • Claims
  • Application Information

AI Technical Summary

Problems solved by technology

[0003] In the previous method, when the user re-uploads data containing "product" and "sales quantity", if recommending graphics, it is necessary to read the templates one by one to determine whether the columns referenced in the template match the re-uploaded columns. The reference column can be found in the newly uploaded data, so this template can be used, which is less efficient when there are many templates

Method used


Image

  • Method of displaying charts in data visualization
  • Method of displaying charts in data visualization
  • Method of displaying charts in data visualization

Examples


Embodiment Construction

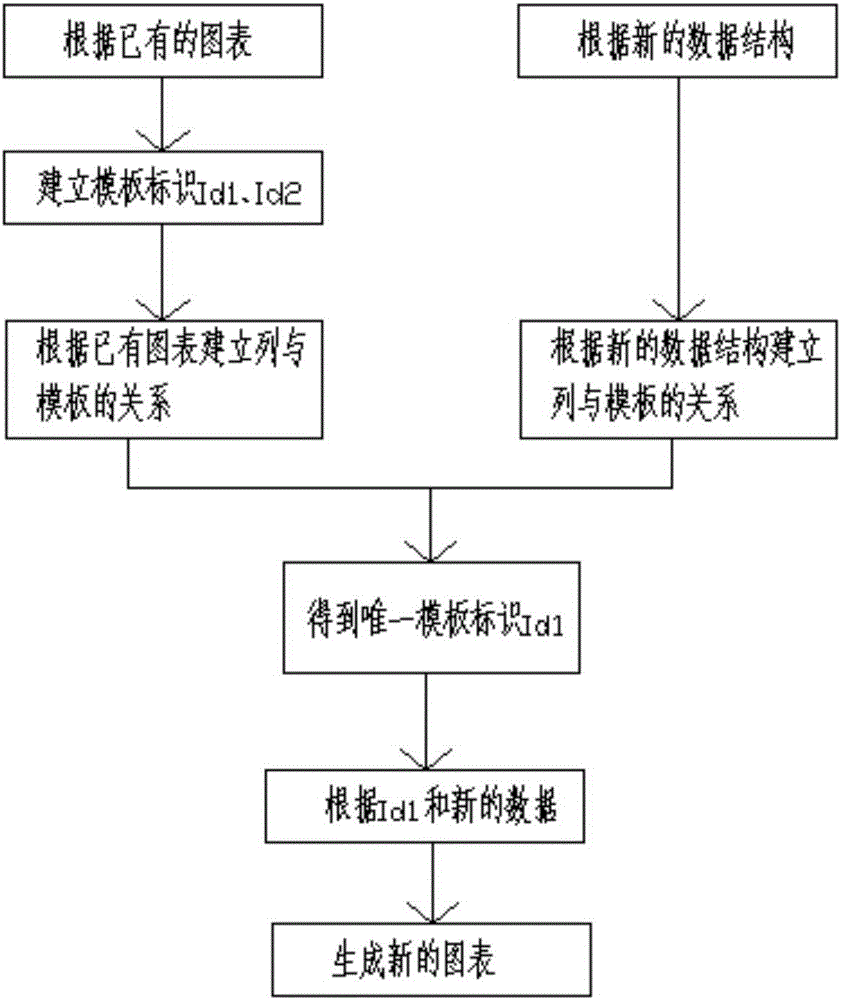
[0023] The technical solution of the present invention is a method for displaying charts in data visualization, and the specific steps are as follows: image 3 as shown,

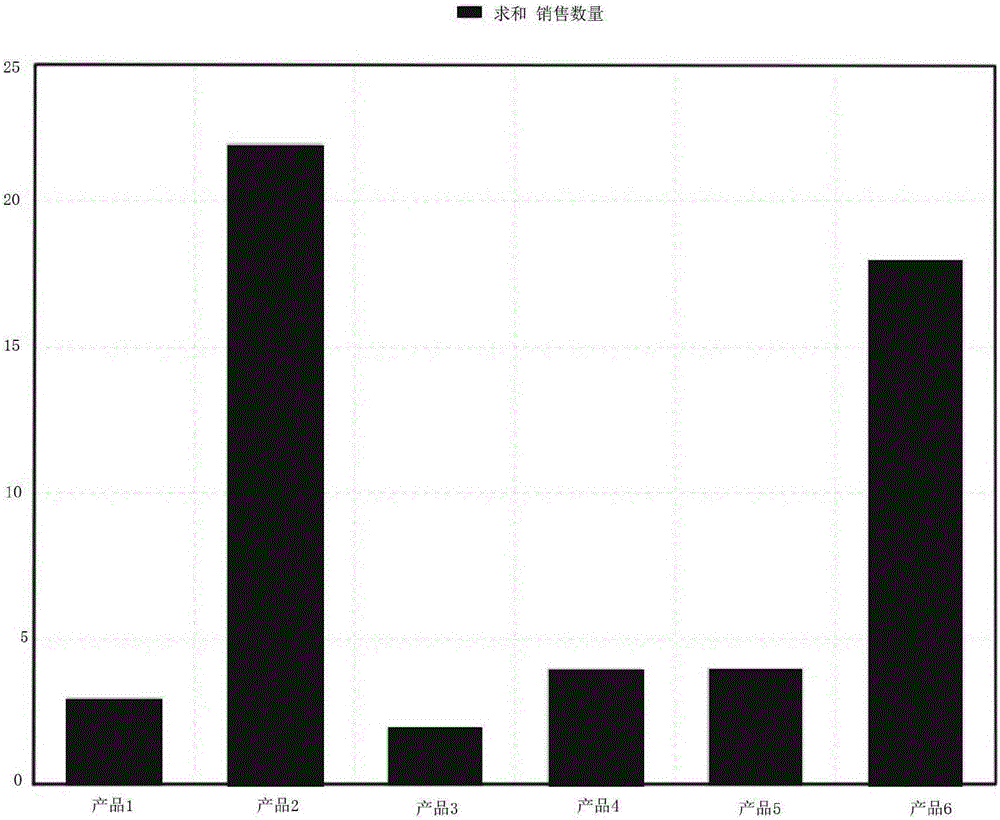
[0024] 1) Create a template, for the background technology figure 2 Create a unique template identifier Id1, and then create an inverted index for the columns referenced by the graph as follows:

[0025] List graphic template product Id1 Sales volume Id1

[0026] Assuming that there is another graphic as a template, its identifier is Id2, and the reference columns are "Sales Quantity" and "Region", then the structure of the template index table is as follows:

[0027] List graphic template product Id1 Sales volume Id1, Id2 area Id2

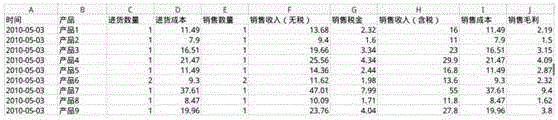
[0028] 2) Select a template according to the new data structure, and use other structured data uploaded by the user, such as Figure 4 As shown, then traverse the data columns, query each column one by one t...


PUM


Abstract

The invention provides a method of displaying charts in data visualization. The method comprises the steps of S1, building templates, building template identification Id1, Id2 for existent graphs, creating inverted index for the referenced columns of the existent graphs, S2, selecting the templates according to the new data structure, for other structured data uploaded by the user, traversing the data columns, querying the templates used in each column one by one to obtain an intermediate temporary structure, calculating the number of times that each template ID appears in the intermediate temporary structure to obtain the final template structures Id1, S3, based on the Id1 template and new data, generating a new chart. The method of displaying charts in data visualization has many advantages.

Description

technical field [0001] The invention belongs to the technical field of data processing, in particular to a method for displaying charts in data visualization. Background technique [0002] In a data visualization system, the general process is that users upload structured data, such as figure 1 What is represented is a graph of Excel data, which can then be done based on this data figure 2 visualization graph from figure 2 As can be seen in , the visual analysis result refers to two columns of data, namely "product" and "sales quantity". [0003] In the previous method, when the user re-uploaded data containing "product" and "sales quantity", if recommending graphics, it is necessary to read the templates one by one to determine whether the columns referenced in the template match the re-uploaded middle columns. If the reference column can be found in the newly uploaded data, then this template can be used. This method is less efficient when there are many templates. ...

Claims


Application Information

Patent Timeline
Patent Type & Authority Applications(China)
IPC IPC(8): G06F17/30
CPCG06F16/2228G06F16/248
Inventor 崔维力赵伟陈磊
Owner TIANJIN NANKAI UNIV GENERAL DATA TECH
Why Eureka
Try Eureka