Supercharge Your Innovation With Domain-Expert AI Agents!

Chart analysis method and device

A chart analysis and chart technology, applied in the field of chart analysis, can solve problems such as heavy development workload, low efficiency of chart analysis and display, and difficult debugging, so as to improve development efficiency, realize diversified display, and reduce complexity.

Inactive Publication Date: 2018-01-30
BEIJING JINGDONG SHANGKE INFORMATION TECH CO LTD +1
View PDF3 Cites 6 Cited by
  • Summary
  • Abstract
  • Description
  • Claims
  • Application Information

AI Technical Summary

Problems solved by technology

That is, in each chart analysis and display, the front-end chart model and the background analysis data need to be customized and developed, lack of back-end tool support, and the development workload is heavy, and debugging is difficult, resulting in low efficiency of chart analysis and display

Method used


Image

  • Chart analysis method and device
  • Chart analysis method and device
  • Chart analysis method and device

Examples


Embodiment Construction

[0022] Exemplary embodiments of the present invention are described below in conjunction with the accompanying drawings, which include various details of the embodiments of the present invention to facilitate understanding, and they should be regarded as exemplary only. Accordingly, those of ordinary skill in the art will recognize that various changes and modifications of the embodiments described herein can be made without departing from the scope and spirit of the invention. Also, descriptions of well-known functions and constructions are omitted in the following description for clarity and conciseness.

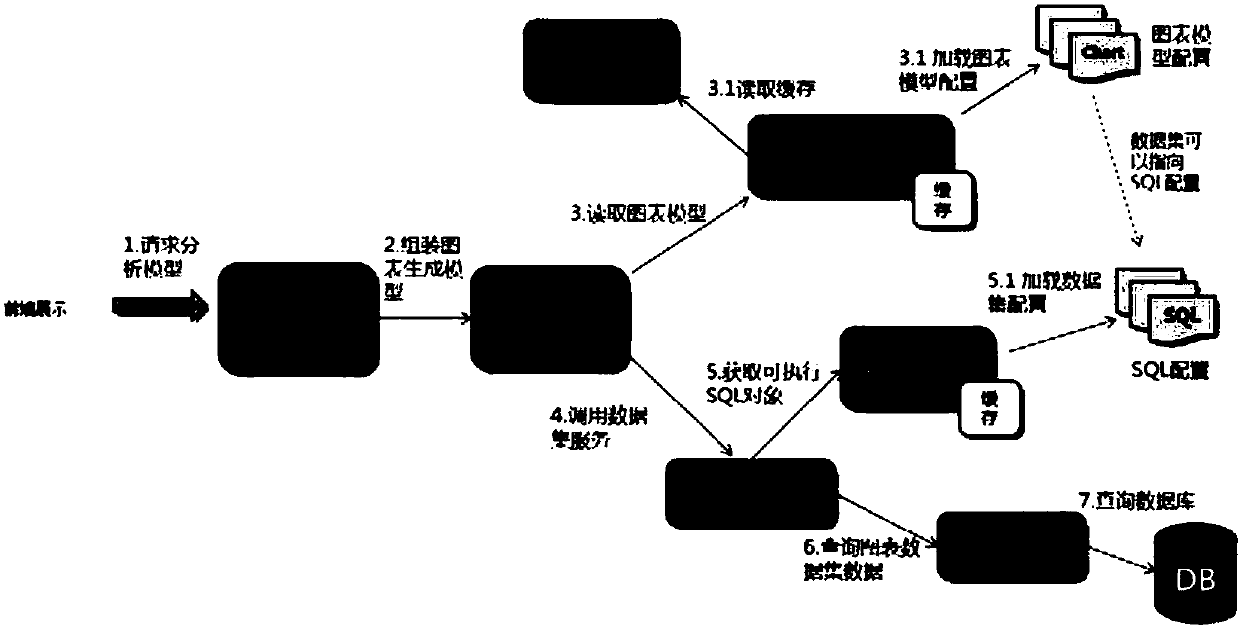
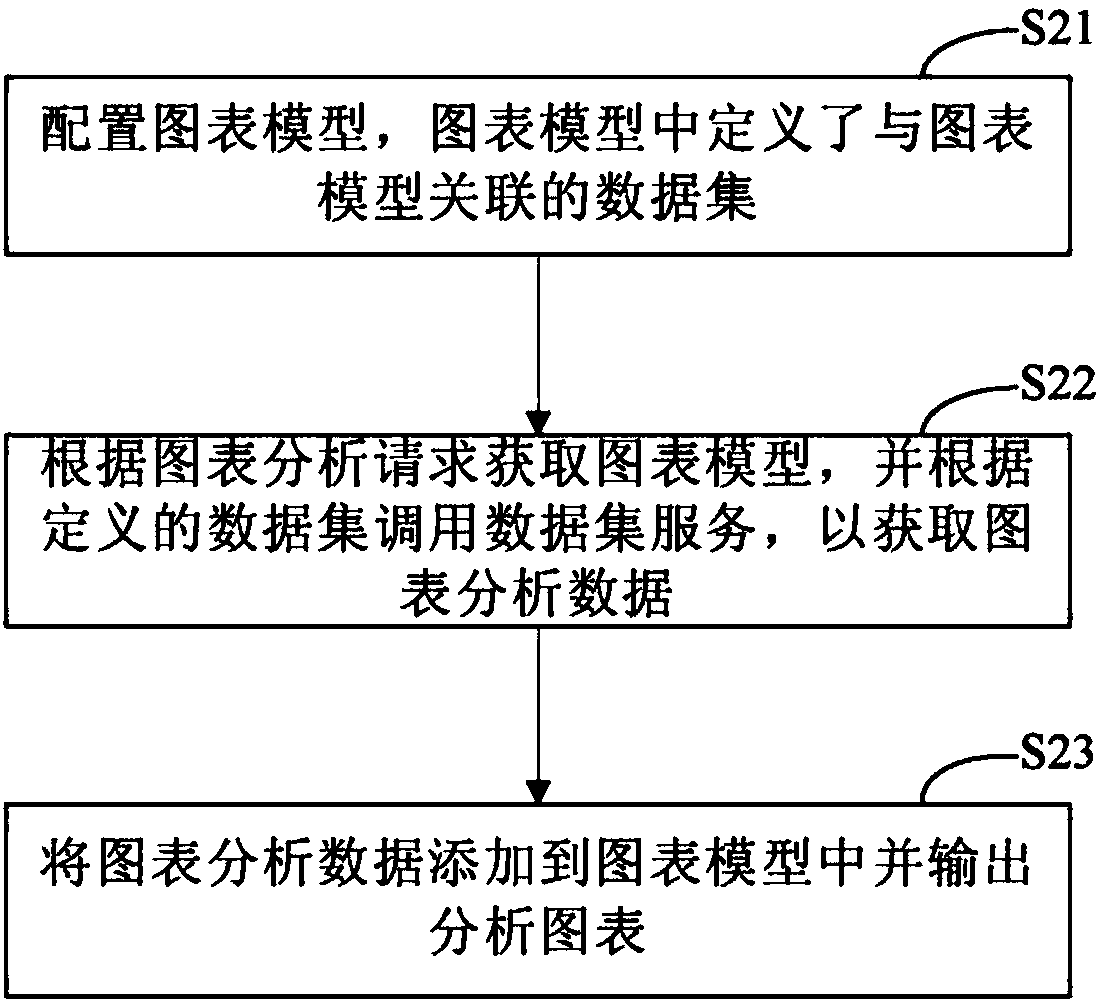
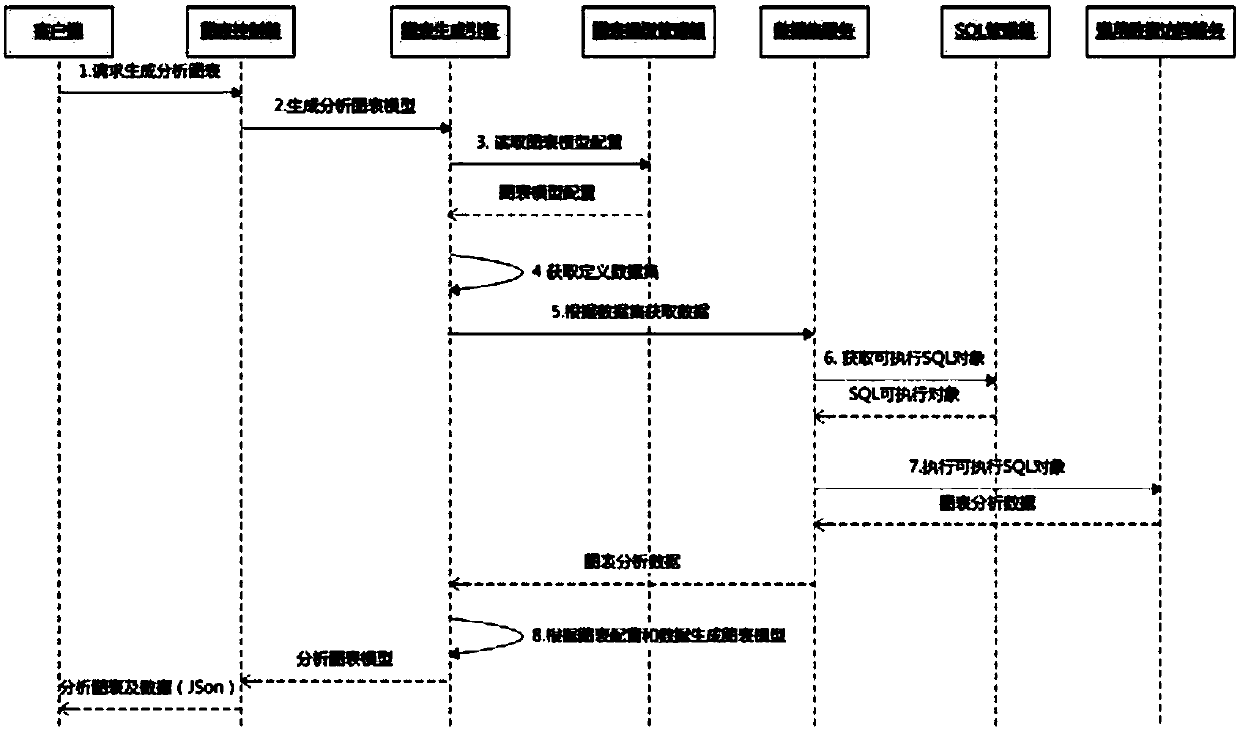
[0023] The graph analysis and display function requires a lot of development work in each project. A configurable graph analysis lightweight engine can greatly improve development efficiency and high reusability.

[0024] In the graphic analysis method of the present invention, the open source Highcharts is used for the front-end display, and Spring plus Hibernate is used ...


PUM


Abstract

The invention provides a chart analysis method and device. Through the chart analysis method and device, the complexity of graphical chart analysis can be lowered, learning and usage are easy, the development efficiency of a project is improved, development cost is saved, and meanwhile maintenance cost is lowered. The method comprises the steps of configuring a chart model, wherein a dataset associated with the chart model is defined in the chart model; the chart model is acquired according to a chart analysis request, and a dataset service is called according to the defined dataset to acquirechart analysis data; and the chart analysis data is added into the chart model, and an analysis chart is output.

Description

technical field [0001] The invention relates to the field of computer technology and software, in particular to a method and device for chart analysis. Background technique [0002] The graph analysis display function requires a large amount of development work in each project. At present, many front-end chart display frameworks, such as Highchart, Echarts, etc., need to be developed manually. That is, in each chart analysis and display, the front-end chart model and the background analysis data need to be customized and developed, lacking the support of back-end tools, and the development workload is heavy, and debugging is difficult, resulting in low efficiency of chart analysis and display. Contents of the invention [0003] In view of this, the present invention provides a method and device for chart analysis, which can reduce the complexity of graphical chart analysis, be easy to learn and use, improve project development efficiency, save development costs, and also ...

Claims


Application Information

Patent Timeline
IPC IPC(8): G06F8/20
Inventor 陈克林
Owner BEIJING JINGDONG SHANGKE INFORMATION TECH CO LTD
Features
  • R&D
  • Intellectual Property
  • Life Sciences
  • Materials
  • Tech Scout
  • Unparalleled Data Quality
  • Higher Quality Content
  • 60% Fewer Hallucinations
Learn More