
A Calculation Method of Side-Level Visual Confusion Degree Index for Quantitative Evaluation of MSV

A technology of quantitative evaluation and index calculation, applied in other database retrieval, website content management, network data retrieval and other directions, can solve the problems of introducing edge intersection and rarely considering dynamic graph sampling.

Active Publication Date: 2021-11-26
CENT SOUTH UNIV
View PDF0 Cites 0 Cited by
  • Summary
  • Abstract
  • Description
  • Claims
  • Application Information

AI Technical Summary

Problems solved by technology

[0004] In order to solve the problem, most of the existing edge sampling technologies consider static graph sampling, and few algorithms consider dynamic graph sampling.
Moreover, none of the existing MSV improvement technologies is done by sampling, and the improved results will introduce new defects (such as the introduction of edge crossing, etc.)

Method used


Image

  • A Calculation Method of Side-Level Visual Confusion Degree Index for Quantitative Evaluation of MSV
  • A Calculation Method of Side-Level Visual Confusion Degree Index for Quantitative Evaluation of MSV
  • A Calculation Method of Side-Level Visual Confusion Degree Index for Quantitative Evaluation of MSV

Examples


Embodiment Construction

[0032] In order to make the purpose, design ideas and advantages of the present invention clearer, the present invention will be further described in detail below in combination with specific examples and with reference to the accompanying drawings.

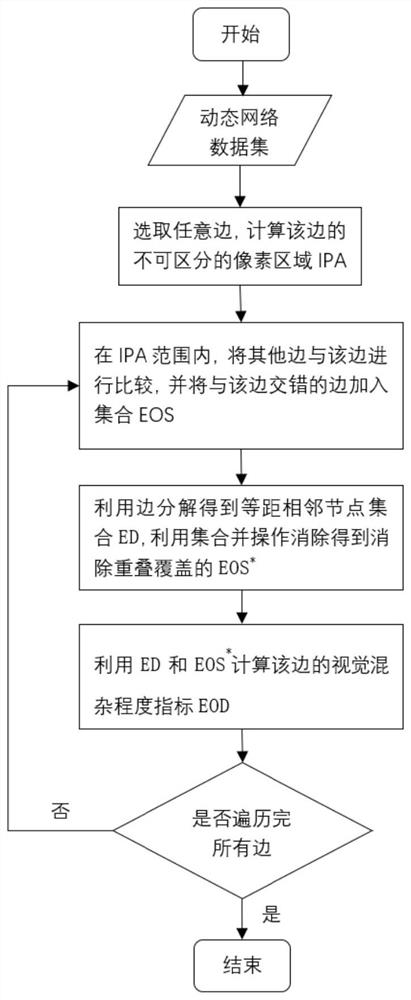
[0033] The present invention provides a quantitative evaluation of MSV's side-level visual confusion index, such as figure 1 As shown, it includes the following four main steps:

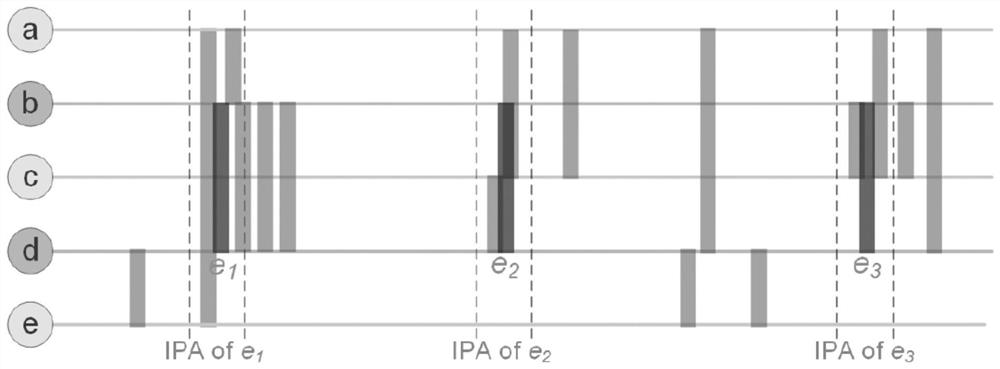
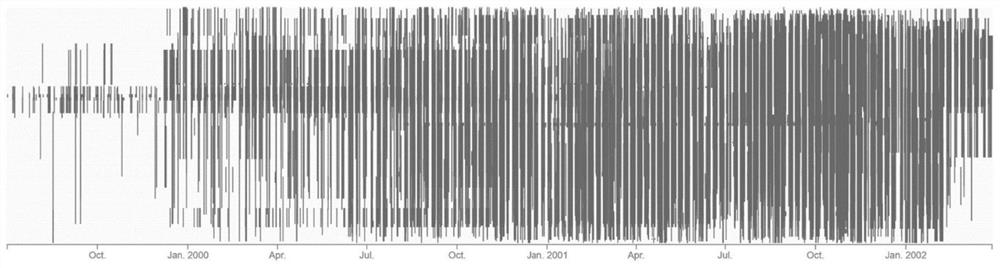
[0034] Step 1): Get dynamic network data, figure 2 The illustrated example is a dynamic network data containing 5 nodes and 19 edges; image 3 , 4 The dynamic network data of the actual application case shown is the communication emails between 150 employees from 1999 to 2002 provided by Enron. The data is 24705 communication records of 150 employees during this period. That is, there are 150 nodes and 24705 edges in the dynamic network. According to the definition of the flow model, the dynamic network is described as a directed graph G=(V, E), V ...


PUM


Abstract

The invention discloses a calculation method for quantitatively evaluating the edge-level visual confusion index of MSV, which comprises the following steps: 1) Obtain any edge e in MSV, and calculate its indistinguishable pixel distance value IPD, from the center of edge e The position expands the width of the IPD to the left and right directions respectively to form an indistinguishable pixel area IPA; 2) Add the edges interlaced with the edge e in the IPA to the set of interlaced edges; 3) Decompose the set of interlaced edges according to the order of nodes to obtain several equal 4) Calculate the visual confusion index of edge e according to the staggered edge set and node pair set that eliminate coverage. The invention quantitatively evaluates the degree of visual confusion of edges in MSV, which helps to provide a reliable basis for subsequent edge sampling work, and further helps to reduce the degree of visual confusion in MSV and improve its readability.

Description

technical field [0001] The invention relates to the field of visual optimization of large-scale sequence view (MSV) in dynamic network visualization, in particular to a calculation method for quantitatively evaluating the edge-level visual confusion index of MSV. Background technique [0002] Network (Network) is also called graph (Graph). Generally, all entities with relationships can be abstracted into a network (graph), that is, entities are abstracted into nodes, and the relationship between entities is abstracted into edges. According to whether the network will change over time, it can be divided into static network and dynamic network. [0003] The dynamic network is mainly used to represent the change of nodes in the network and the relationship between nodes with time. In order to efficiently and intuitively help people understand the behavior information of time-varying networks, a common practice is to implement visual mapping and layout design that meet aestheti...

Claims


Application Information

Patent Timeline
Patent Type & Authority Patents(China)
IPC IPC(8): G06F16/958
Inventor 赵颖蒋昊瑾佘燕敏陈文江刘家玮周芳芳
Owner CENT SOUTH UNIV
Learn More