Trend diagram generation method and device based on big data storage medium and apparatus

A trend chart and big data technology, applied in the computer field, can solve problems such as low user experience satisfaction, inability to meet users' needs for personalized analysis of trend charts, and inability to clearly and intuitively reflect the rise and fall of financial products. The effect of improving experience satisfaction

Pending Publication Date: 2019-02-22
CHINA PING AN LIFE INSURANCE CO LTD
View PDF0 Cites 2 Cited by
  • Summary
  • Abstract
  • Description
  • Claims
  • Application Information

AI Technical Summary

Problems solved by technology

[0003] At present, the trend chart provided by the financial product display platform has a fixed trend observation time interval. When users understand the trend chart of the rise and fall of financial products, they can only see the rise and fall of financial products within each time interval set by the platform. For example, the trend of ups and downs in the past mo

Method used


Image

  • Trend diagram generation method and device based on big data storage medium and apparatus
  • Trend diagram generation method and device based on big data storage medium and apparatus
  • Trend diagram generation method and device based on big data storage medium and apparatus

Examples


Embodiment 1

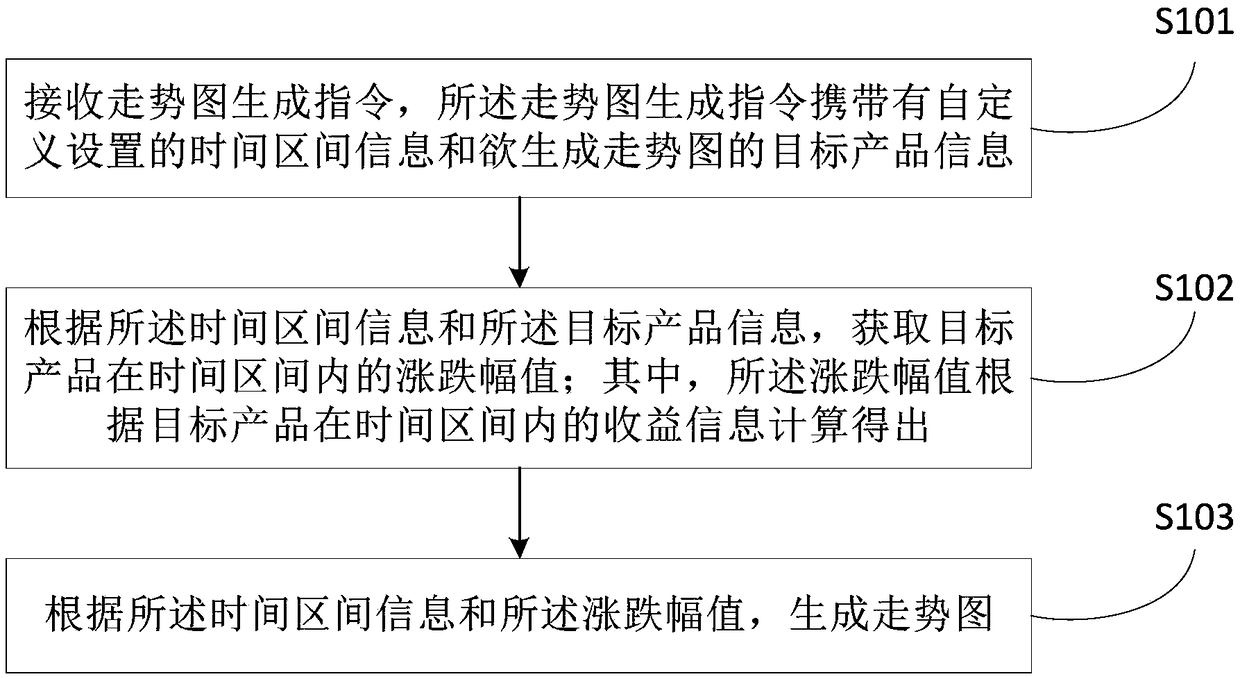
[0066] The embodiment of the present invention provides a method for generating trend charts based on big data, such as figure 1 As shown, the method includes:

[0067] Step S101: Receive a trend chart generation instruction, the trend chart generation command carries custom-set time interval information and target product information for which the trend chart is to be generated.

[0068] For this embodiment, the trend chart generation instruction sent by the user is received, the trend chart generation command carries the time interval information set by the user or customized by the current platform, and the trend chart generation command also carries the user's The product information of the target product to generate the trend chart. Among them, the user can send the trend chart generation command in a variety of ways, for example, the user can select the time interval of the trend chart on the information page of the target product to generate the trend chart, and send t...

Embodiment 2

[0080] Another possible implementation of the embodiment of the present invention, on the basis of the first embodiment, further includes the steps shown in the second embodiment, wherein,

[0081] The time interval information includes start time and end time, and the income information is unit net value;

[0082] The value of the increase and decrease is calculated by the following formula:

[0083]

[0084] Among them, n represents the number of days between the end time and the start time, and n is a natural integer; D k It is the rise and fall value of the day k days from the start time, T k is the unit net value of k days from the start time, T 0 It is the net value of the unit on the starting date.

[0085] For this embodiment, in the actual application scenario in the field of financial investment, the unit net value can more accurately reflect the real value of financial products, so in this embodiment, the income information is the unit net value, and the incre...

Embodiment 3

[0089] Another possible implementation of the embodiment of the present invention, on the basis of the first embodiment, further includes the steps shown in the third embodiment, wherein,

[0090] The time interval information is customized by the following steps: acquiring user behavior data related to its investment business; generating the time interval information according to the behavior data.

[0091]For this embodiment, the platform currently used to generate trend charts can set any time node as the default parameter corresponding to the start time and end time in the time interval information, and the time interval information is based on the user's investment business-related Behavioral data is automatically generated.

[0092] For this embodiment, the behavior data related to the user's investment business includes, but is not limited to: the user's transaction behavior for financial products on the platform, the user's search and browsing behavior for financial pr...


PUM


Abstract

The invention provides a trend diagram generation method based on big data. The method comprises the following steps: receiving a trend diagram generation instruction, wherein the trend diagram generation instruction carries user-defined time interval information and target product information of the trend diagram to be generated; According to the time interval information and the target product information, obtaining the fluctuation amplitude value of the target product in the time interval, wherein, the rise and fall amplitude is calculated according to the income information of the target product in the time interval; generating a trend map according to the time interval information and the fluctuation amplitude value. The trend map generation method based on big data provided by the invention can generate a trend map which effectively reflects the rise and fall of the target product in any time interval according to the mass data in the financial data resources, and can satisfy thepersonalized analysis demand of the trend map of the user, and remarkably improve the experience satisfaction of the user.

Description

technical field [0001] The present invention relates to the field of computer technology, in particular, the present invention relates to a big data-based trend chart generation method, device, computer-readable storage medium and computer equipment. Background technique [0002] There are a large number of financial products in the existing market, such as stocks, funds, etc. Before trading financial products, users often understand and analyze the financial products they care about to judge whether the benefits and risks of the products meet their own expectations. Therefore, the trend chart used to reflect the rise and fall of financial products plays a vital role in the user's analysis of the product. [0003] At present, the trend chart provided by the financial product display platform has a fixed trend observation time interval. When users understand the trend chart of the rise and fall of financial products, they can only see the rise and fall of financial products w...

Claims


Application Information

Patent Timeline
IPC IPC(8): G06Q40/06G09B29/00
CPCG06Q40/06G09B29/00
Inventor 胡雨佳
Owner CHINA PING AN LIFE INSURANCE CO LTD
Why Eureka
Try Eureka