
A bus line network density calculation method based on optimal bus average station spacing

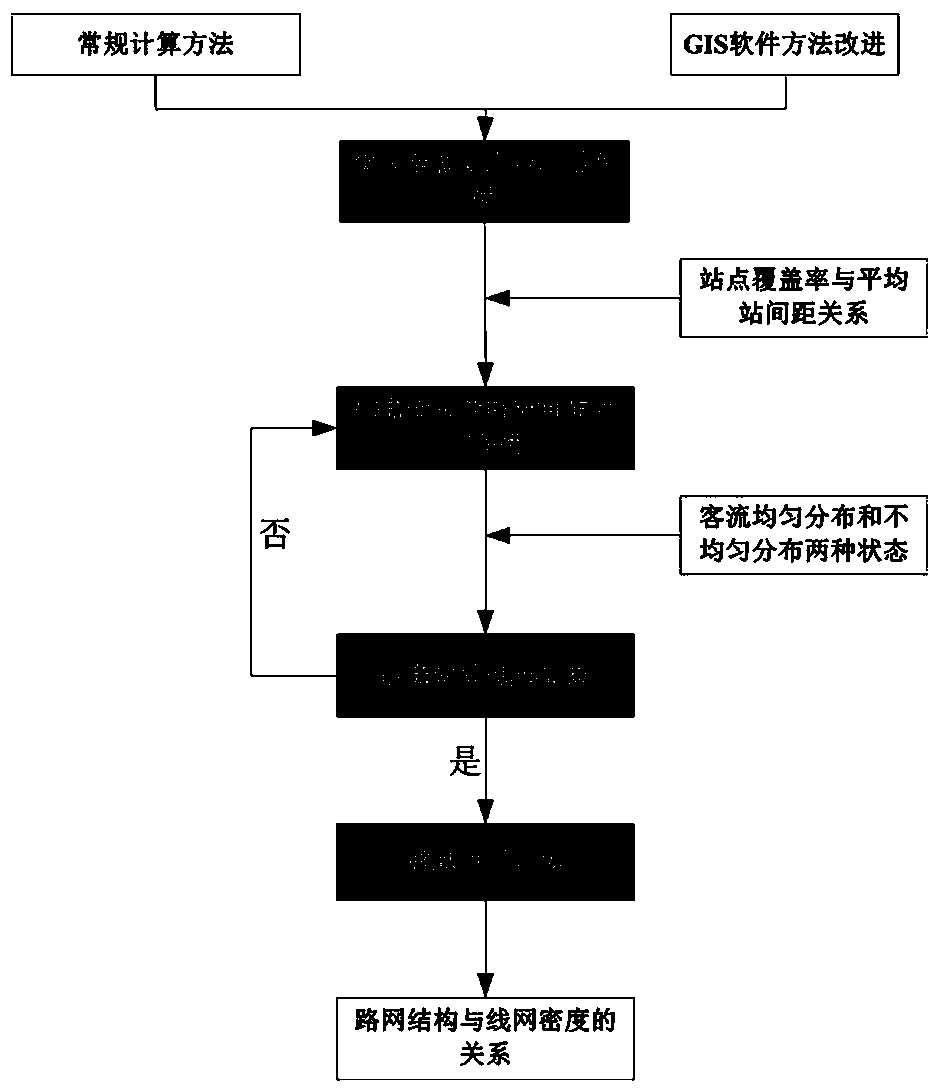
A technology of bus line network and calculation method, which is applied in the direction of calculation, instrument, data processing application, etc., can solve the problem of increased difficulty of calculation, and achieve the effect of improving the layout method

Pending Publication Date: 2019-03-29
SHANGHAI MUNICIPAL ENG DESIGN INST GRP
View PDF3 Cites 6 Cited by
  • Summary
  • Abstract
  • Description
  • Claims
  • Application Information

AI Technical Summary

Problems solved by technology

But in actual projects, the problems encountered are far more than ideal
First of all, the area summation is not the algebraic sum of all covered areas, but the area after geometric combination; the part of the covered area exceeding the built-up area should also be deducted; the covered area is easy to form irregular polygons, and the calculation difficulty is increased

Method used


Image

  • A bus line network density calculation method based on optimal bus average station spacing
  • A bus line network density calculation method based on optimal bus average station spacing
  • A bus line network density calculation method based on optimal bus average station spacing

Examples


Embodiment Construction

[0033] The present invention will be described in detail below according to specific embodiments of the present invention.

[0034] The present invention provides a method for calculating the bus network density based on the optimal bus average station spacing, and calculates the optimal bus network density by step-by-step deduction of three indicators such as site coverage, average station spacing, and line network density. Calculated formula. To study the relationship between the station coverage rate and the average station spacing under different conditions, the planning of channel site coverage requires a reasonable interval value for the average station spacing. By analyzing the influence of different line lengths and different average ride distances on the optimal average station spacing, the optimal average station spacing is obtained. Based on the minimum travel time of passengers, the optimal bus network density is calculated.

[0035] 1. Coverage of bus stops

[...


PUM


Abstract

The invention provides a bus line network density calculation method based on optimal bus average station spacing. The GIS software is used to optimize the calculation method of bus stop coverage, Then, the relationship between the average station spacing and the site coverage of public transport network is found, and the formula for calculating the optimal average station spacing is deduced. Based on the study of the site coverage and the average station spacing, the calculation method of bus network density is optimized. Finally, the relationship between the structure of road network and thedensity of bus network is clarified. This patent can optimize, guide the evaluation index of bus network, promote and improve the layout method of bus network.

Description

technical field [0001] The invention is applicable to the field of traffic planning, and relates to a method for calculating the density of a bus line network based on the optimal average bus stop distance. Background technique [0002] In recent years, as urban traffic congestion has become more and more serious, public transportation has been paid more and more attention. The implementation of public transportation planning and the guidance and scientificity of public transportation network planning and layout are particularly important. [0003] The key indicators of the bus network, such as the coverage of bus stops, the average distance between stations, and the density of the bus network, need to be further improved due to the long implementation period of the current national regulations. [0004] The coverage rate of bus stops is an important indicator to measure the overall development level of public transport and the convenience of travel. The coverage rate of bu...

Claims


Application Information

Patent Timeline
IPC IPC(8): G06Q10/04G06Q10/06G06Q50/26
CPCG06Q10/047G06Q10/06393G06Q50/26
Inventor 高克林王重元
Owner SHANGHAI MUNICIPAL ENG DESIGN INST GRP
Learn More