Data display chart processing method and device, equipment and medium
A data display and processing method technology, applied in the field of data processing, can solve problems such as the inability to explain the relationship between indicators and the difficulty in observing the impact factors of indicators, and achieve the effect of improving the practicability of information
- Summary
- Abstract
- Description
- Claims
- Application Information
AI Technical Summary
Problems solved by technology
Method used
Image
Examples
Embodiment 1
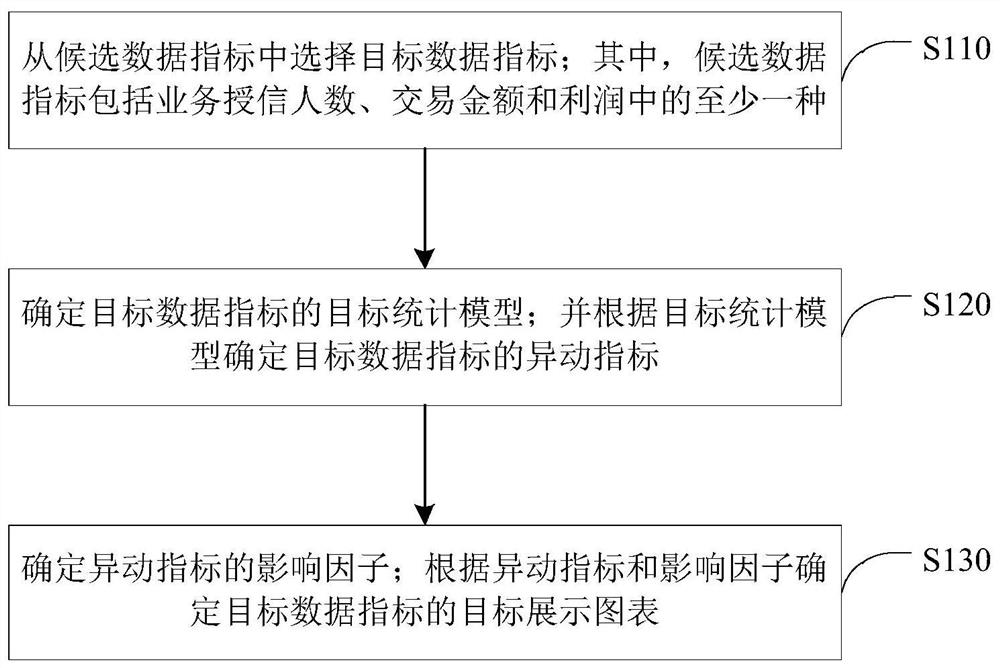
[0059] figure 1 It is a schematic flowchart of the processing method of the data display chart in the first embodiment of the present invention. This embodiment is applicable to the situation of determining the presentation chart of the service data. The method of this embodiment can be executed by a processing device for displaying data charts, which can be implemented in hardware / or software, and can be configured in electronic equipment. The method for processing the data display chart described in any embodiment of the present application can be realized. Such as figure 1 As shown, the method specifically includes the following:
[0060] S110. Select a target data indicator from candidate data indicators; wherein, the candidate data indicators include at least one of the number of business credits, transaction amount, and profit.
[0061] In this embodiment, the candidate data indicator can be the identification information set by the enterprise system to measure busines...
Embodiment 2
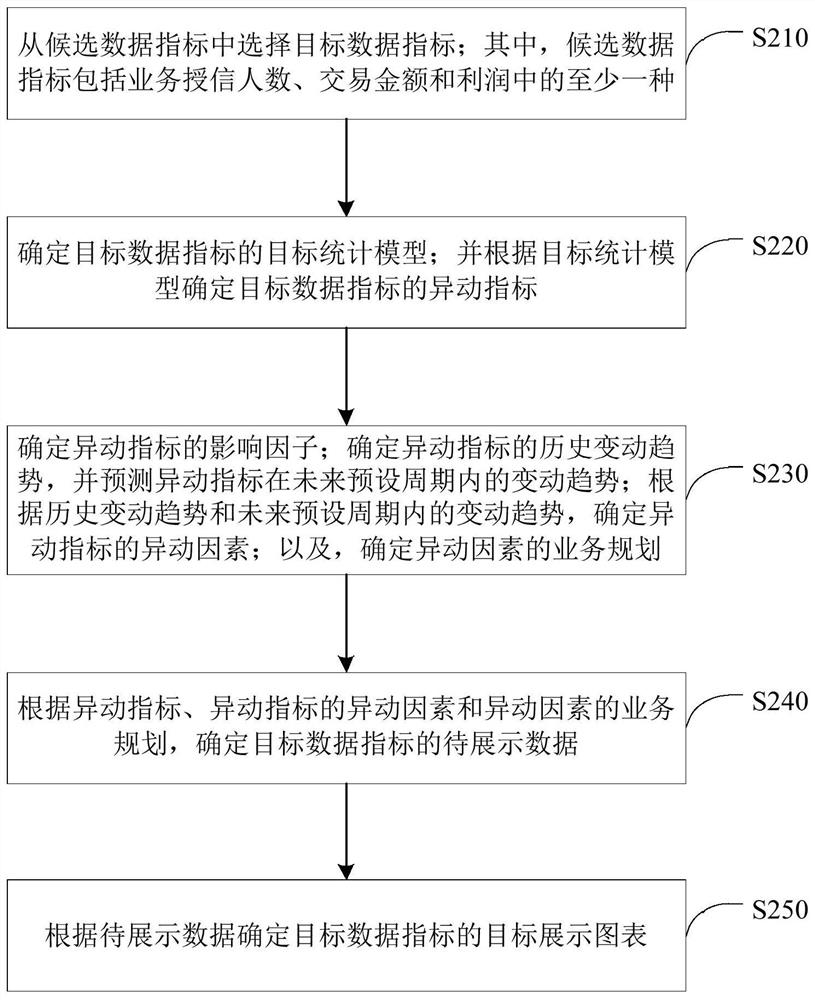
[0071] figure 2 It is a schematic flowchart of the processing method of the data display chart in the second embodiment of the present invention. This embodiment is further expanded and optimized on the basis of the above embodiments, and can be combined with any optional solution in the above technical solutions. Such as figure 2 As shown, the method includes:
[0072] S210. Select a target data index from candidate data indexes; wherein, the candidate data indexes include at least one of the number of business credit persons, transaction amount, and profit.
[0073] S220. Determine the target statistical model of the target data index; and determine the change index of the target data index according to the target statistical model.
[0074] In this embodiment, optionally, determining the target statistical model of the target data indicator includes:
[0075] Determine the type of the target data indicator;
[0076] According to the type of the target data indicator,...
Embodiment 3
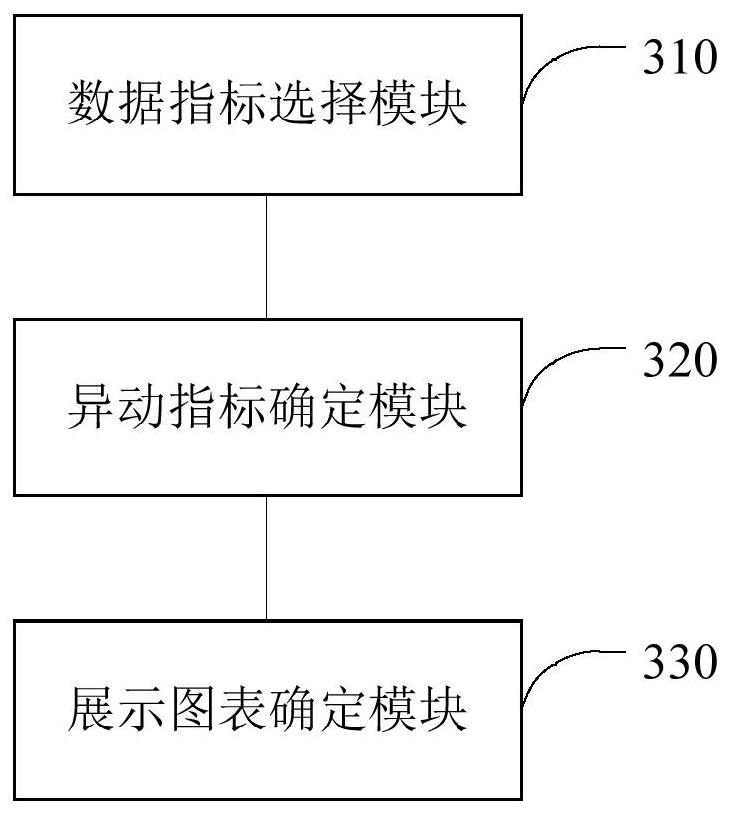
[0097] image 3 It is a schematic structural diagram of a processing device for a data display chart in Embodiment 3 of the present invention. This embodiment is applicable to the case of determining a display chart of business data. The device is configured in an electronic device, and can realize the processing method for a data display chart described in any embodiment of the present application. The device specifically includes the following:
[0098] A data indicator selection module 310, configured to select a target data indicator from candidate data indicators; wherein, the candidate data indicators include at least one of business credit number, transaction amount and profit;
[0099] The transaction index determination module 320 is configured to determine the target statistical model of the target data index; and determine the transaction index of the target data index according to the target statistical model;
[0100] The display chart determination module 330 i...
PUM
 Abstract
Description
Claims
Application Information
 - R&D
- Intellectual Property
- Life Sciences
- Materials
- Tech Scout
- Unparalleled Data Quality
- Higher Quality Content
- 60% Fewer Hallucinations
Browse by: Latest US Patents, China's latest patents, Technical Efficacy Thesaurus, Application Domain, Technology Topic, Popular Technical Reports.
© 2025 PatSnap. All rights reserved.Legal|Privacy policy|Modern Slavery Act Transparency Statement|Sitemap|About US| Contact US: help@patsnap.com


