Multi-dimensional representation of financial data

a financial data and multi-dimensional technology, applied in the field of multi-dimensional representation of financial data, can solve the problems of beyond the practical use of the investing public, prior art, while useful to a highly trained professional trader, appears to be beyond the practical use of the general trading publi

Inactive Publication Date: 2002-12-19
ERDMIER LISA M
View PDF14 Cites 120 Cited by
  • Summary
  • Abstract
  • Description
  • Claims
  • Application Information

AI Technical Summary

Problems solved by technology

Such a display, though useful to a professional trader, are beyond the practical use of the investing public.
In sum, these prior

Method used


Image

  • Multi-dimensional representation of financial data
  • Multi-dimensional representation of financial data
  • Multi-dimensional representation of financial data

Examples


Embodiment Construction

of My Invention

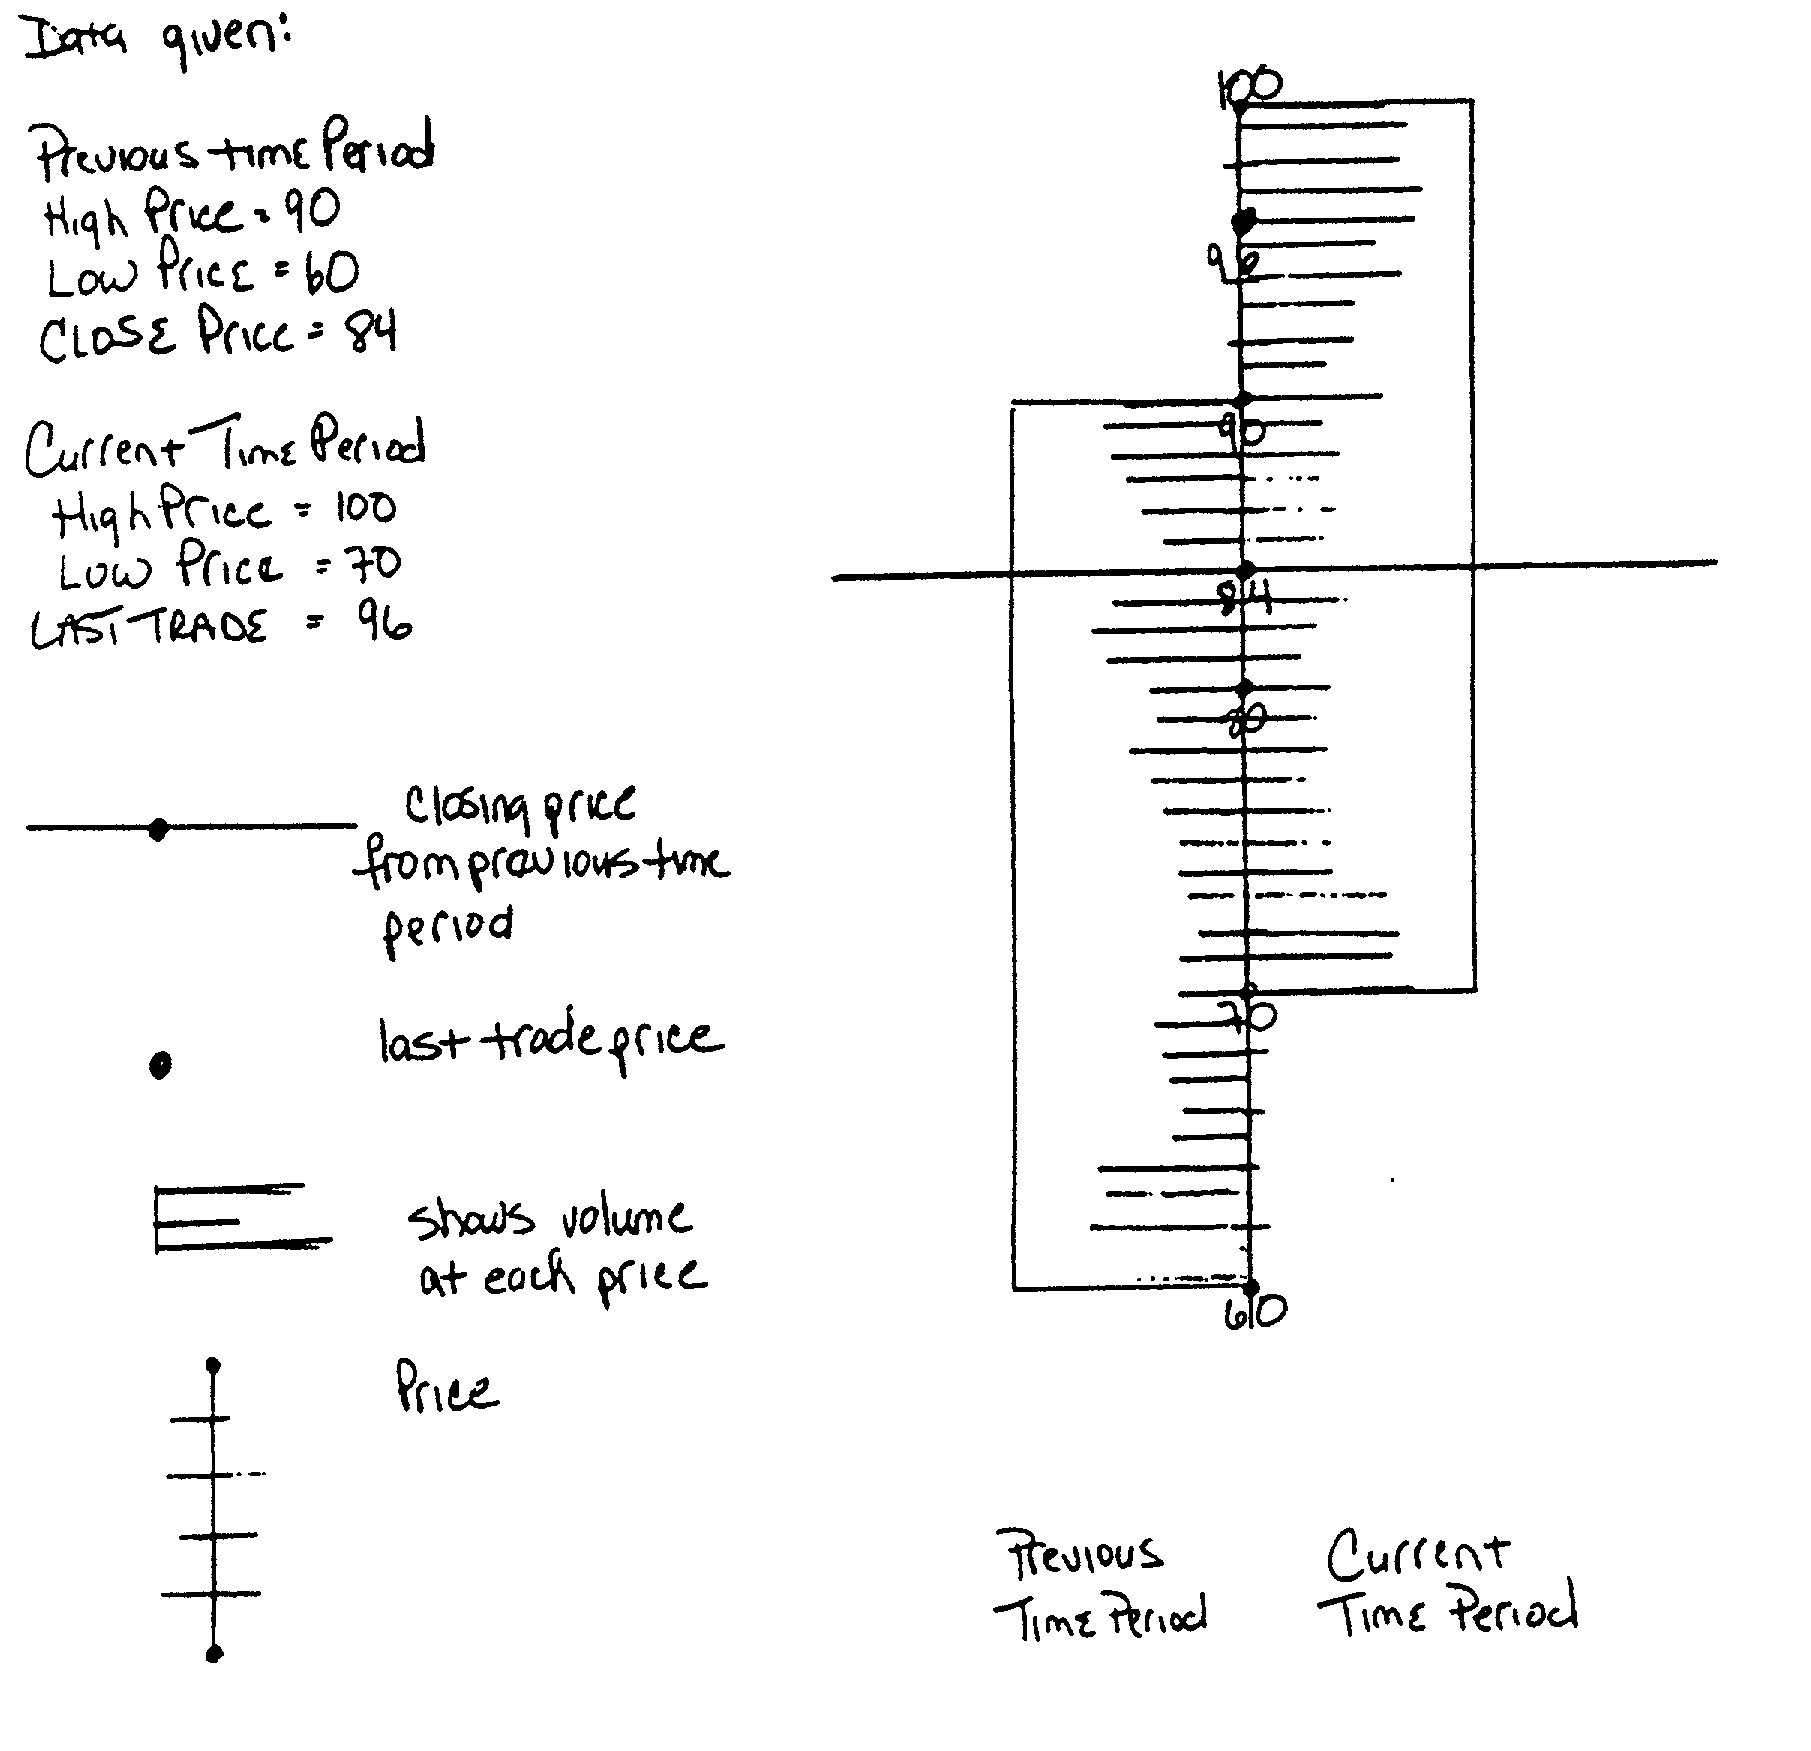
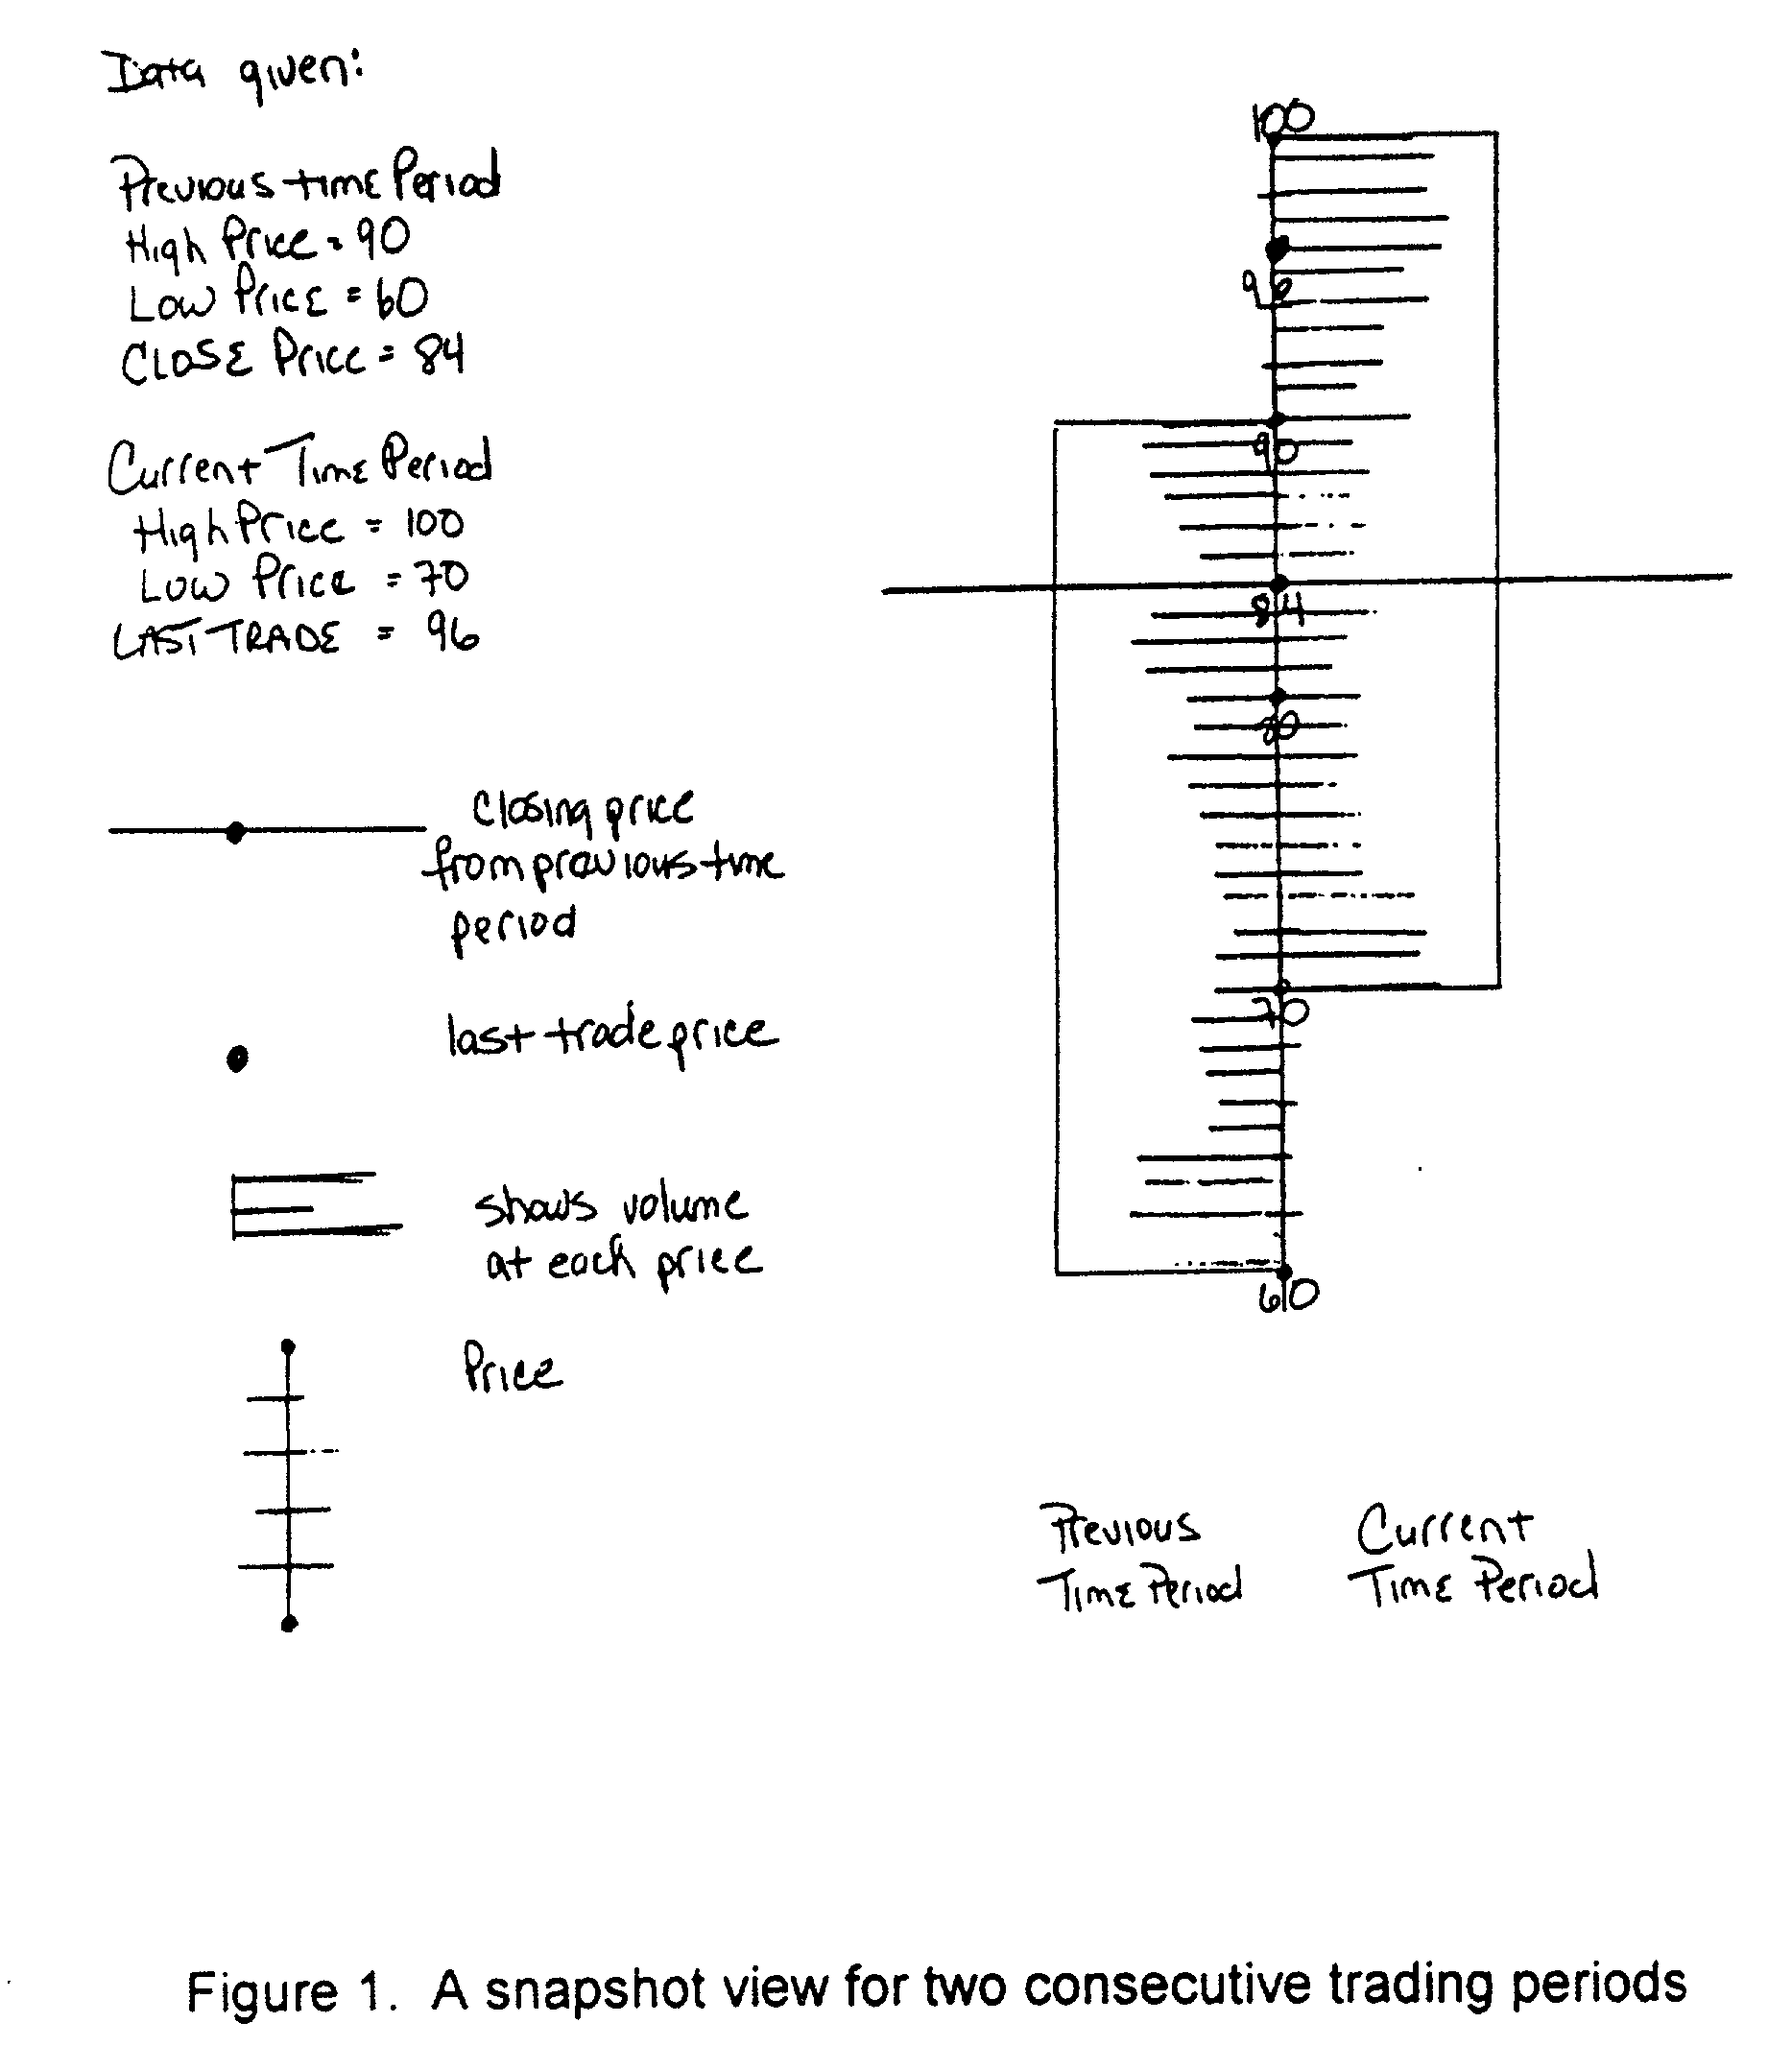
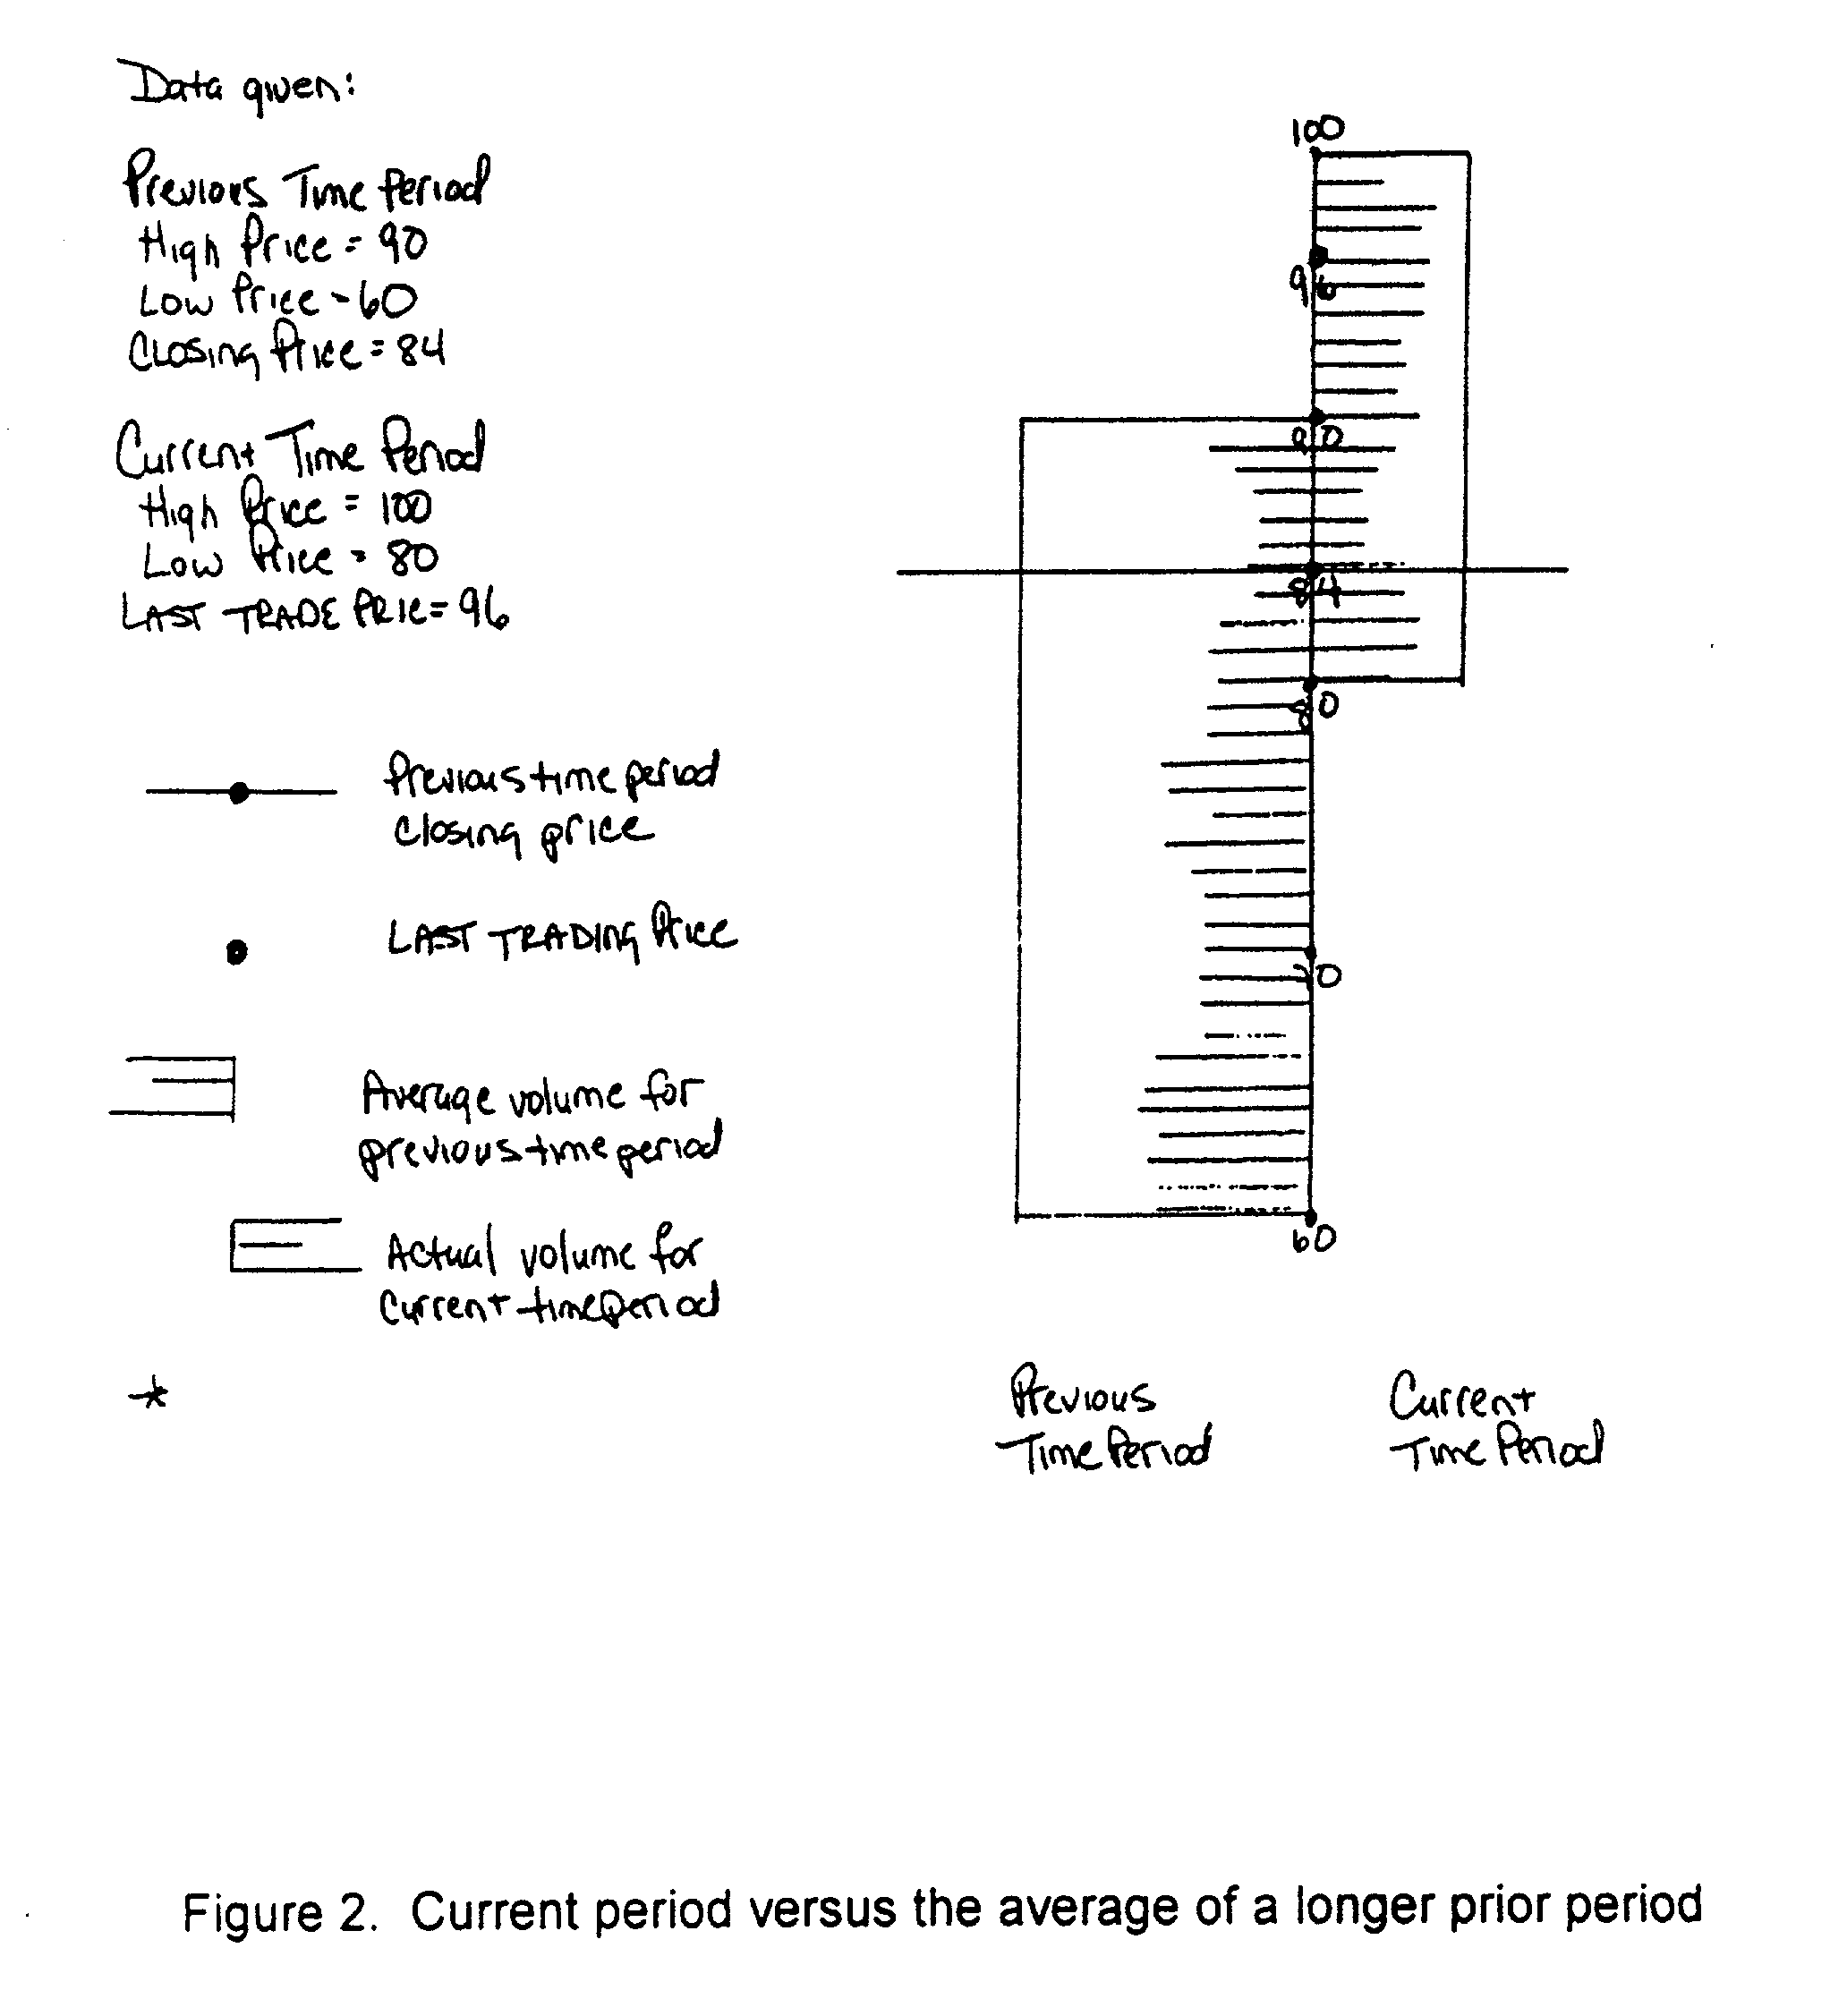
[0009] My invention comprises the creation of charts which use a single axis to display data in the sense that the time element is integrated into the price and volume actions in the form of a modified bar diagram instead of the usual sequential display of time on the horizontal axis. As it will be shown, my invention enables a user to manipulate the time factor in a comparative form, and therefore to be able to show the comparative price action for two different time periods by the use of a common point (i.e., last closing price). Similarly, boundaries based on high, low, open, and close prices could also be displayed on said single axis in a comparative form. Furthermore, by showing the cumulative volumes at their respective prices in a side-by-side display, a user can compare at a glance the volume at each price for any two different time periods of interest.

[0010] Several specific embodiments of my invention are described below.

[0011] 1. A snapshot view for two co...


PUM


Abstract

A method is described which enables a user to present on a single graph several attributes of the market behaviors of securities such as common stocks, options, commodities, and the like. It also enables a user to compare such attributes either along different time horizons, or to compare such attributes of two or more securities. In general, the prices are shown along the vertical direction, whereas an attribute such as volume would be shown as horizontal lines proportional to said volumes in length, and intersecting the price line at positions corresponding to the strike price. Comparisons of several securities as well as comparisons could be easily made, and historical information such as open, close, average, high, and low prices could also be provided though the use of proper legends such as colored lines, asterisks, and the like.

Description

[0001] As the result of the increasing importance of the role which commercial securities as a component for asset management and as a major indicator of the health of the general economy, there has also been a steadily growing public awareness and interest in financial presentations. Most daily newspapers now report a list of selected stocks with their respective daily trading volumes, the trading ranges, and the closing prices. Some papers and other media (e.g., TV) also provide such information in graphical form, typically, a time-line graph showing the prices at selected time intervals (e.g., hourly, every 10 minutes, etc.)[0002] To a large extent, there exists an important relationship between the market behavior of a security and its trading volume. The price of a security, like that of any other goods or services, is subject to the law of supply a demand. While there are many determinants which influence the price of a stock, the most important one is undoubtedly the percepti...

Claims


Application Information

Patent Timeline
IPC IPC(8): G06Q40/00
CPCG06Q40/00G06Q40/06G06Q40/04
Inventor ERDMIER, LISA M.
Owner ERDMIER LISA M
Why Eureka
Try Eureka