
Apparatus method and article of manufacture for visualizing status in a compute environment

a compute environment and apparatus technology, applied in the field of compute infrastructure status visualization techniques, can solve problems such as the change of the image from good to bad

Inactive Publication Date: 2006-09-07
VERIFICHI
View PDF4 Cites 59 Cited by
  • Summary
  • Abstract
  • Description
  • Claims
  • Application Information

AI Technical Summary

Benefits of technology

[0003] Accordingly, what is needed is a further summary of the summary report. That is, a comprehensive way to visualize status on a compute infrastructure, and more particularly, a simple solution that detects status from multiple sources or metrics, consolidates them, summarizes wh...

Problems solved by technology

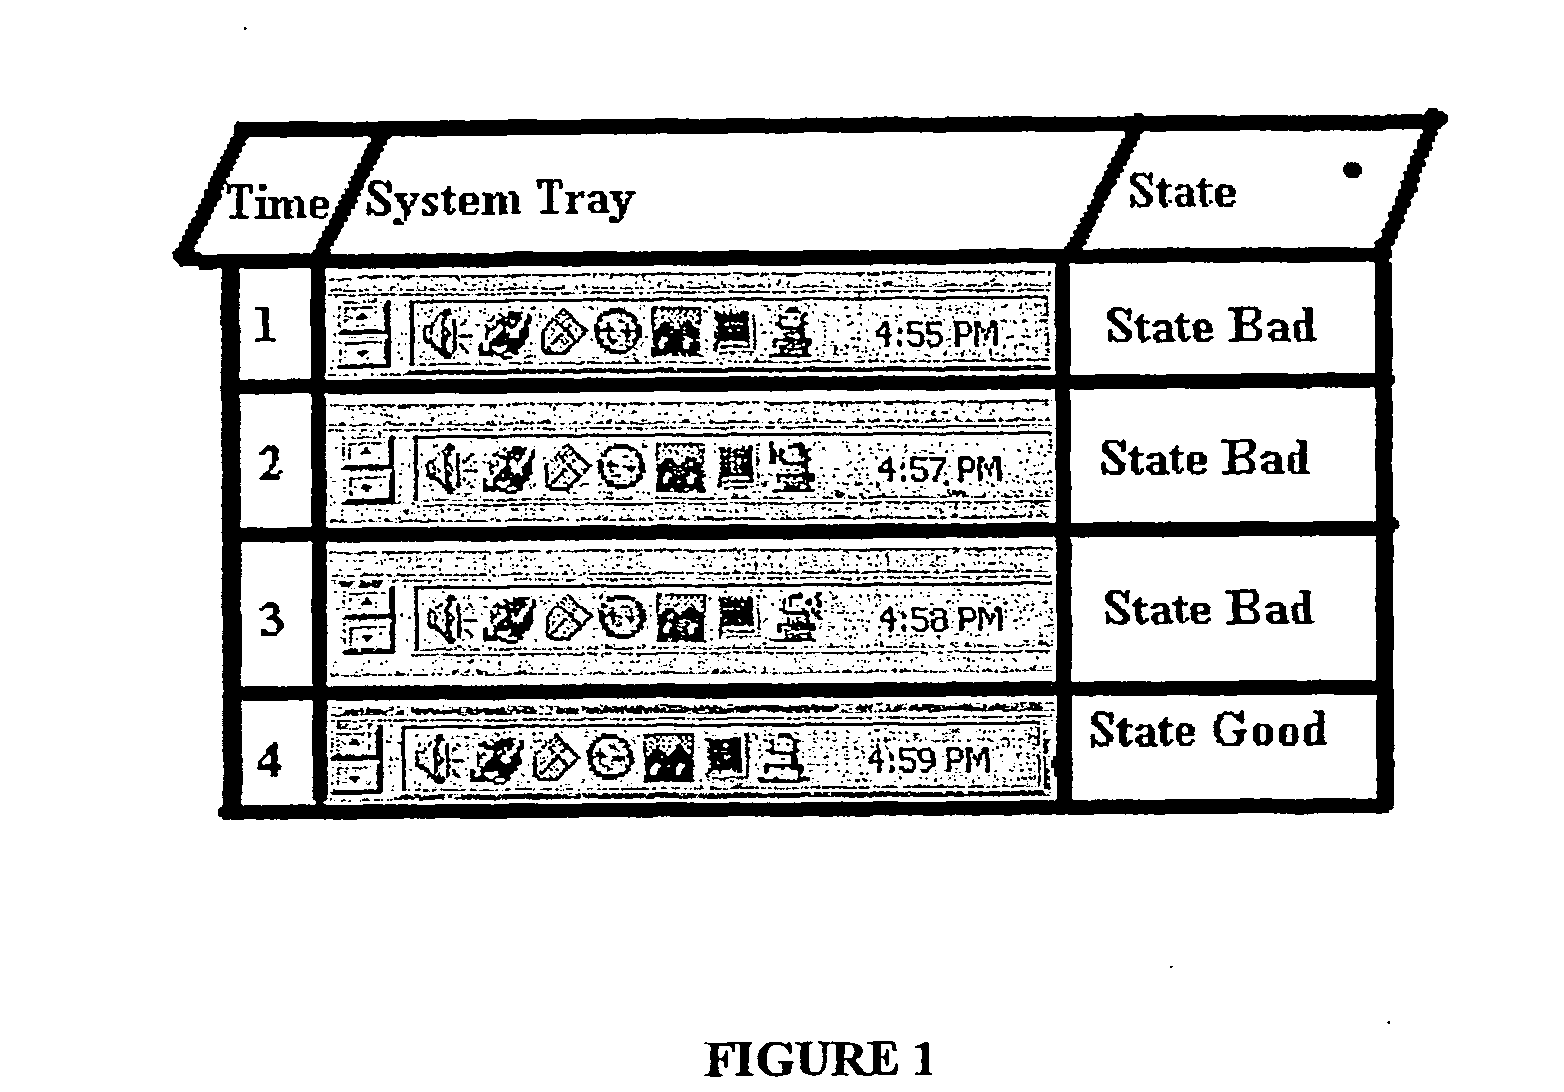
If a problem exists with any metric color of the single main application, the icon changes from good to bad.

Method used


Image

  • Apparatus method and article of manufacture for visualizing status in a compute environment
  • Apparatus method and article of manufacture for visualizing status in a compute environment
  • Apparatus method and article of manufacture for visualizing status in a compute environment

Examples


Embodiment Construction

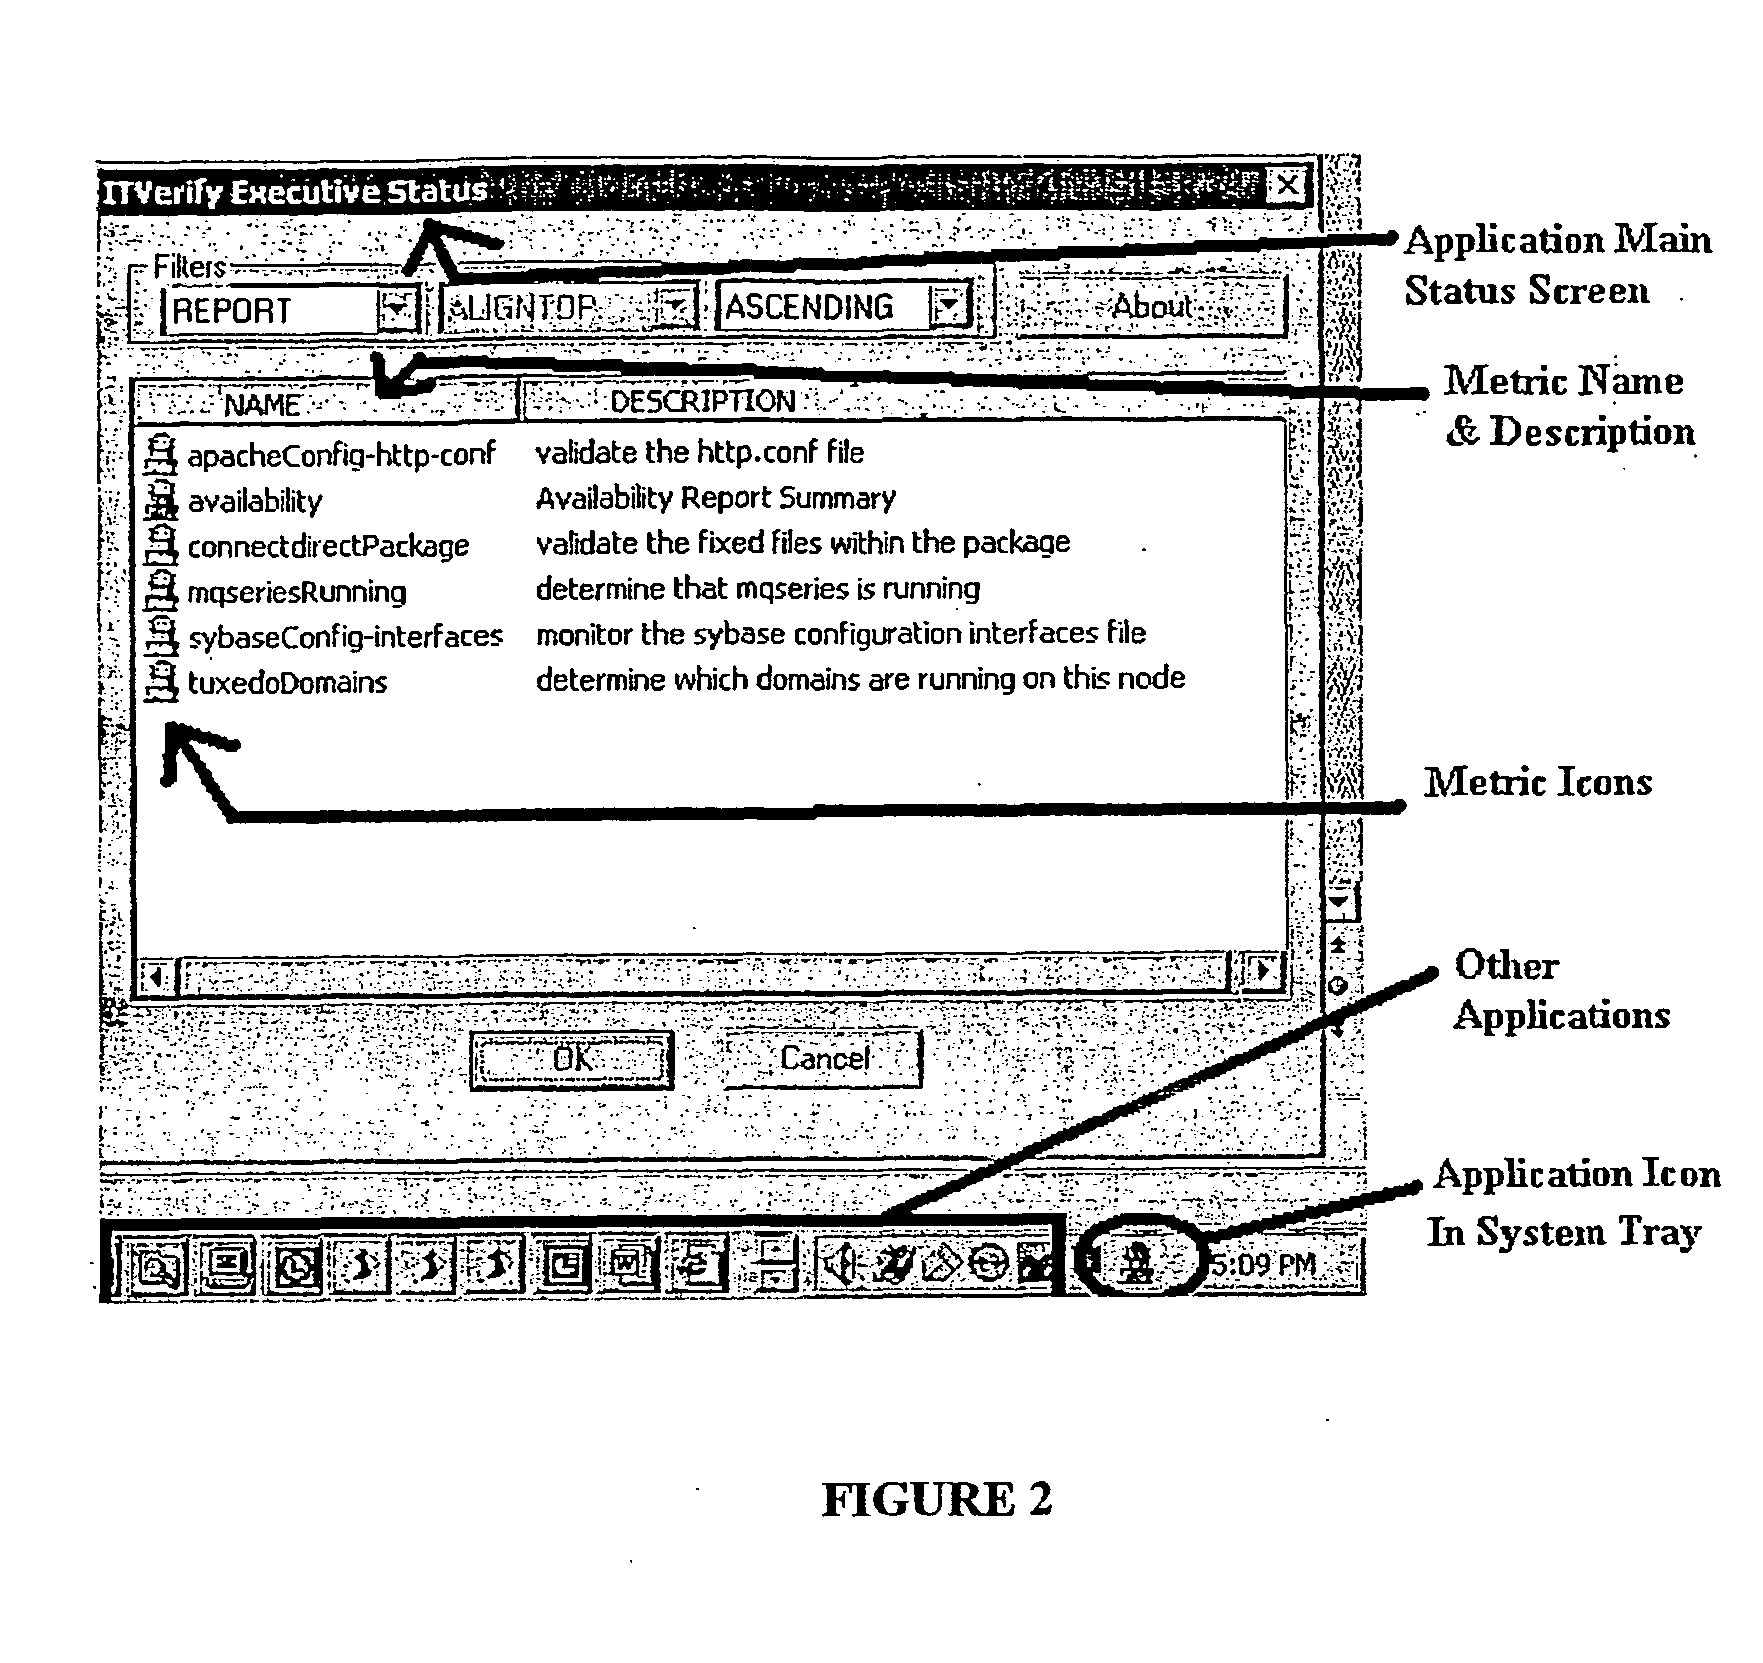
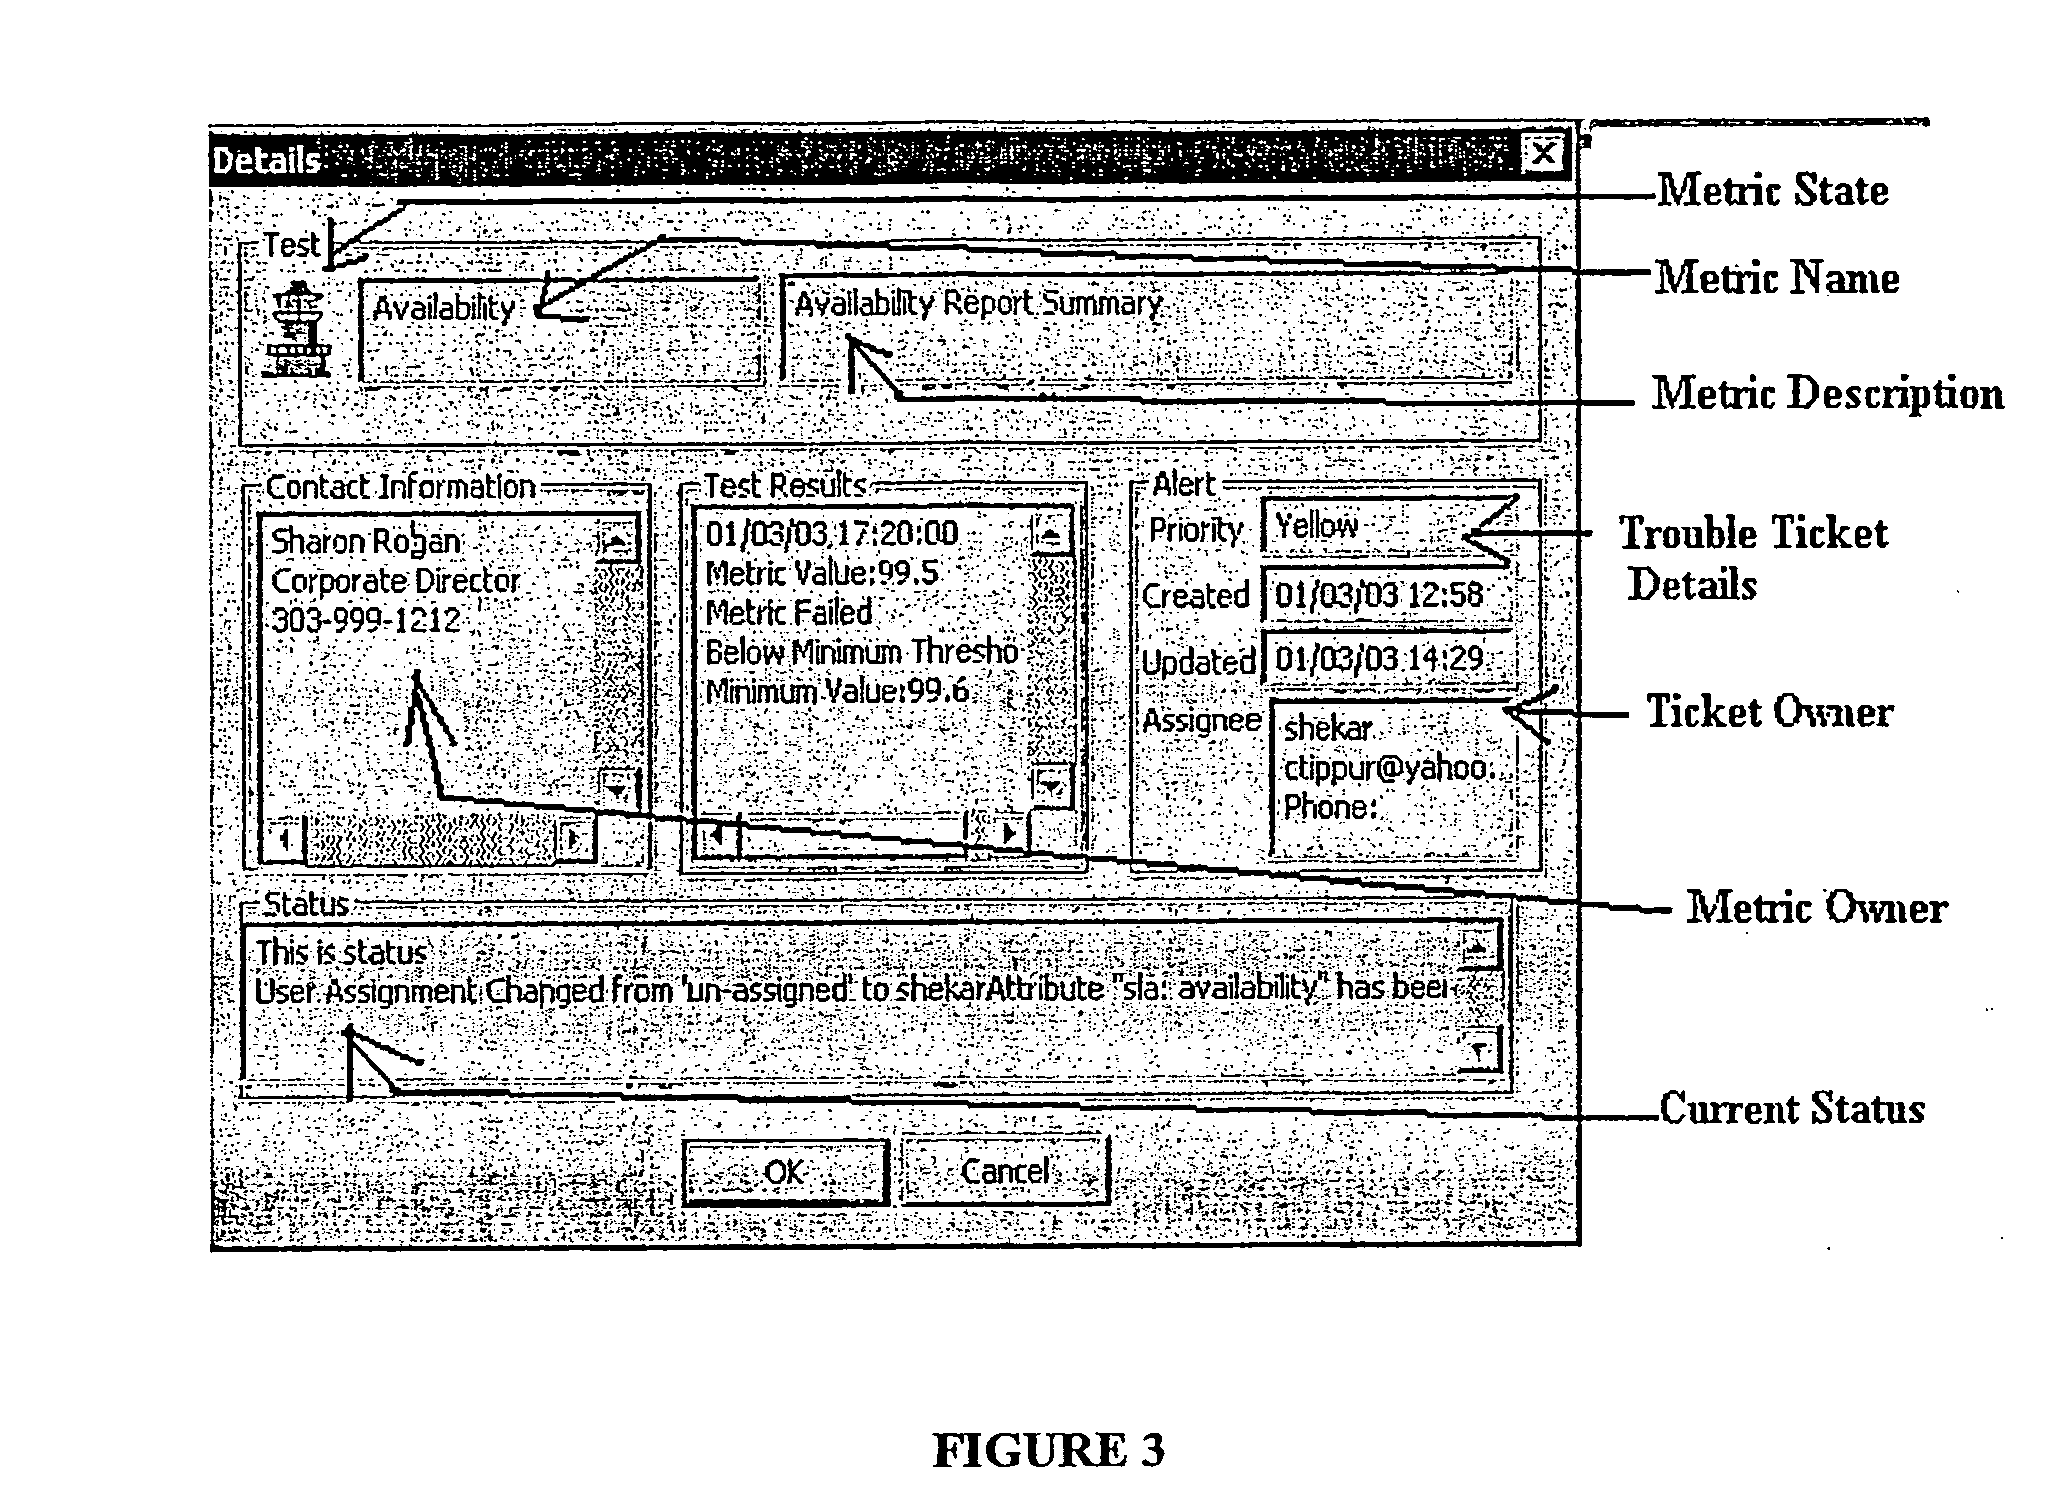
[0007] Referring more specifically to the drawings, for illustrative purposes the present invention may be embodied in the graphical image / interface, method of operation and article of manufacture or product, generally shown in FIGS. 1, 2 and 3. It will be appreciated that the graphical image / interface, method of operation and article of manufacture may vary as to the details of its representative icons (a square may be a circle), configuration (the exact screen layout may be adjusted) and operation without departing from the basic concepts disclosed herein. The following description, which follows with reference to certain embodiments herein, is, therefore, not to be taken in a limiting sense.

[0008] There is provided herein an exemplary method utilizing at least one status icon for visually reporting the status of at least the important metrics of a resource, e.g., one or more applications running within a compute infrastructure. The status icon also implements a real time summary...


PUM


Abstract

There is provided herein an exemplary technique utilizing at least one application status icon for visualizing the status of important metrics of, e.g., one or more applications running within a compute infrastructure. In an exemplary embodiment, the application status icon is located on a device display, preferably as part of a graphical user interface icon tray, such as Microsoft® Windows® system tray. To generate the appropriate color of the application status icon, several predefined test or database queries are executed lo determine the status of a desired application. Thereafter, the determined status is compared to a plurality of threshold conditions, which determine the state of a given status metric and contribute to the overall color of the application status icon, preferably located on the display device. Thus, a user or manager need not run an application to check its status. Instead, the manager need only view the color of the application status icon on the display device to determine the overall health of a plurality of underlying metrics, which contribute to the creation of the application status icon's color.

Description

[0001] The present invention relates generally to compute and / or network management and more particularly to an improved system, method, apparatus, and article of manufacture for graphically reporting status on a compute infrastructure. BACKGROUND OF THE INVENTION [0002] Heretofore, compute infrastructure status visualization techniques involve the use of multiple and various applications that are generally specialized, large and complex, all monopolizing desktop resources and usually requiring special training. Determining status on important metrics such as business, application, and technology or production issues involves interaction with one or more of these complex applications, multiple key strokes and complex application interaction to generate reports, which are then consolidated from multiple sources and summarized for management. The process is often time-consuming and cumbersome and requires special training and skills. Furthermore, the existing applications are geared f...

Claims


Application Information

Patent Timeline
IPC IPC(8): G06F3/00G06FG06F3/048G06F15/173
CPCG06F3/0481G06F3/04817
Inventor NOCERA, DAVIDWAGNER, LORELEI
Owner VERIFICHI
Learn More