Fusion and visualization for multiple anomaly detection systems

a detection system and anomaly technology, applied in the field of dynamic anomaly analysis, can solve the problems of limiting the performance of anomaly systems, high false alarm rate of systems, and high false alarm rate of systems, and achieve the effect of quick comprehension

Inactive Publication Date: 2008-09-04
QUANTUM INTELLIGENCE
View PDF3 Cites 71 Cited by
  • Summary
  • Abstract
  • Description
  • Claims
  • Application Information

AI Technical Summary

Benefits of technology

[0021]The invention allows for the analysis and quantification of information as it relates to a collection of normal profiles. More specifically, the invention allows information to be measured in terms of the level of anomaly with respect to multiple normal profiles. Normal profiles are knowledge patterns discovered from historical data sources. This measure or anomaly score is visualized in meters that allow for easy interpretation and updating. The method fuses the anomaly results from multiple detection systems and displays this data such that a human viewer can understand the real meaning of the results and quickly comprehend genuine anomaly activities. Furthermore, an analysis of information is accomplished through critical event notifications. Anomalies from separate systems are processed and evaluated against fusion rules, which trigger notification and visualization of only real anomaly events.

Problems solved by technology

In other words, those systems usually have high false alarm rates.
A high false alarm rate is the limiting factor for the performance of those anomaly systems.

Method used


Image

  • Fusion and visualization for multiple anomaly detection systems
  • Fusion and visualization for multiple anomaly detection systems
  • Fusion and visualization for multiple anomaly detection systems

Examples


Embodiment Construction

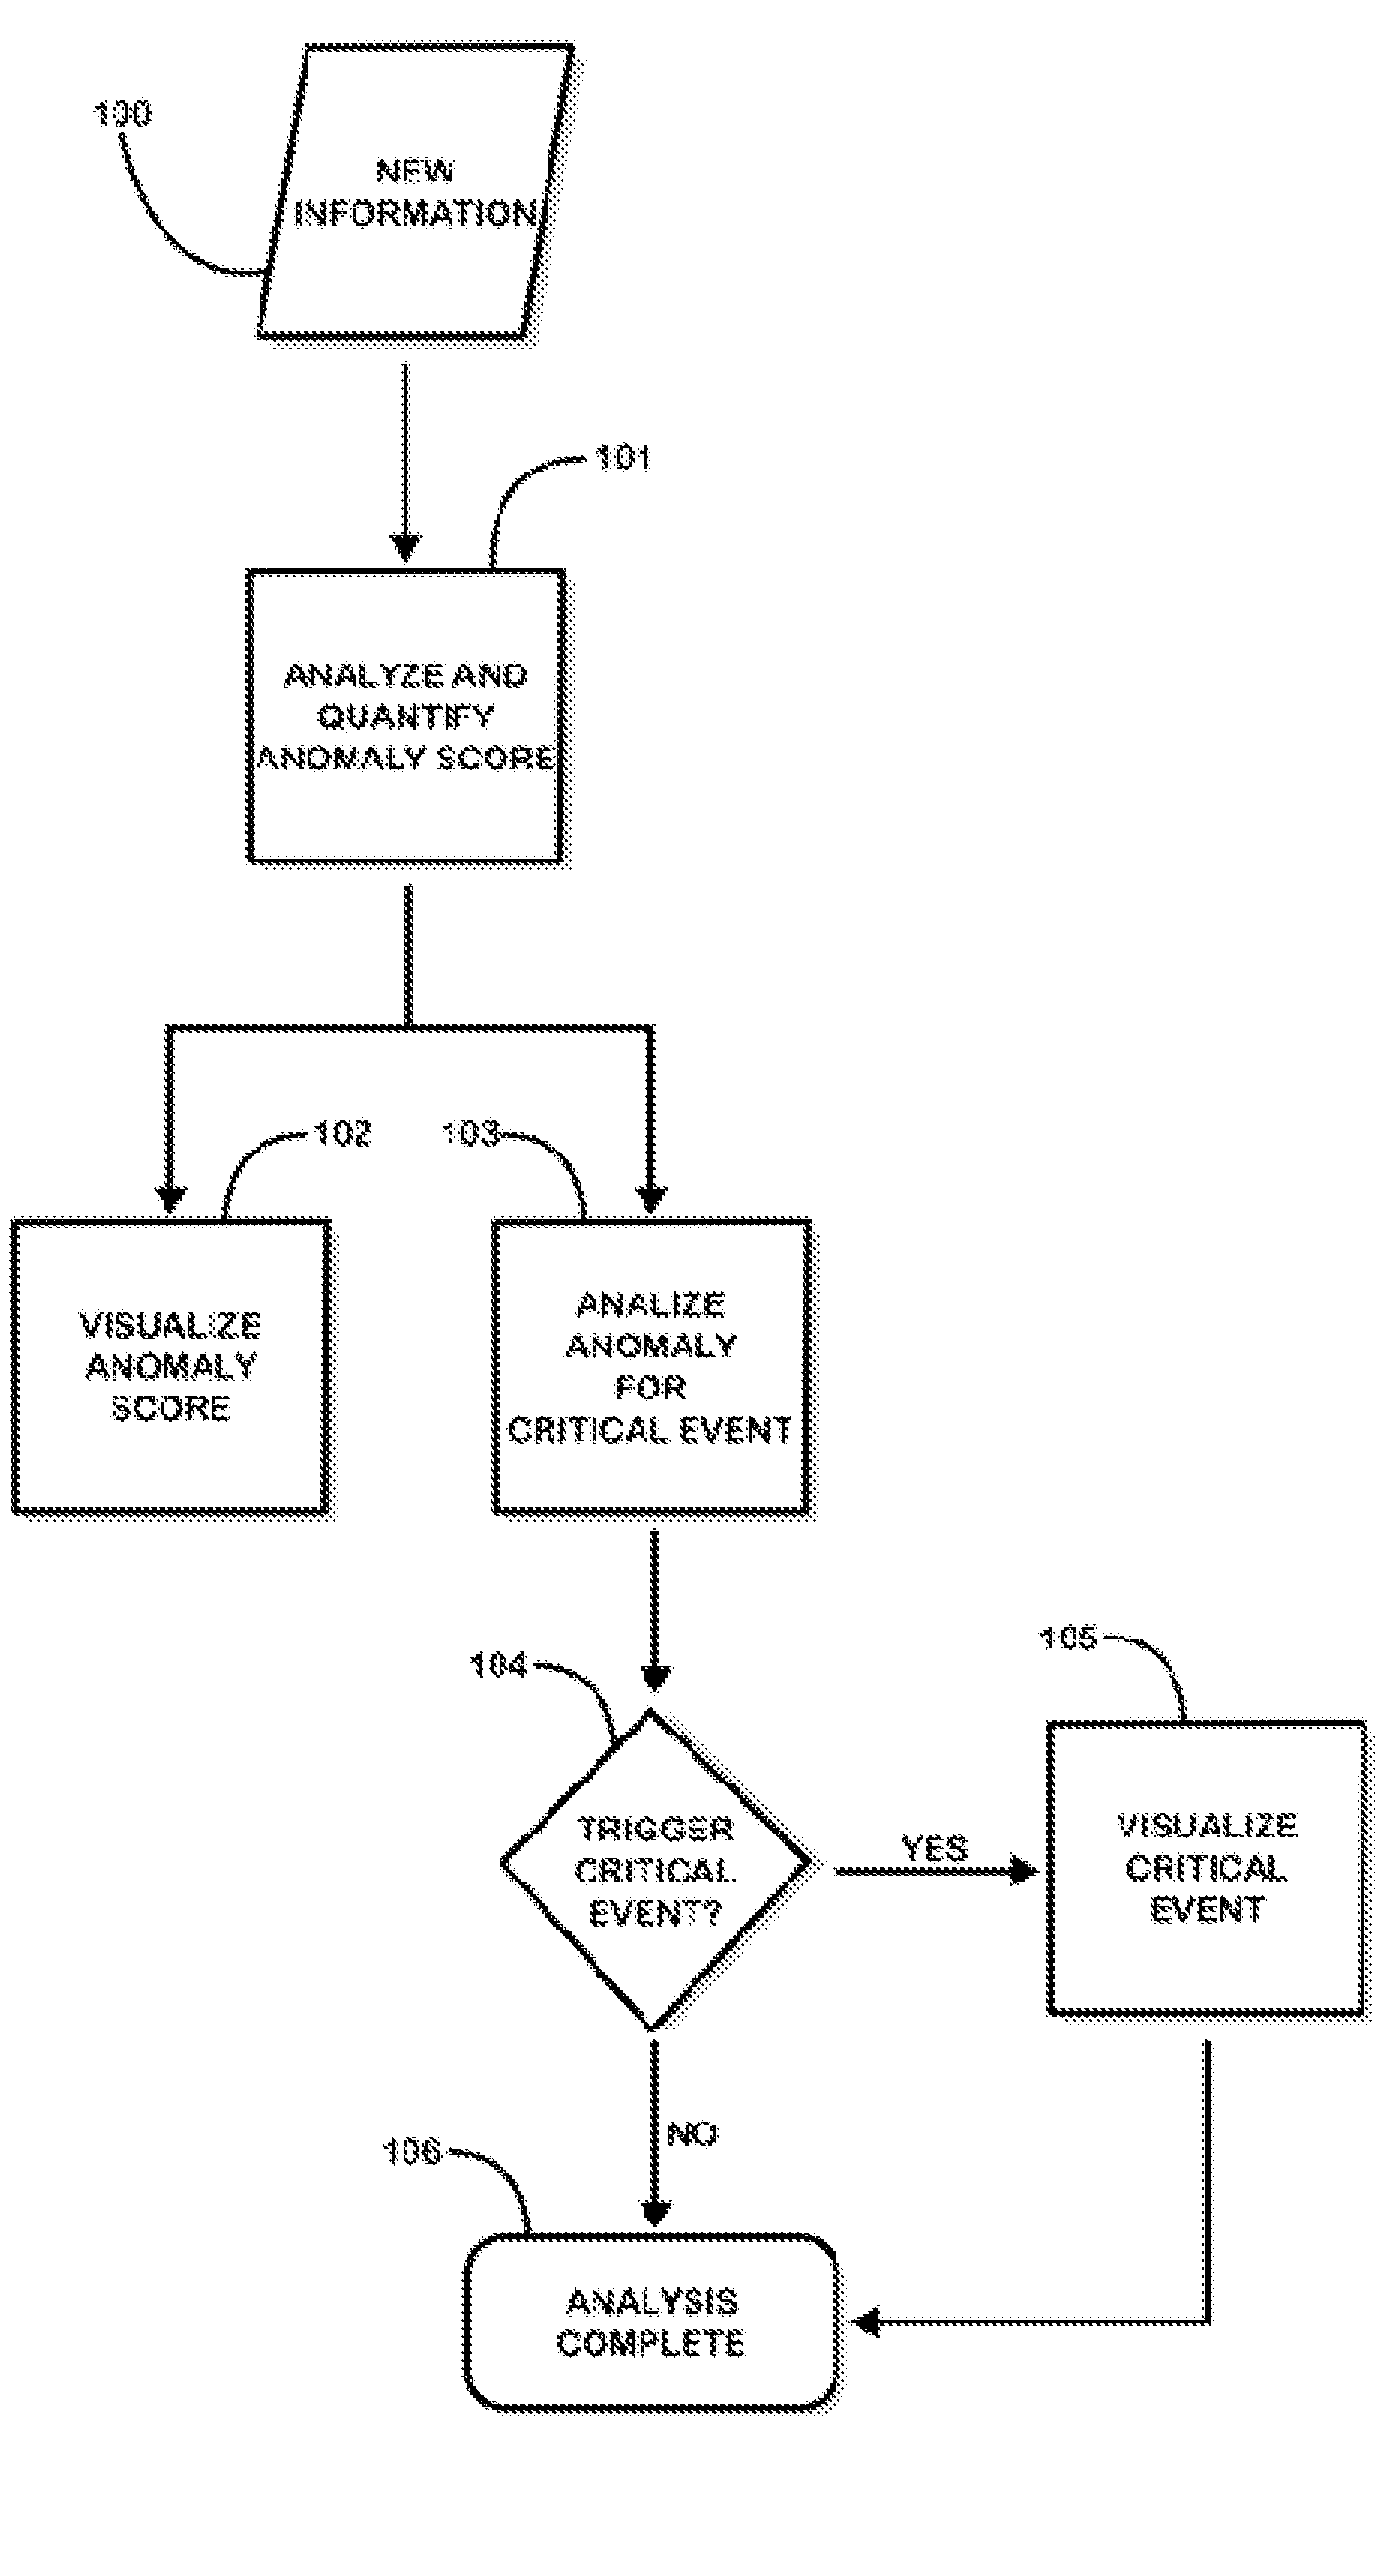
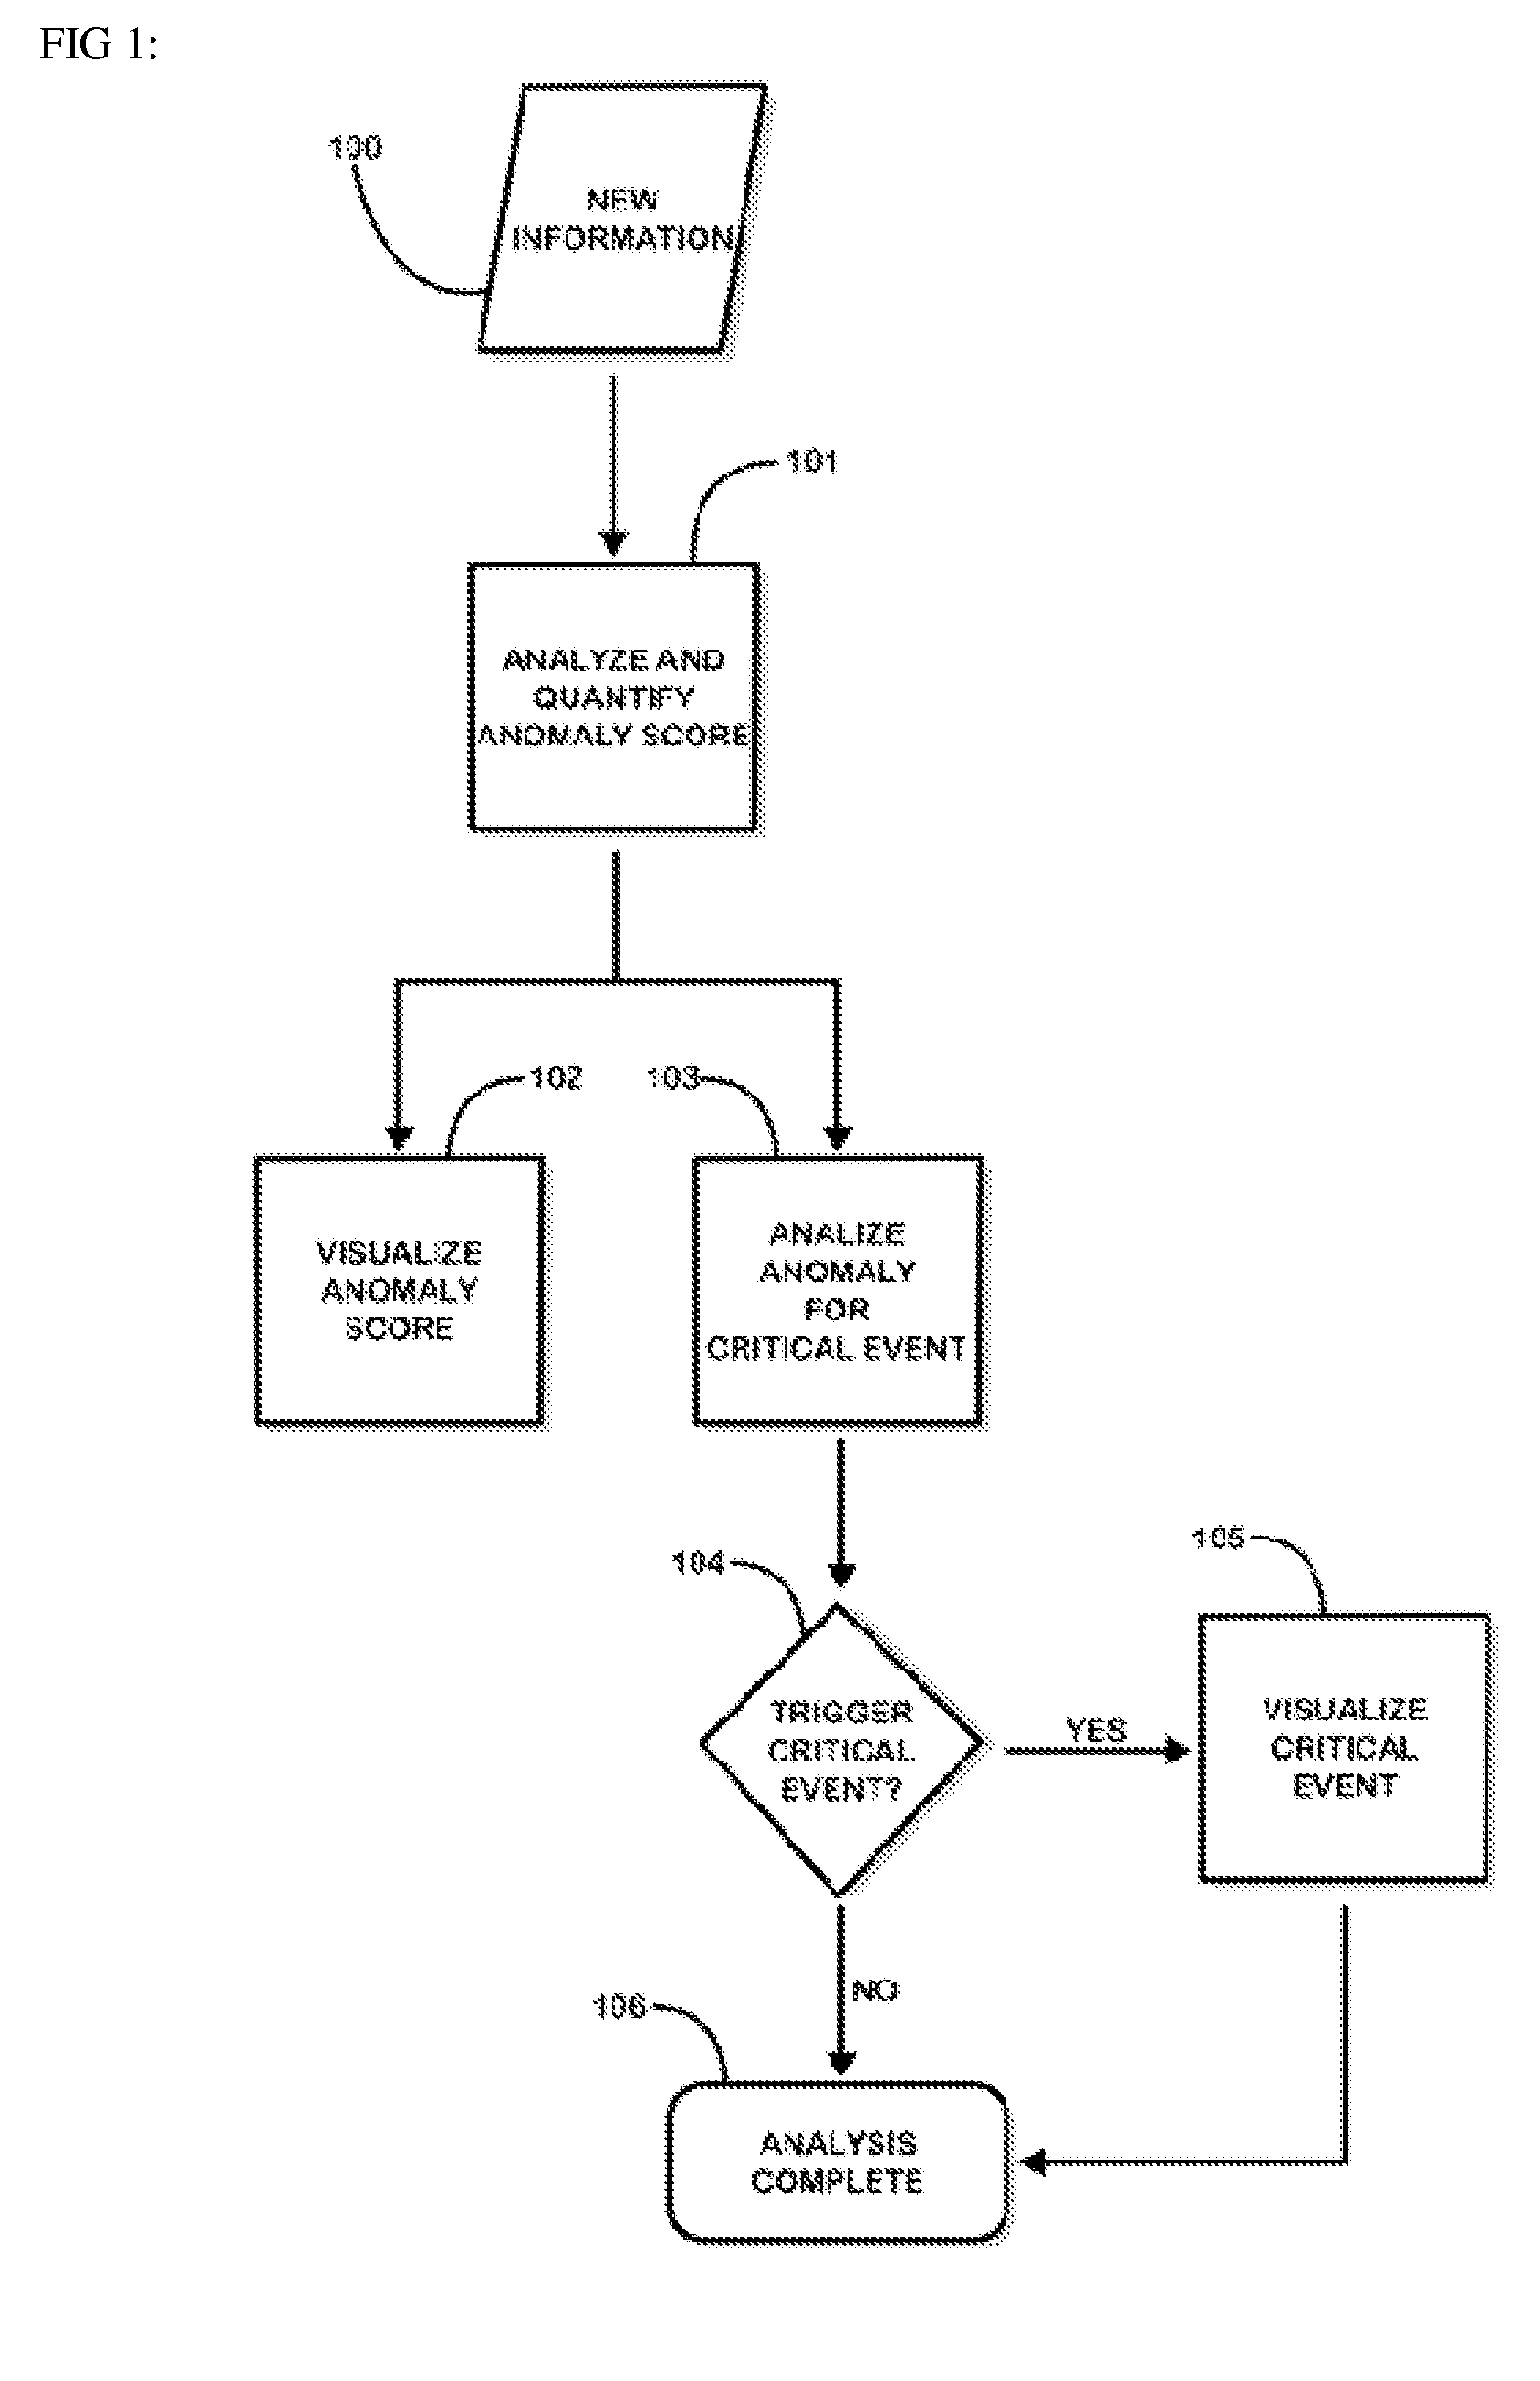
[0037]The present invention is used to analyze and assess information against how anomalous it is. The invention then allows for the assessment to be visualized through a user interface. FIG. 1 represents a flowchart diagram of the steps and processes involved in anomaly detection and visualization within a single anomaly detection system. New information 100 represents any form of structured and unstructured text and data that is to be processed by the system. The new information is passed to the anomaly detection engine, where it will be analyzed and the anomaly score will be determined 101. Upon completion, the score is wrapped in a meter object and is passed to the user interface for visualization 102. The anomaly score is further analyzed by the critical event engine to determine if any fusion rules have been triggered 103, 104. If a rule has been triggered, a critical event object is created and passed to the user interface for visualization 105. Finally, the process is comple...


PUM


Abstract

The present invention is a method for detecting anomalies against normal profiles and for fusing and visualizing the results from multiple anomaly detection systems in a quantifying and unifying user interface. The knowledge patterns discovered from historical data serve as the normal profiles, or baselines or references (hereinafter, called “normal profiles”). The method assesses a piece of information against a collection of the normal profiles and decides how anomalous it is. The normal profiles are calculated from historical data sources, and stored in a collection of mining models. Multiple anomaly detection systems generate a collection of mining models using multiple data sources. When a piece of information is newly observed, the method measures the degree of correlation between the observed information and the normal profiles. The analysis is expressed and visualized through anomaly scores and critical event notifications that are triggered by fusion rules, thus allowing a user to see multiple levels of complexity and detail in a single view.

Description

CROSS-REFERENCE TO RELATED APPLICATIONS[0001]N / AFEDERALLY SPONSORED RESEARCH[0002]N / ASEQUENCE LISTING[0003]NONEREFERENCES[0004]S. Rubin, M. Christodorescu, V. Ganapathy, J. T. Giffin, L. Kruger, H. Wang and N. Kidd. “An Auctioning Reputation System Based on Anomaly Detection”. In ACM CCS'05, Nov. 7-11, 2005.[0005][2] P. Varner and J. C. Knight, “Security Monitoring, Visualization, and System Survivability”, Information Survivability Workshop, January 2001.[0006][3] M. Luis, A. Bettencourt, R. M. Ribeiro, G. Chowell, T. Lant and C. Castillo-Chavez, “Towards Real Time Epidemiology: Data Assimilation, Modeling and Anomaly Detection of Health Surveillance Data Streams”, Lecture Notes in Computer Science, Springer Berlin / Heidelberg, 2007[0007][4] R. K. Gopal, and S. K. Meher, “A Rule-based Approach for Anomaly Detection in Subscriber Usage Pattern”, International Journal of Mathematical, Physical and Engineering Sciences. Volume 1 Number 3.[0008][5] S. Sarah, “Competitive Overview of Sta...

Claims


Application Information

Patent Timeline
Patent Type & Authority Applications(United States)
IPC IPC(8): G06F17/30
CPCG06F17/30702G06F16/337
Inventor ZHAO, YINGZHOU, CHARLES CHUXINKOTAK, CHETAN K.
Owner QUANTUM INTELLIGENCE
Why Eureka
Try Eureka