Location and displaying an ischemic region for ECG diagnostics
a technology of ischemic region and diagnostics, applied in the field of diagnostics and displaying an ischemic region, can solve the problems of not having immediate support for their decision, and it is difficult for the attending physician to mentally visualize the precise location of the ischemic region
- Summary
- Abstract
- Description
- Claims
- Application Information
AI Technical Summary
Problems solved by technology
Method used
Image
Examples
Embodiment Construction
[0049]U.S. Pat. No. 5,803,084 by Olson, issued Sep. 8, 1998, entitled “THREE DIMENSIONAL VECTOR CARDIOGRAPHIC DISPLAY AND METHOD FOR DISPLAYING SAME” and U.S. Pat. No. 6,884,218 B2 by Olson, issued Apr. 26, 2005, entitled “THREE DIMENSIONAL VECTOR CARDIOGRAPH AND METHOD FOR DETECTING AND MONITORING ISCHEMIC EVENTS” are incorporated by reference herein in their entirety.
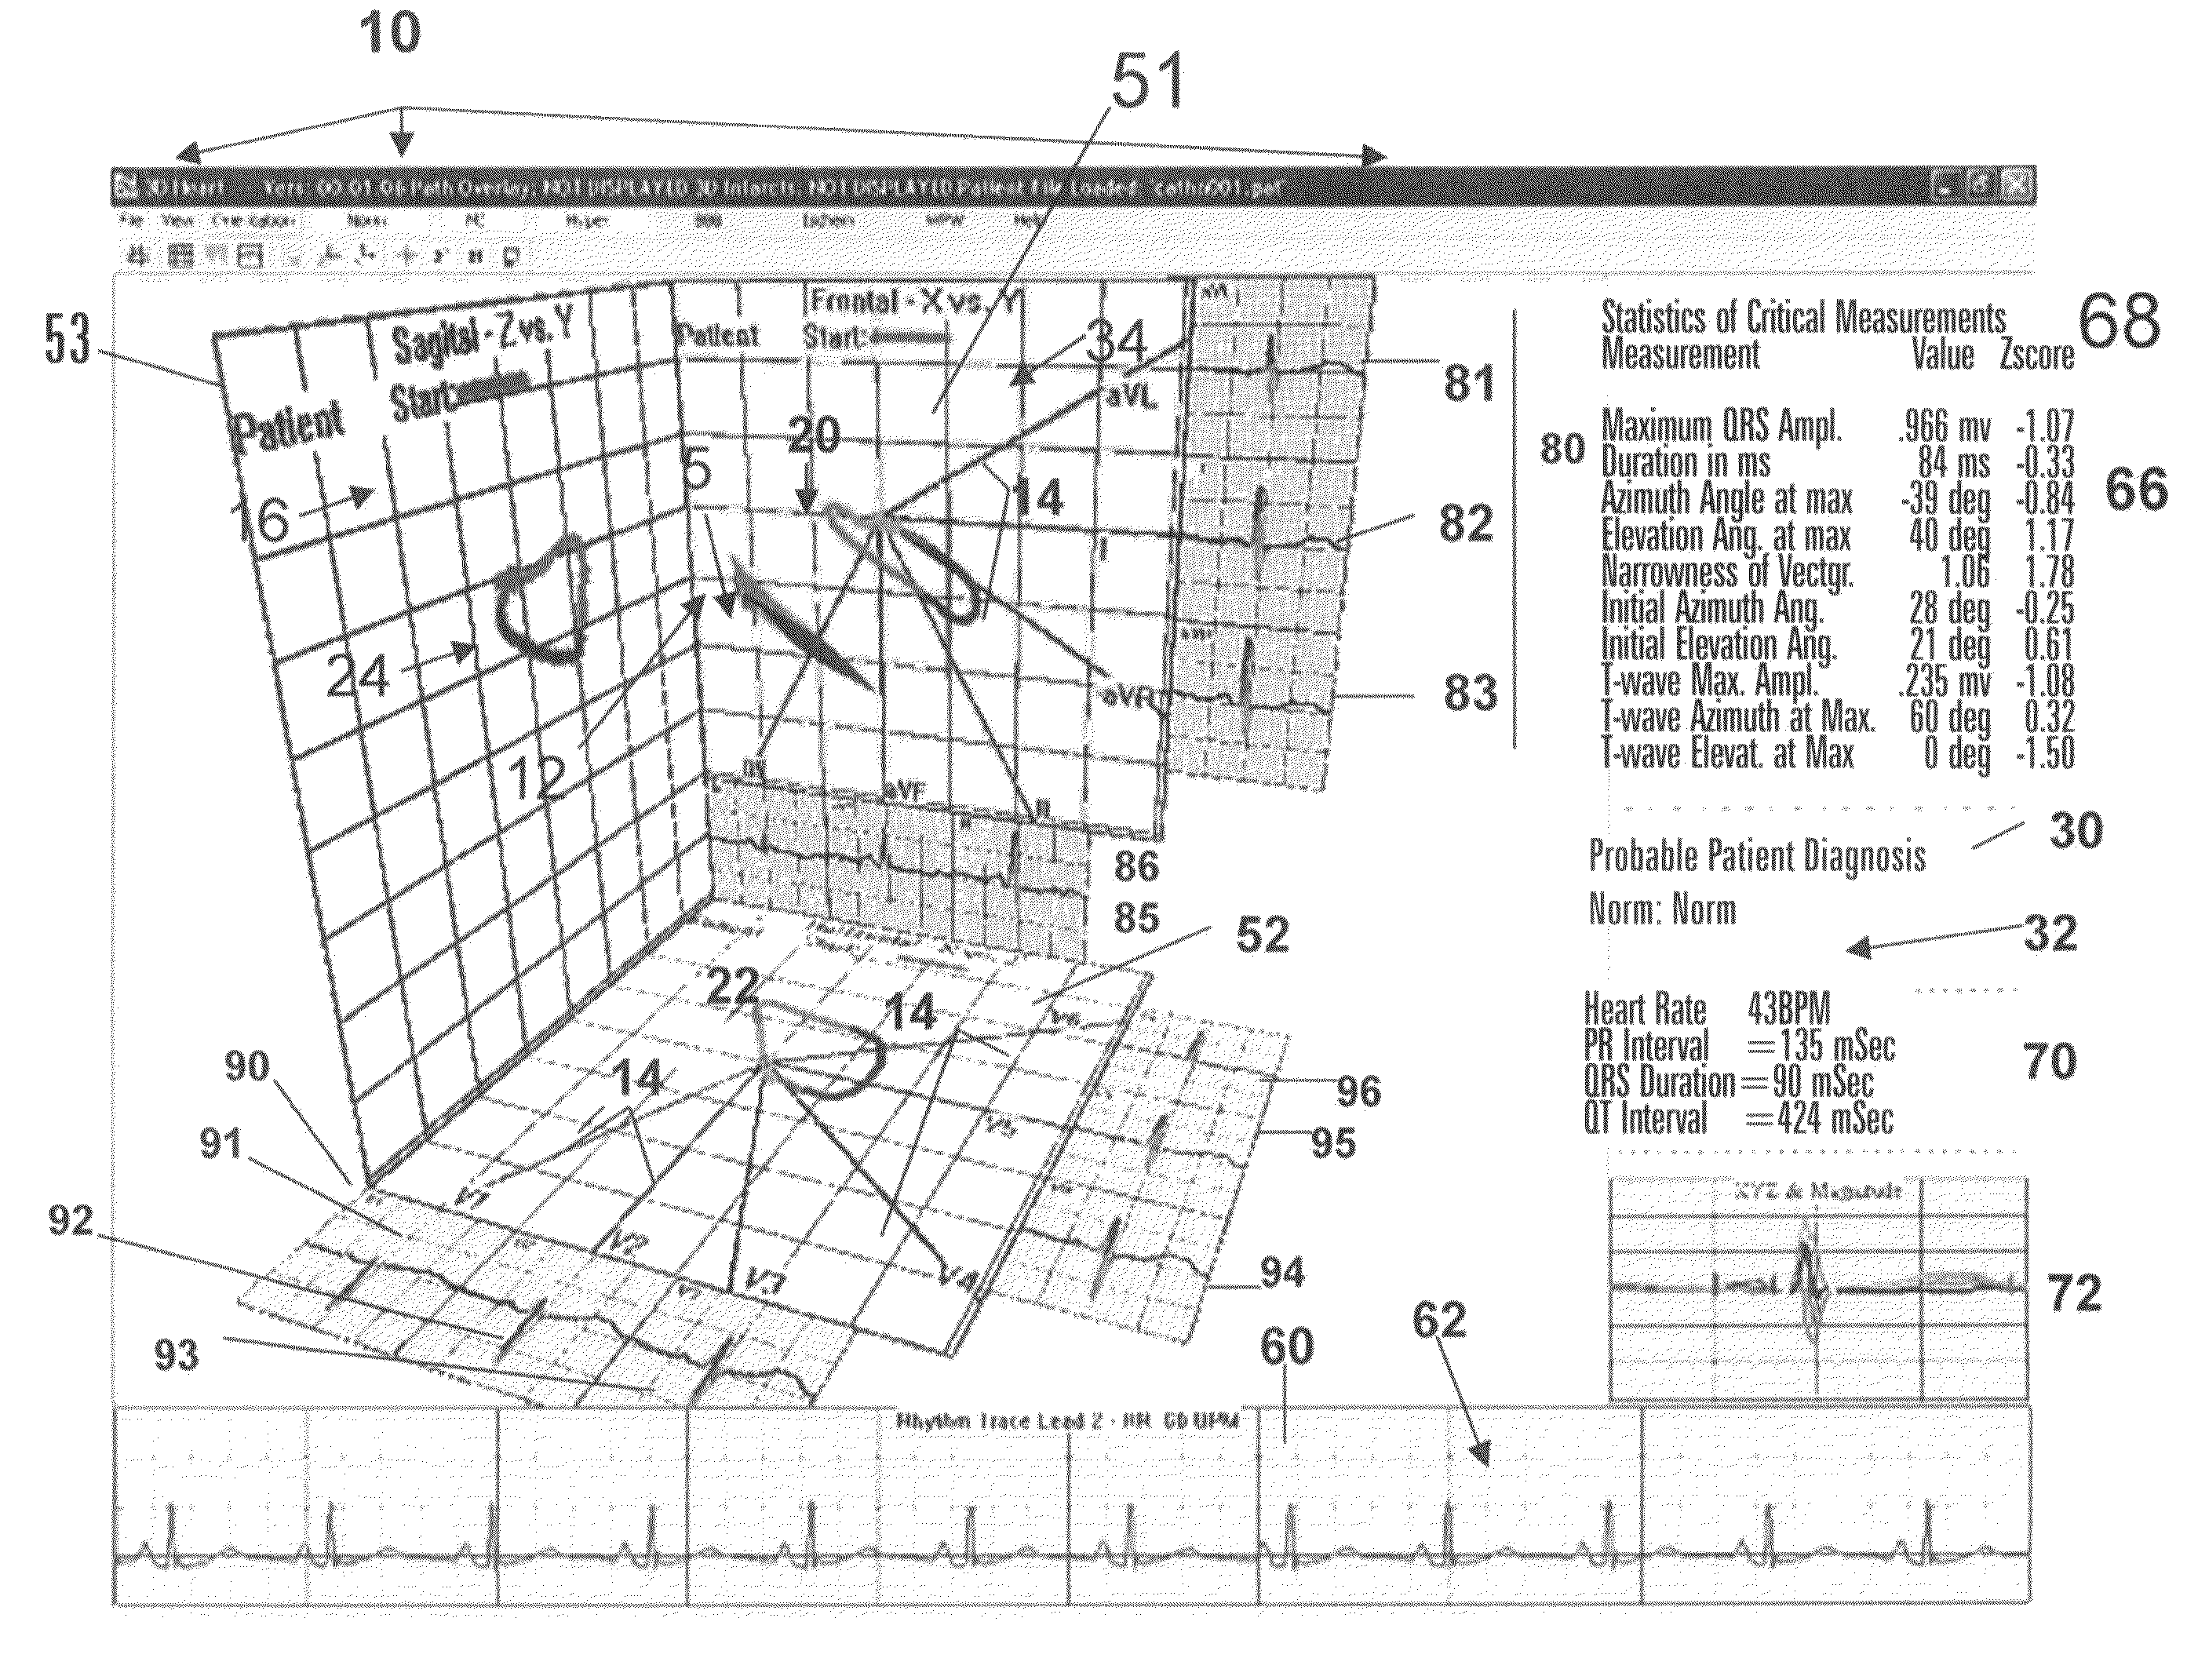
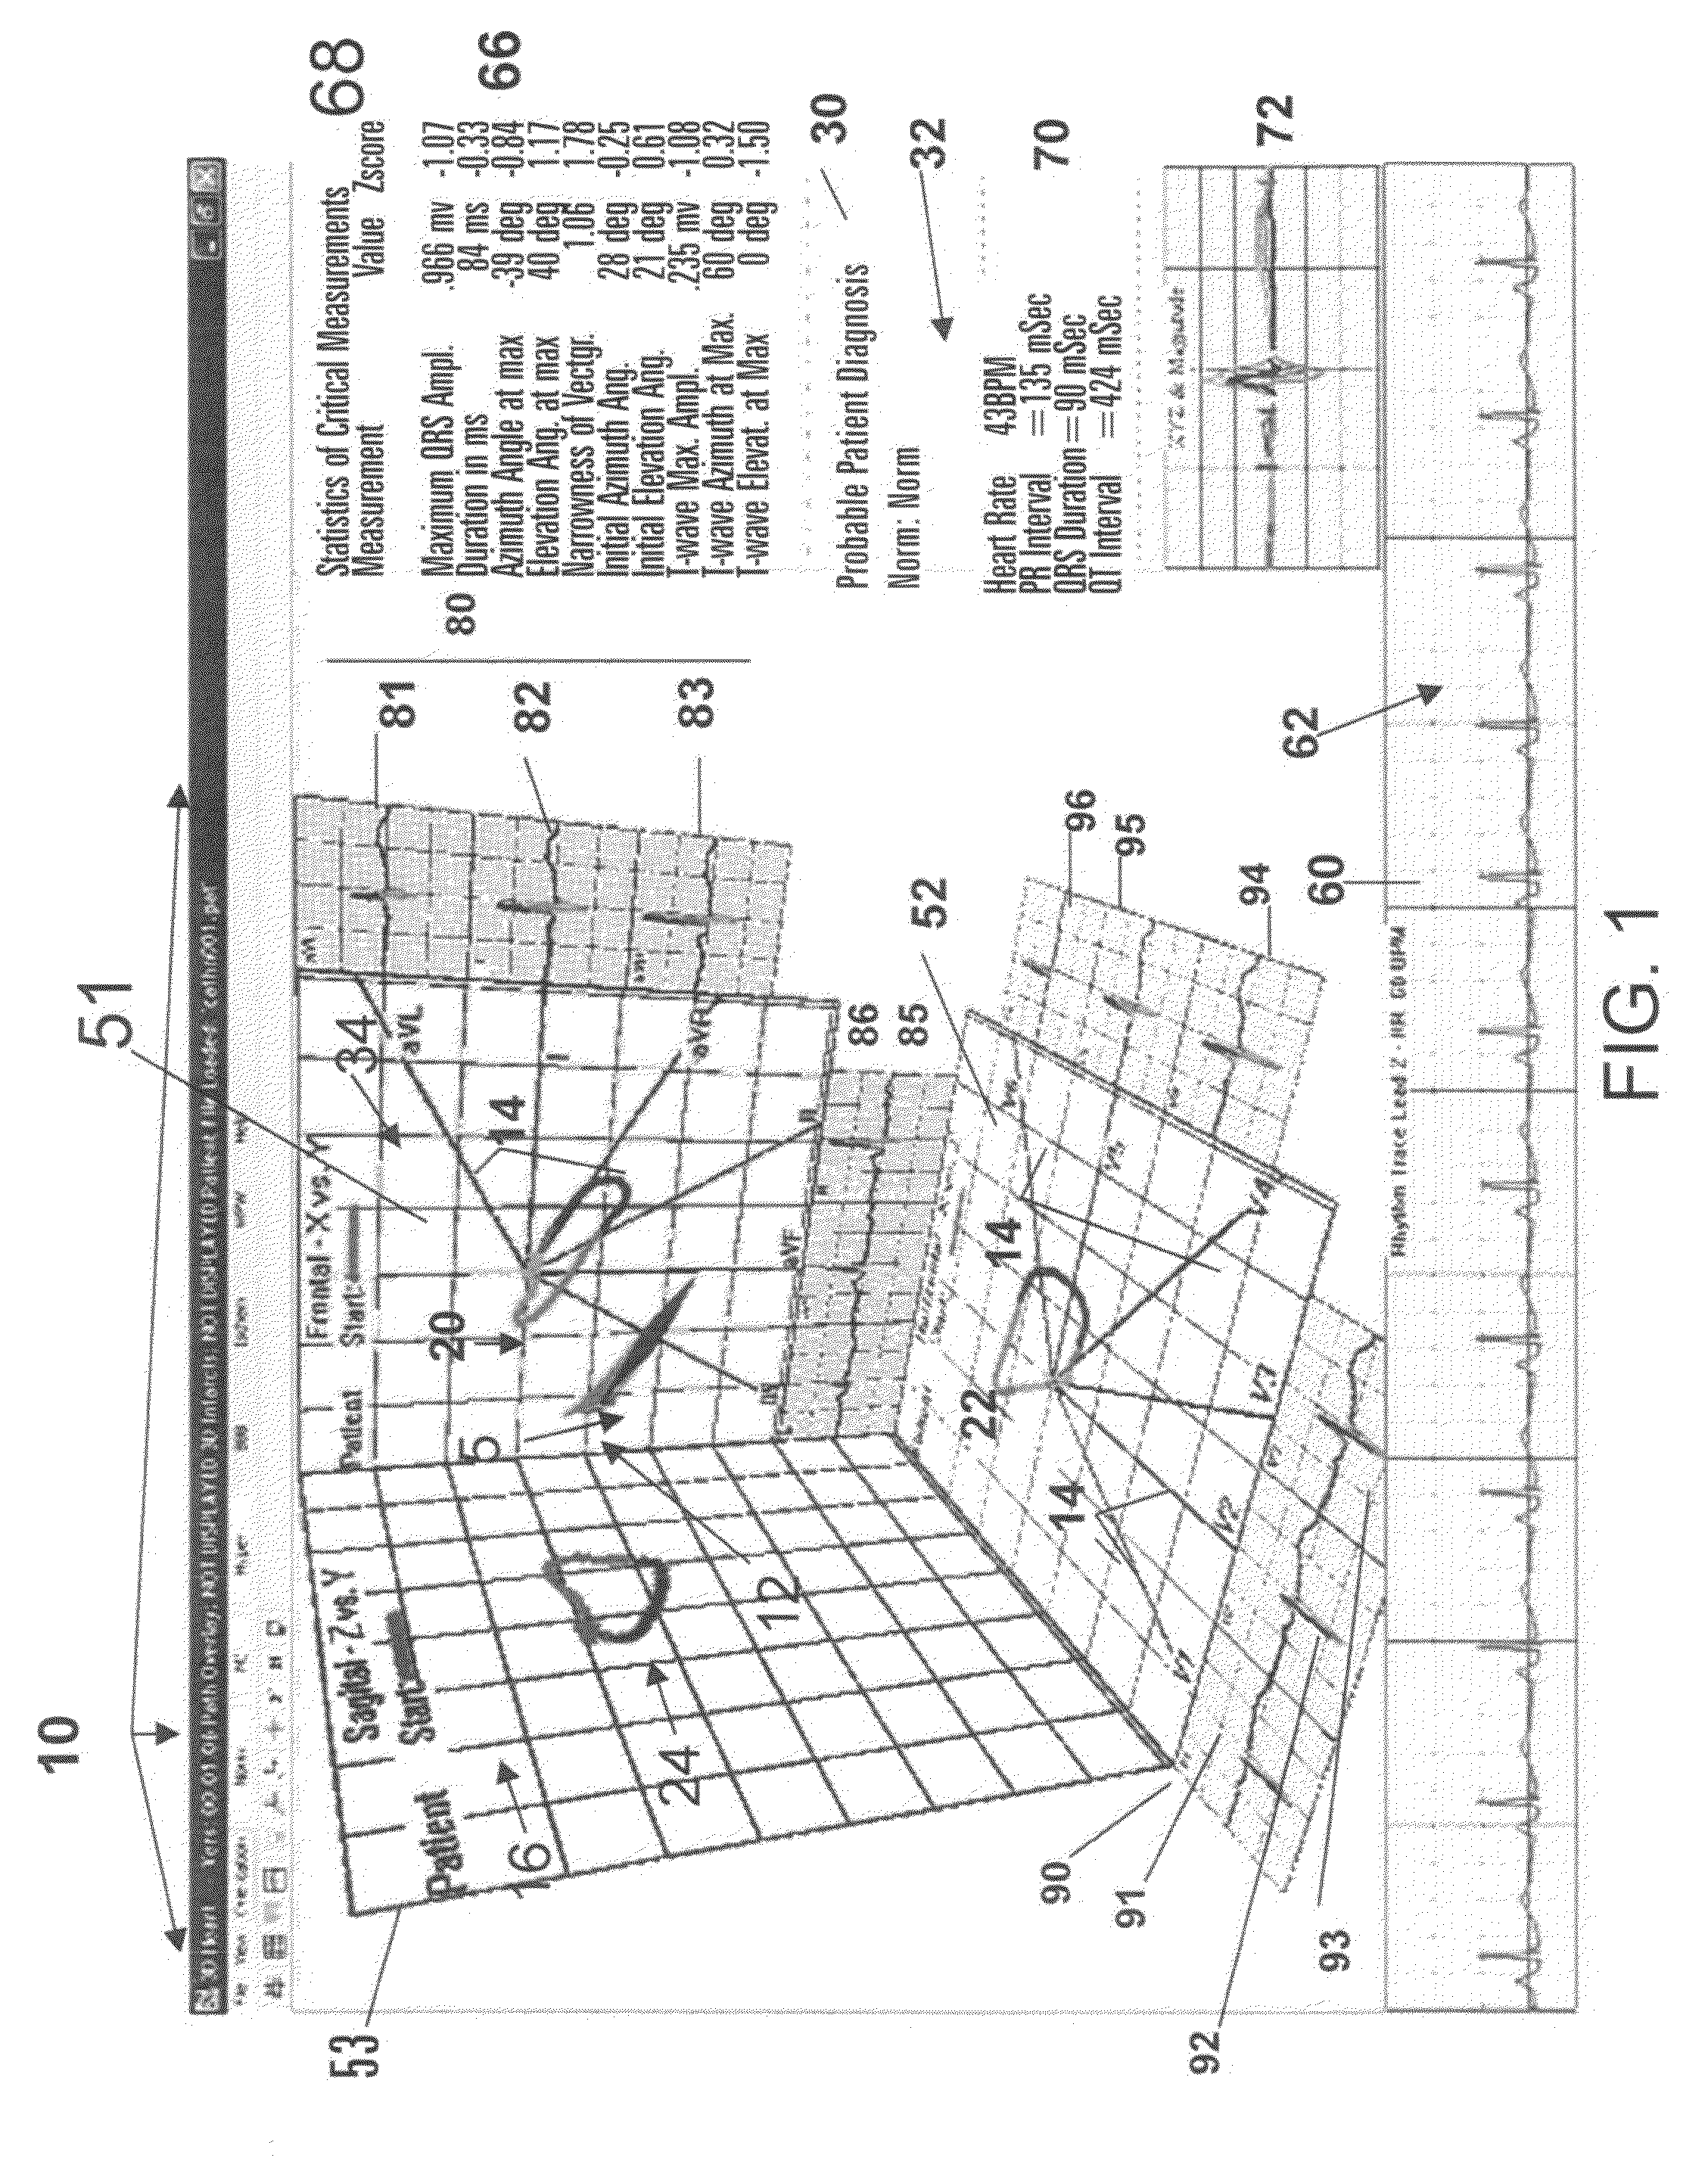
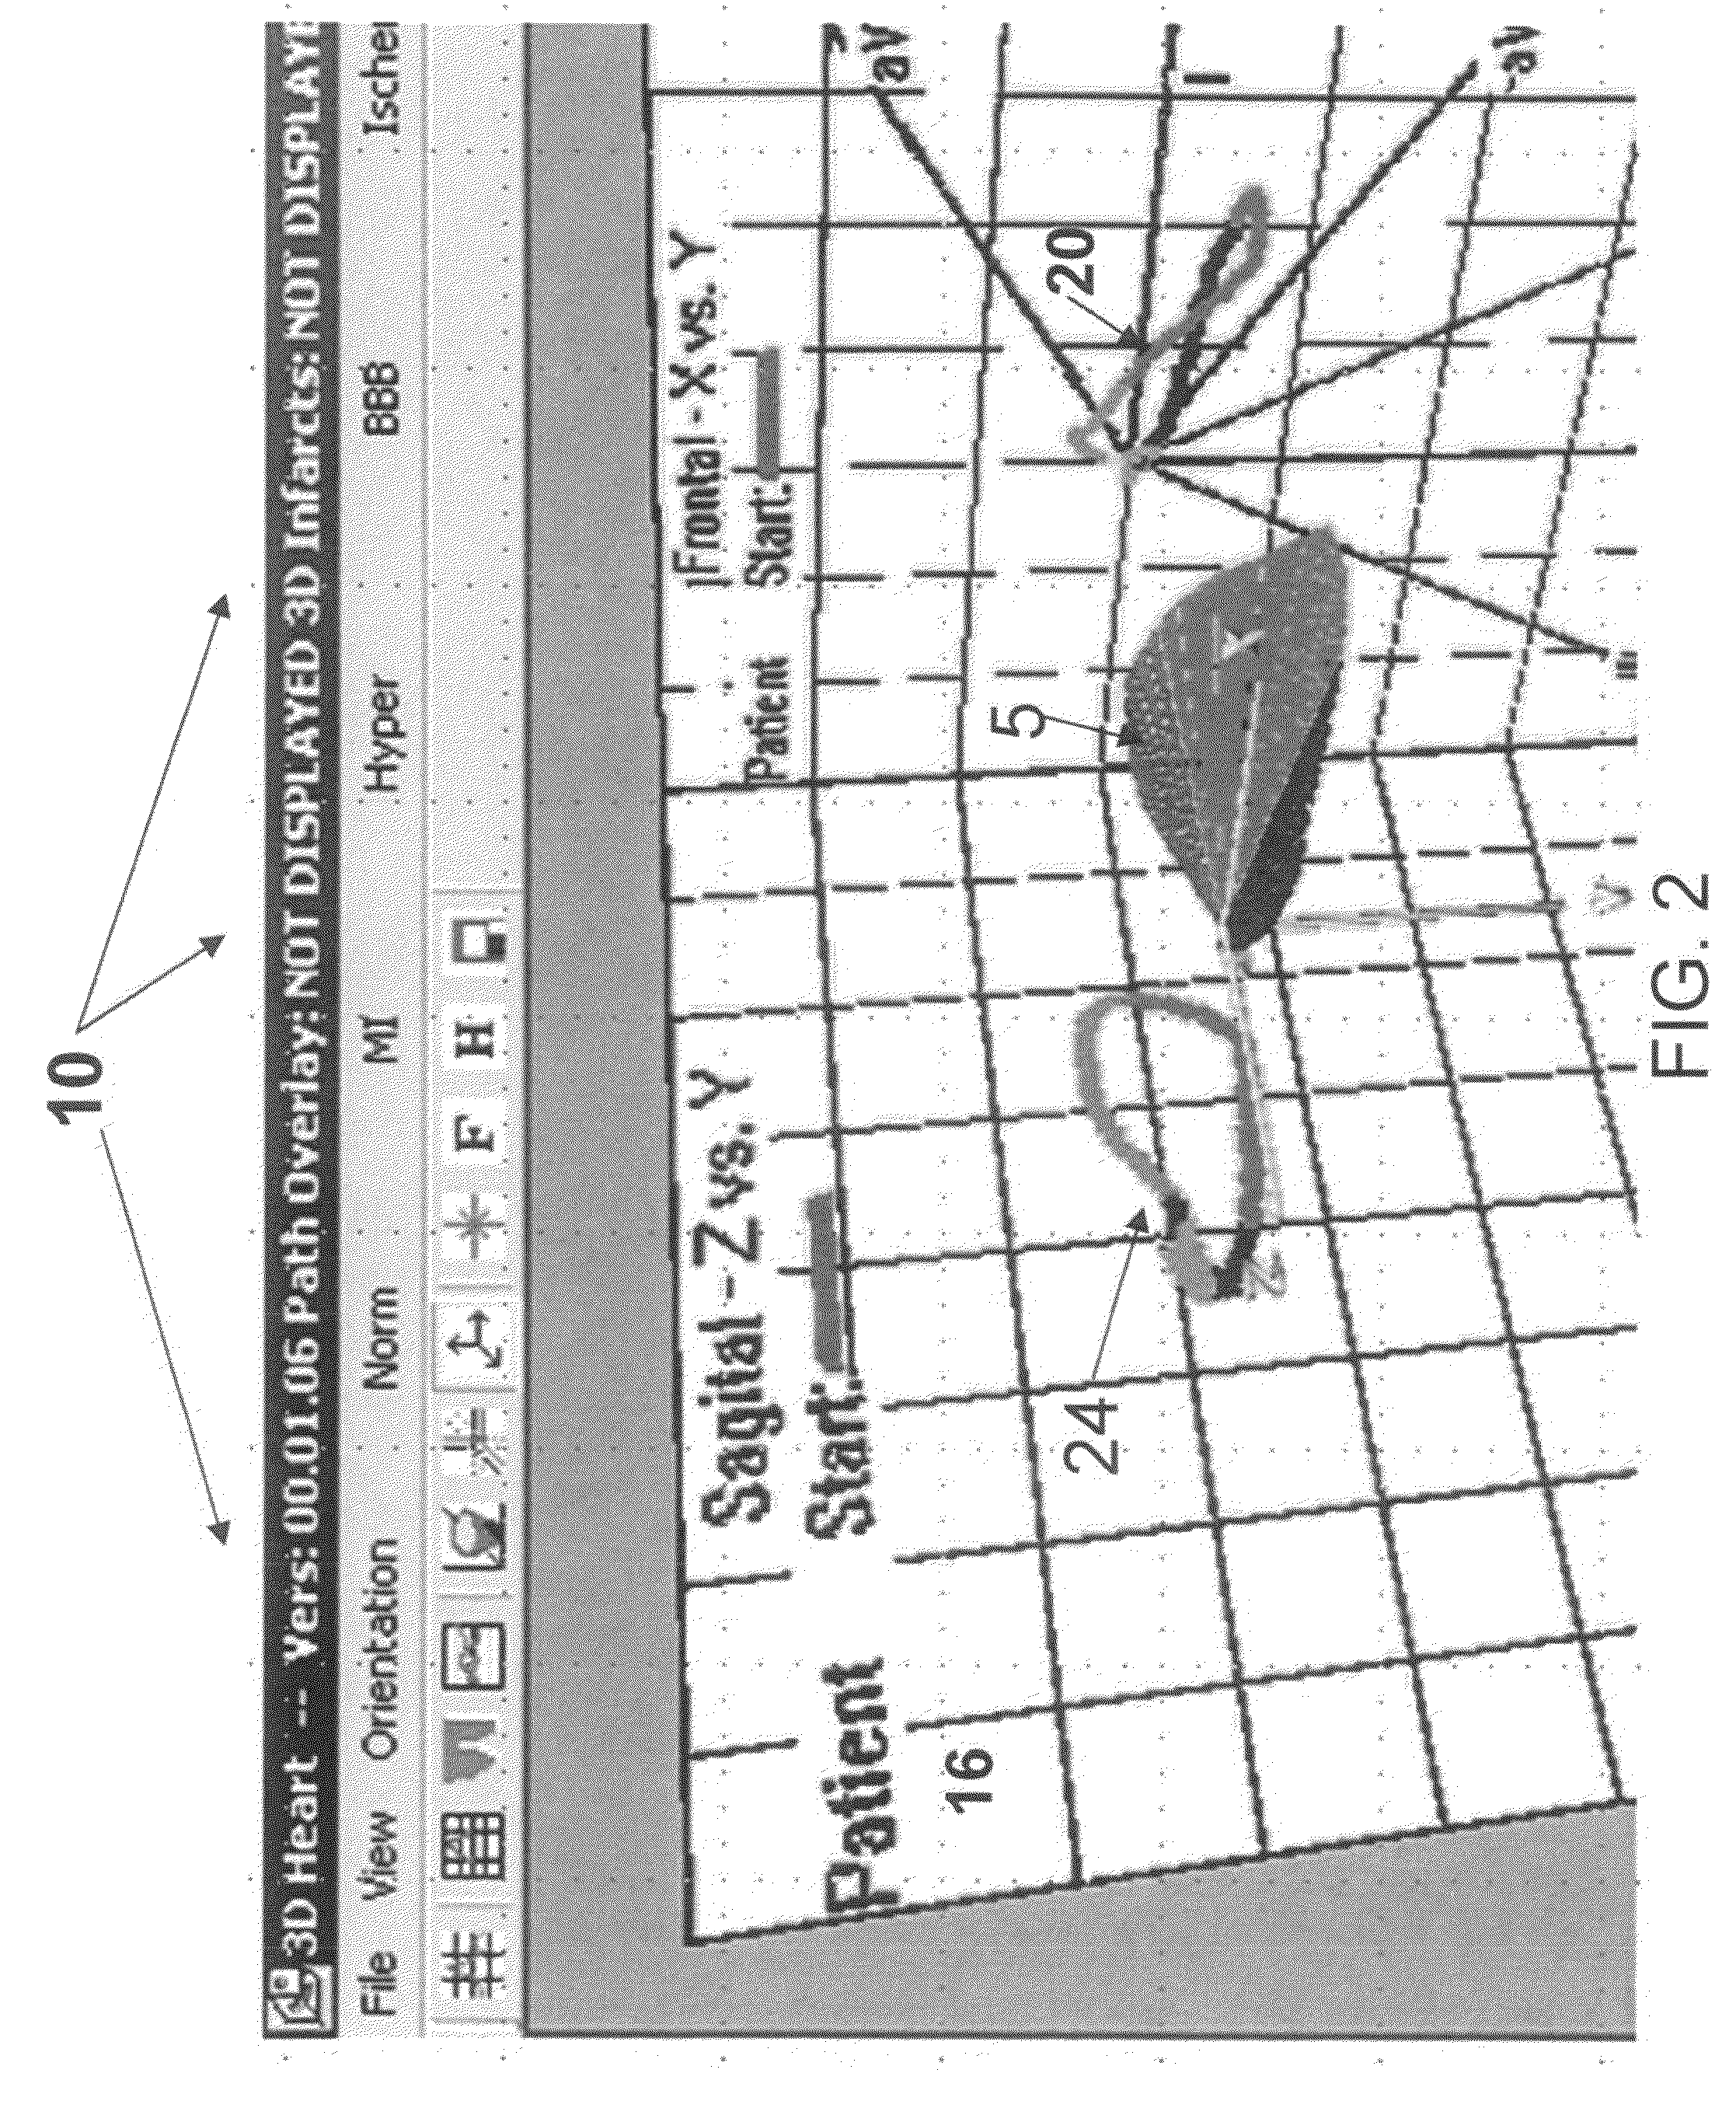
[0050]FIG. 1 illustrates a medical display or cardiographic diagnostic display 10 for displaying at least one segment of, or an entire, electrocardiograph (ECG) heart signal 12 having a magnitude and location in vector format within a single three-dimensional (3D) coordinate system (e.g., X, Y, Z as shown) which is sampled at incremental time intervals according to the present disclosure. More particularly, the display 10 displays and separates cardiac conditions into recognizable patterns of 3D vectors 14. The segments of the ECG signal 12 vector patterns may include a P-wave segment, a QRS segment, or a T-wave vecto...
PUM
 Abstract
Description
Claims
Application Information
 - R&D
- Intellectual Property
- Life Sciences
- Materials
- Tech Scout
- Unparalleled Data Quality
- Higher Quality Content
- 60% Fewer Hallucinations
Browse by: Latest US Patents, China's latest patents, Technical Efficacy Thesaurus, Application Domain, Technology Topic, Popular Technical Reports.
© 2025 PatSnap. All rights reserved.Legal|Privacy policy|Modern Slavery Act Transparency Statement|Sitemap|About US| Contact US: help@patsnap.com


