
Functional-Based Knowledge Analysis In A 2D and 3D Visual Environment

a knowledge analysis and functional technology, applied in the field of data visualization improvement, can solve the problems of difficult to represent in conjunction, and the effective incorporation of such 2d data into a 3d visual representation has proved to be a challenging problem

Active Publication Date: 2011-02-24
EXXONMOBIL UPSTREAM RES CO
View PDF49 Cites 22 Cited by
  • Summary
  • Abstract
  • Description
  • Claims
  • Application Information

AI Technical Summary

Benefits of technology

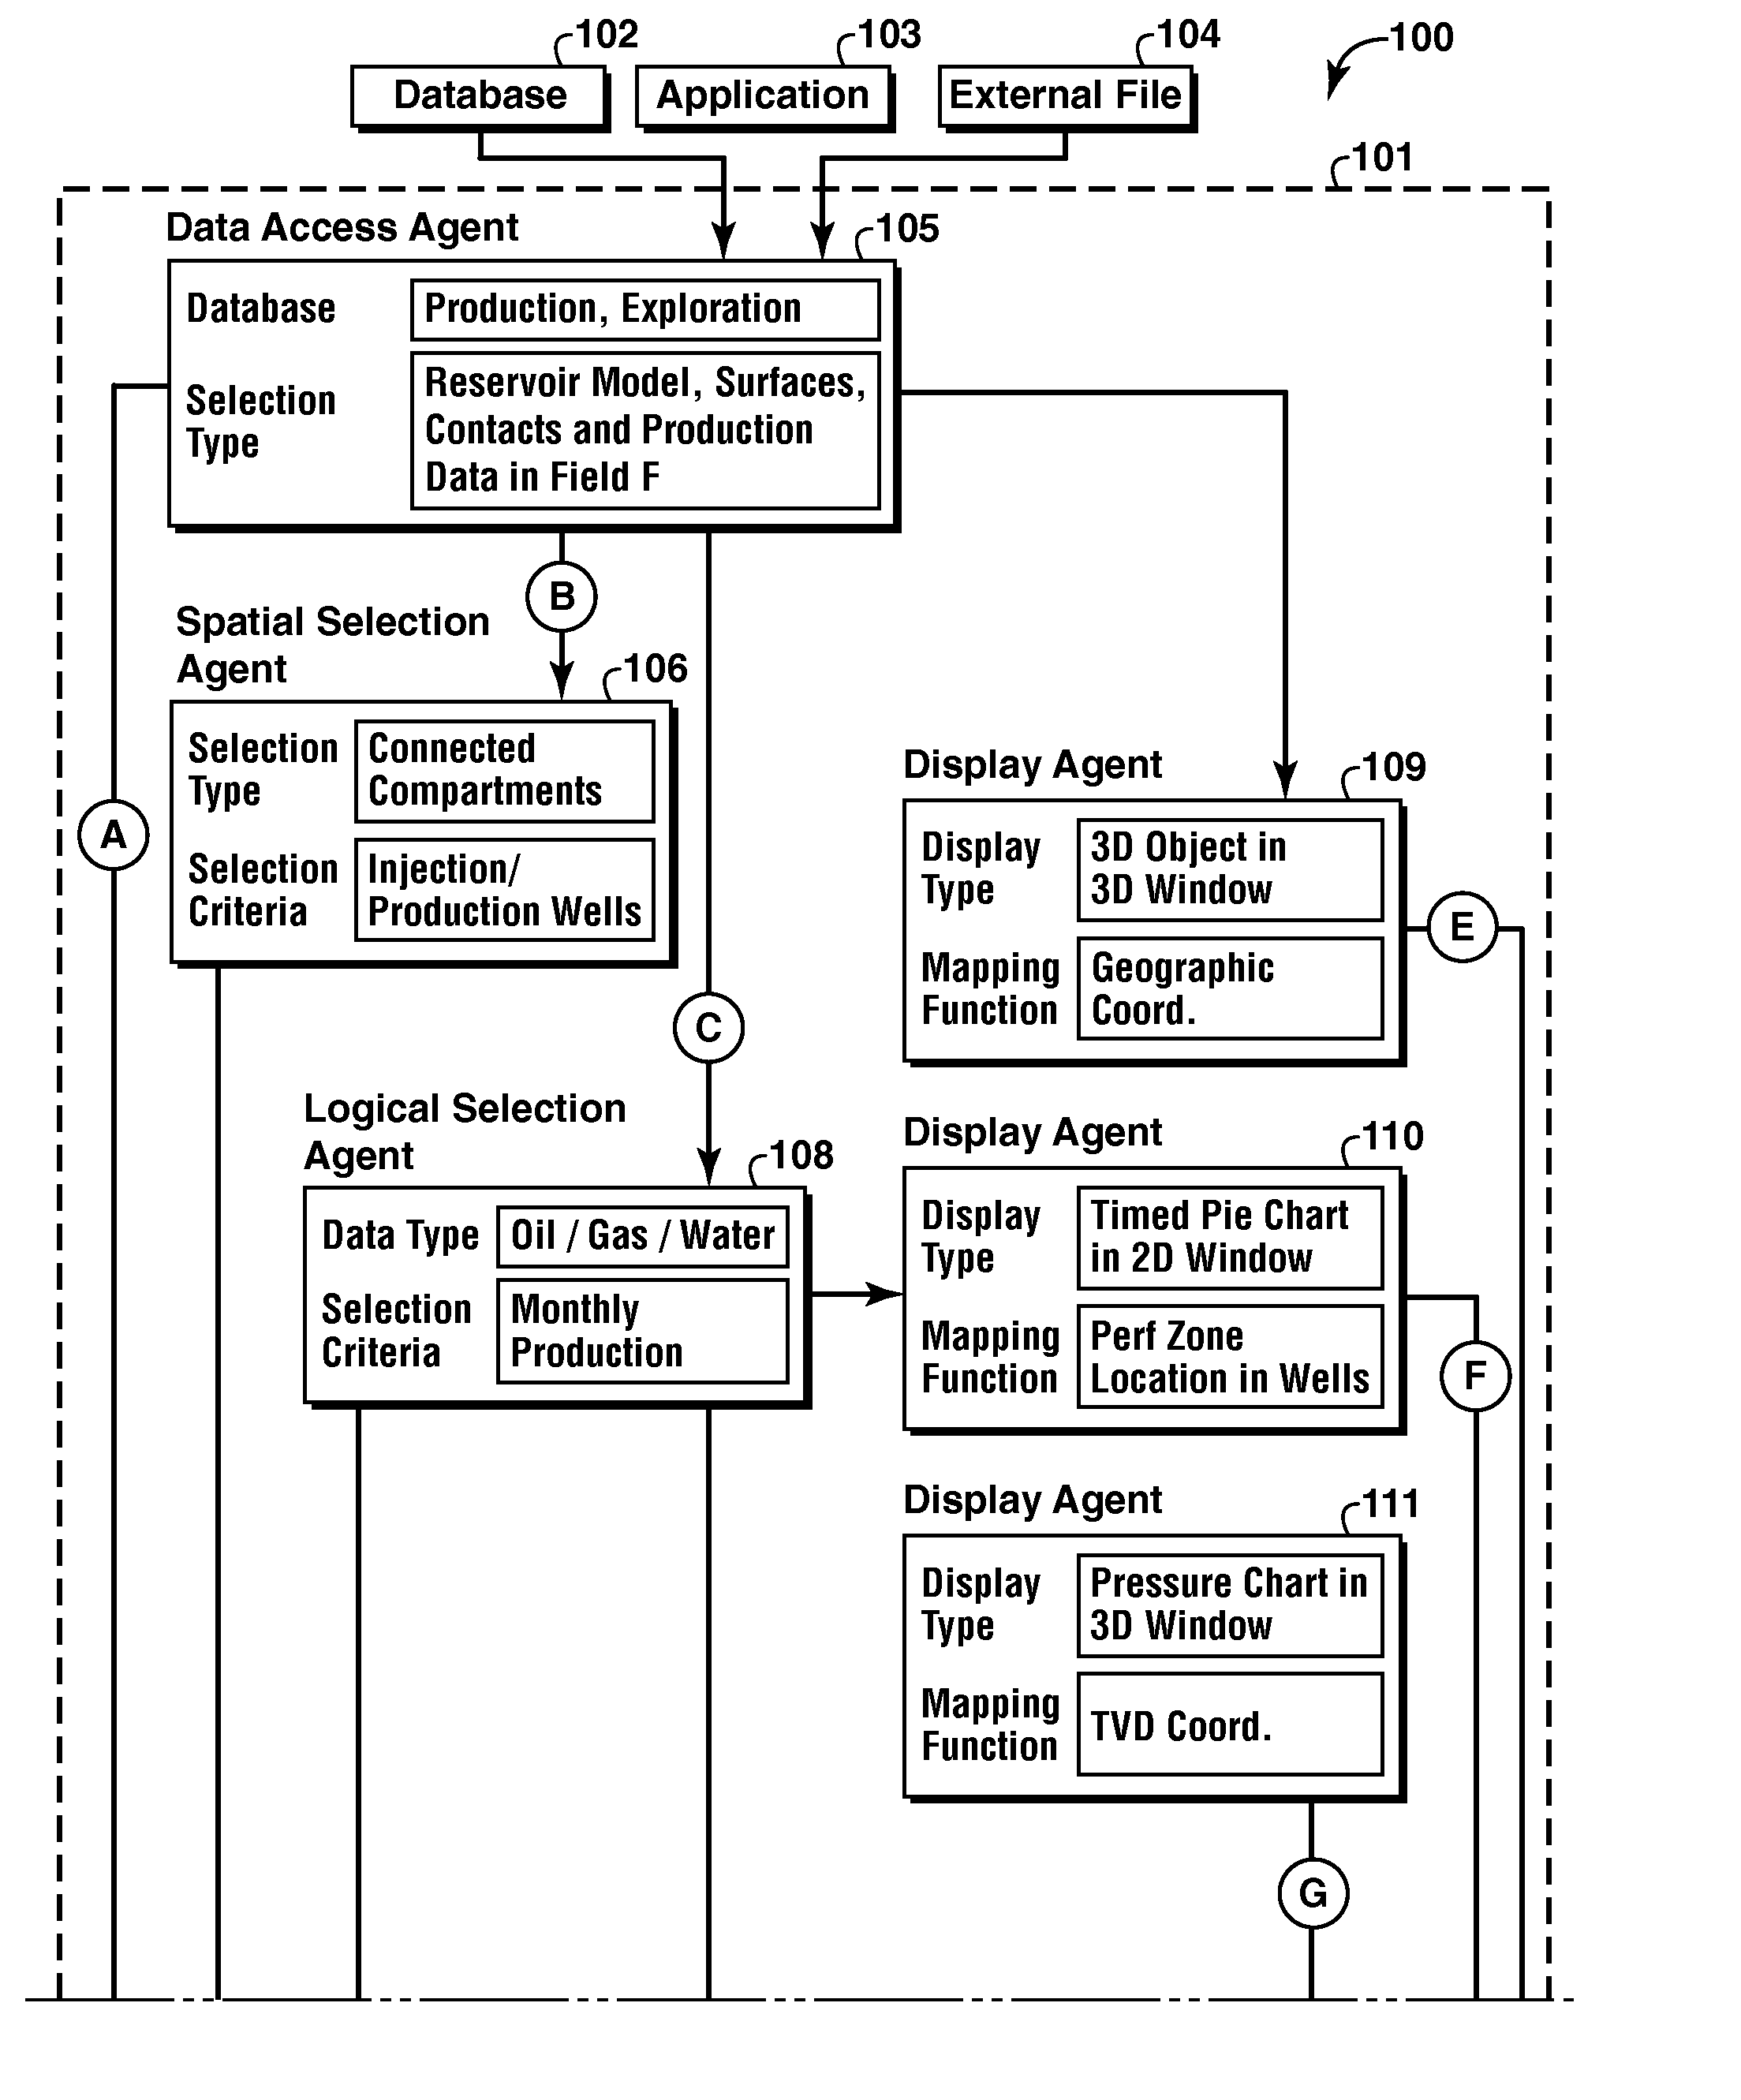
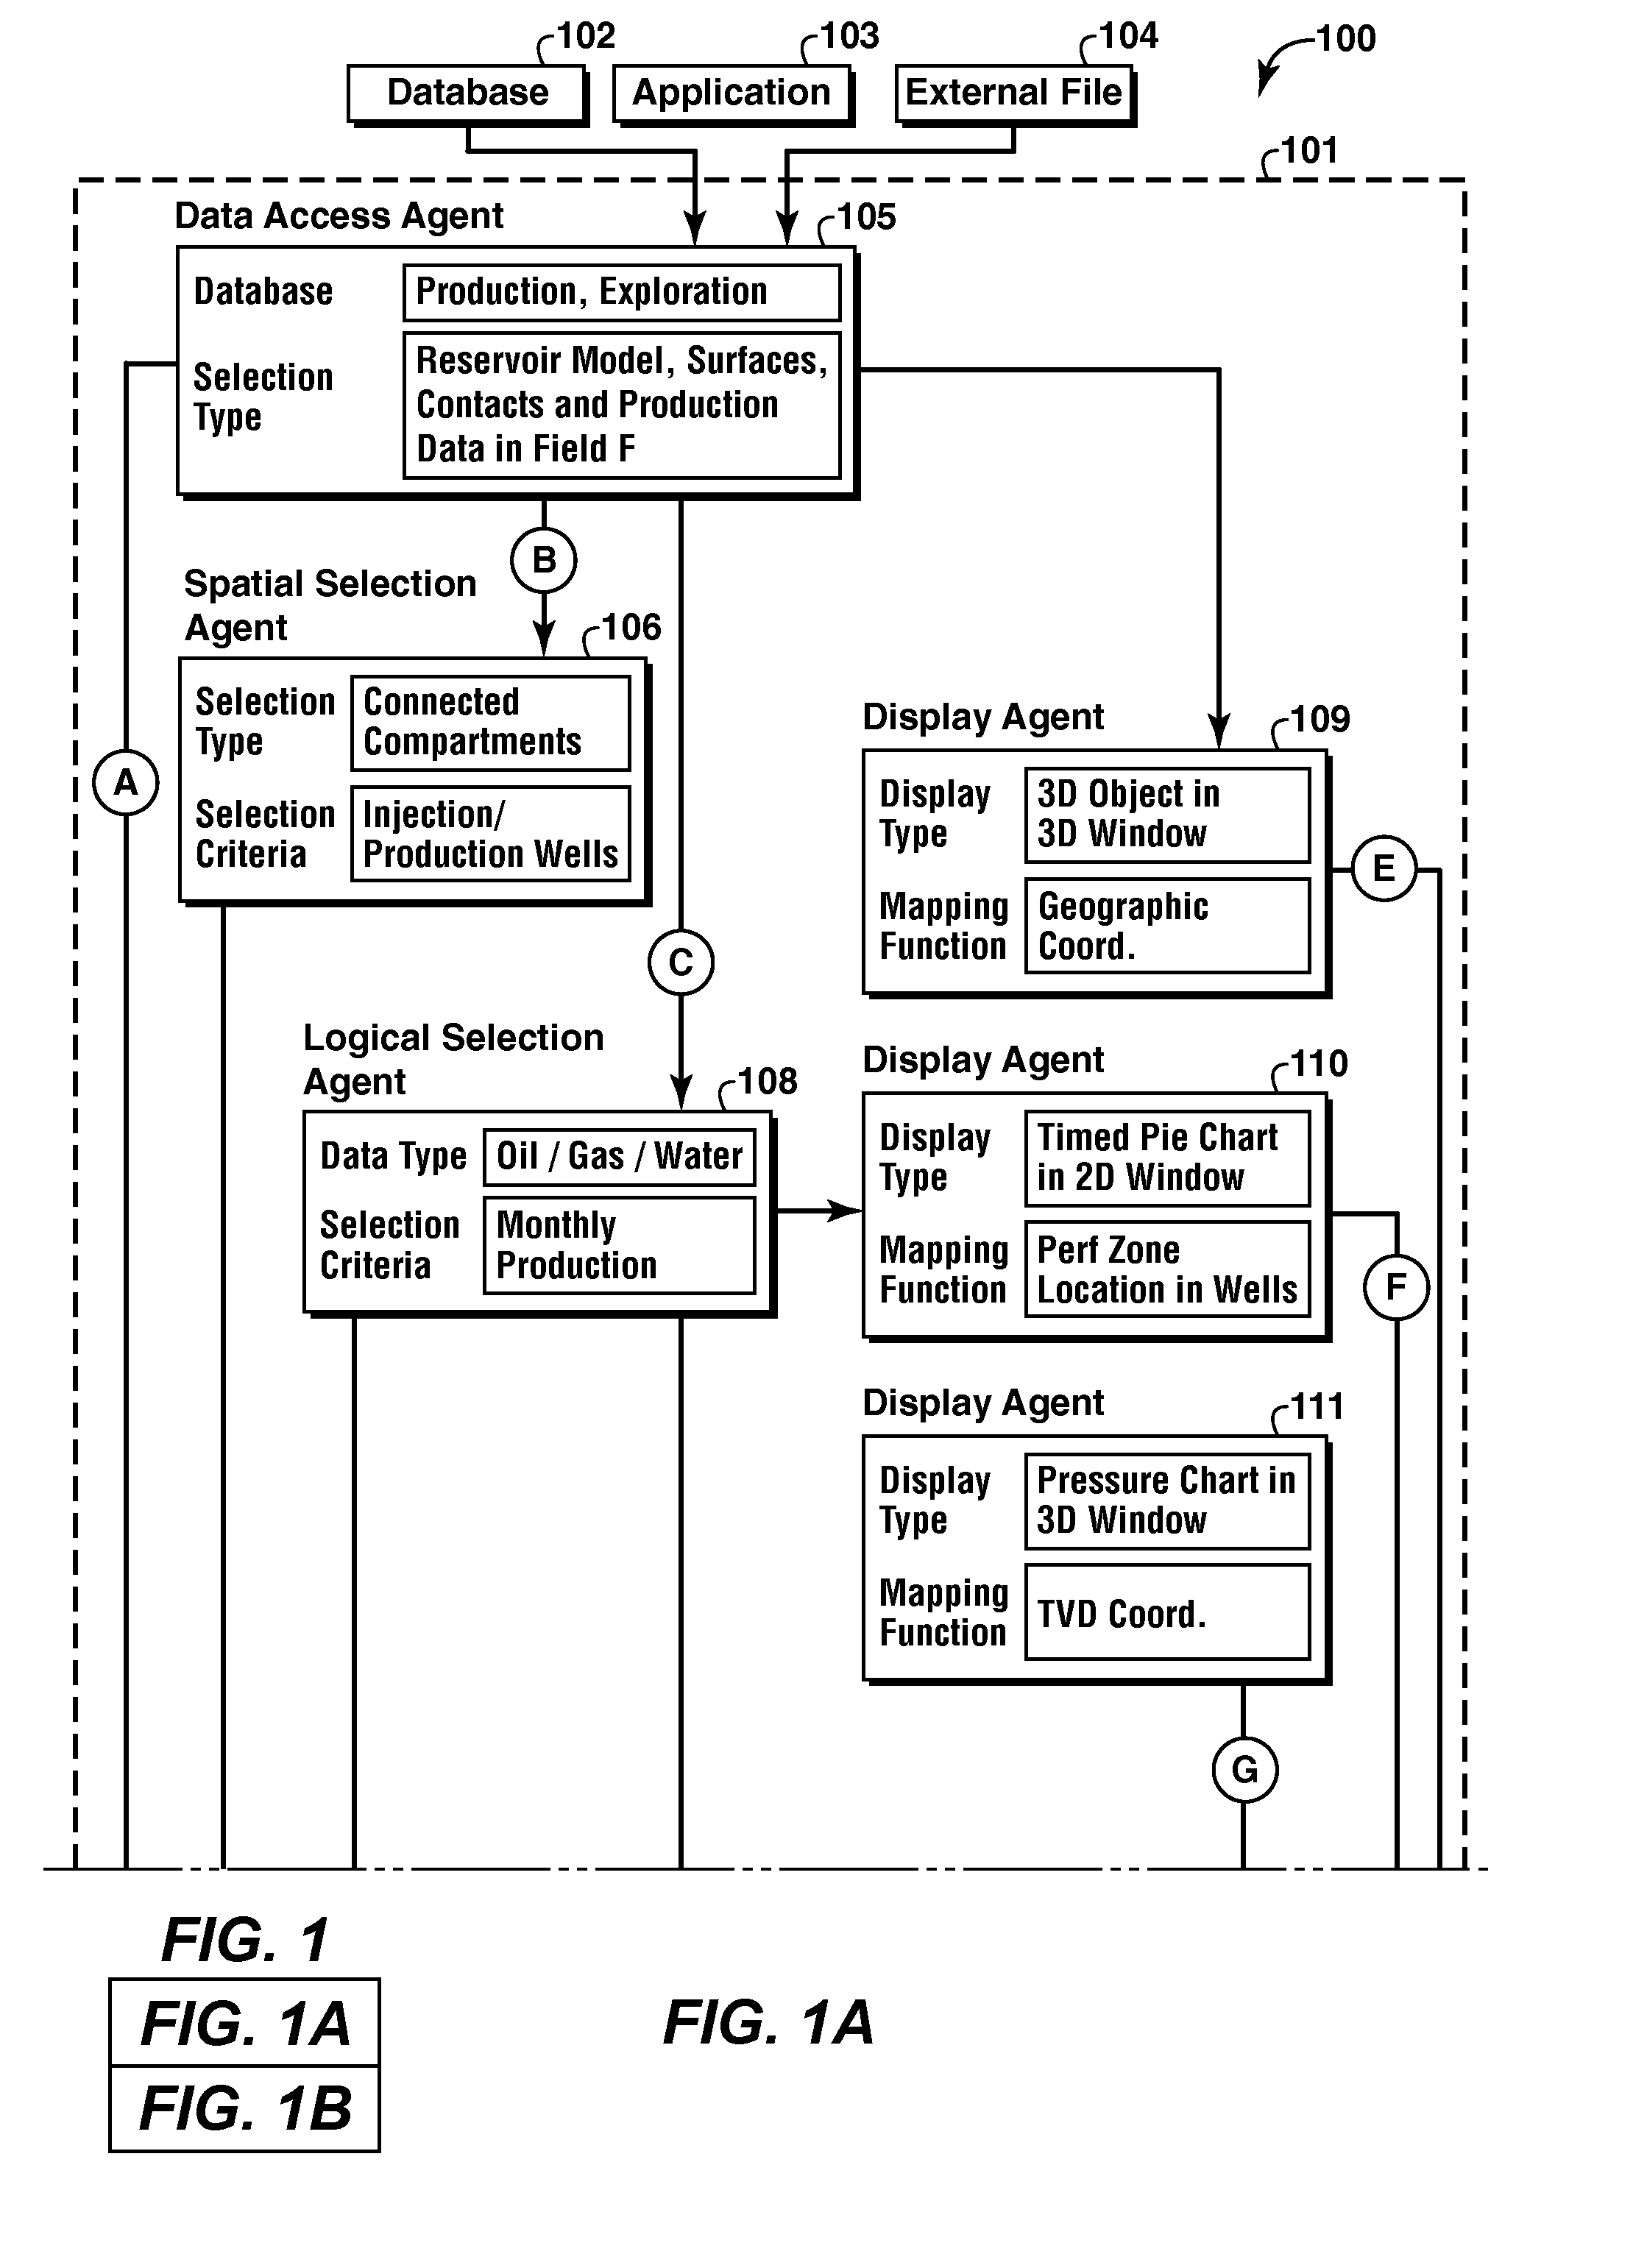
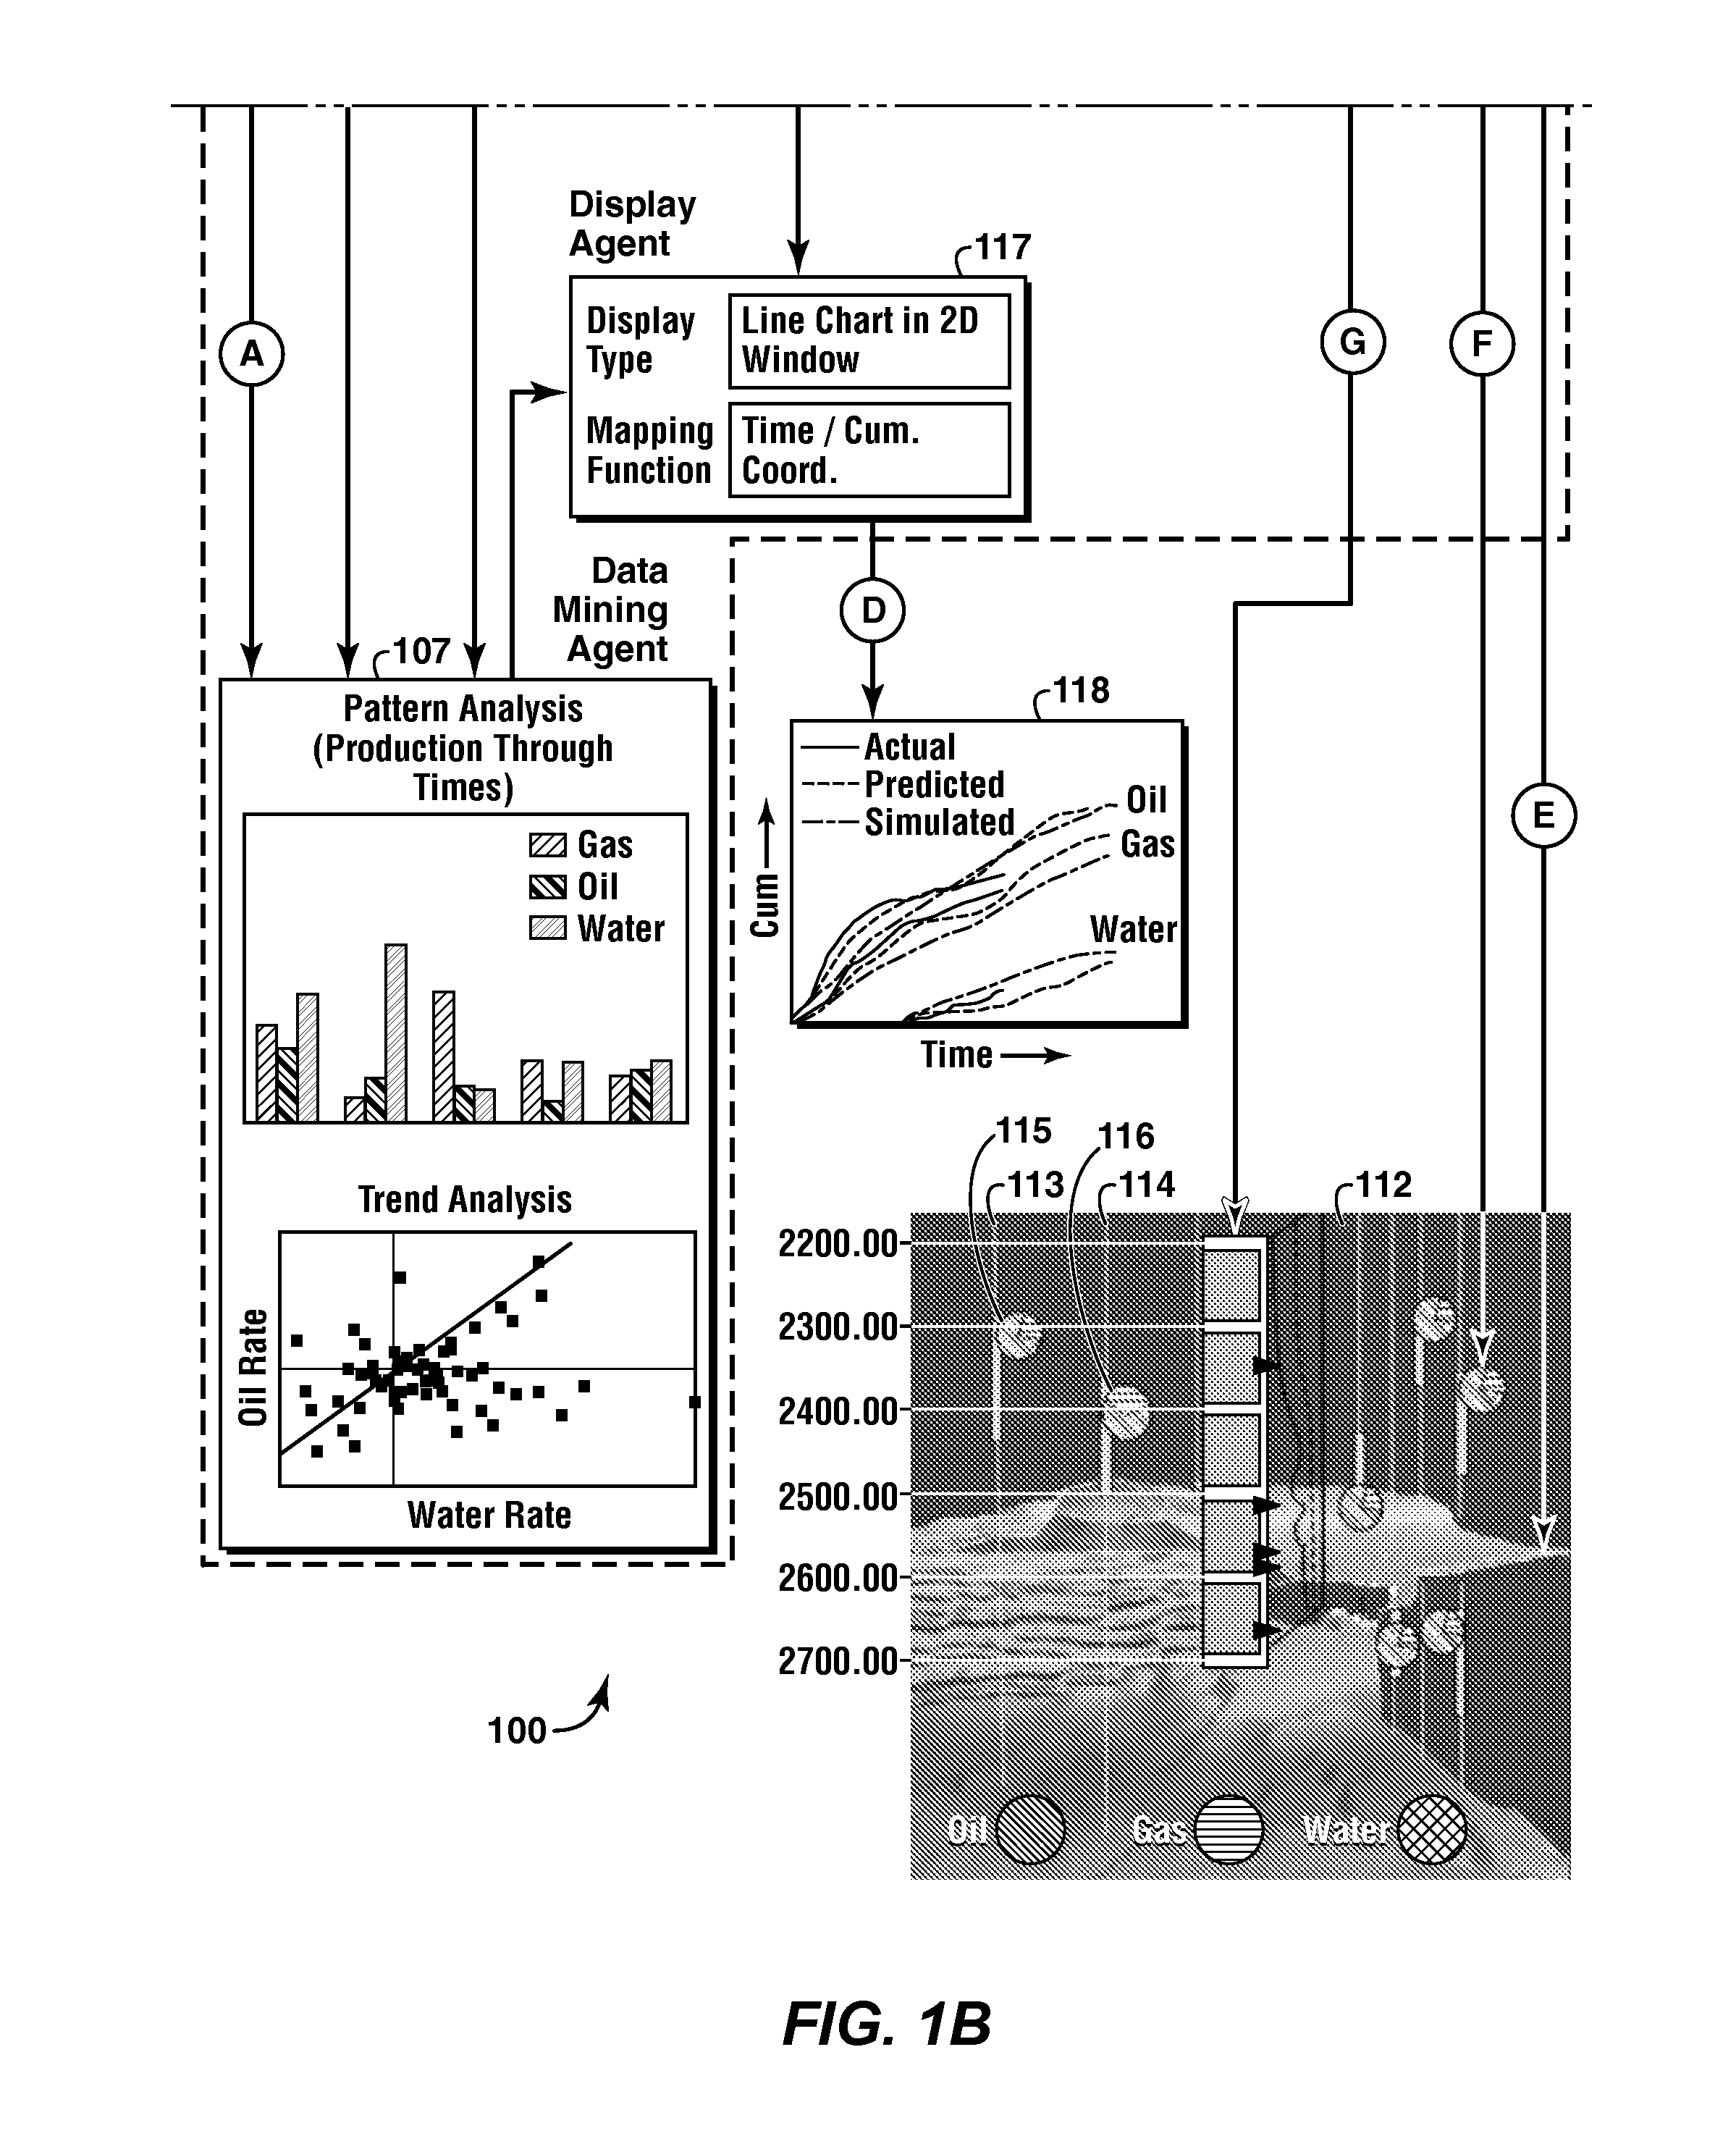
[0012]In accordance with the present invention, the set of knowledge agents may comprise at least one data access agent, at least one spatial selection agent, at least one logical selection agent, at least one data mining agent or at least one display agent. In one exemplary embodiment, a visual control panel corresponding to the integrated 2D / 3D visual display may be created by storing a state of at least one of the set of knowledge agents.

Problems solved by technology

Many engineering and geoscience data types, however, may be point or non-spatial data, which may be difficult to represent in conjunction with 3D data such as a visualization of a subsurface environment.
Effective incorporation of such 2D data into a 3D visual representation has proven to be a challenging problem.

Method used


Image

  • Functional-Based Knowledge Analysis In A 2D and 3D Visual Environment
  • Functional-Based Knowledge Analysis In A 2D and 3D Visual Environment
  • Functional-Based Knowledge Analysis In A 2D and 3D Visual Environment

Examples


Embodiment Construction

[0017]An exemplary embodiment of the present invention effectively combines the ability to present 3D data with other types of data from a variety of sources. One exemplary embodiment of the present invention is adapted for use in providing a visualization of data relating to a 3D shared earth environment. Examples of point or non-spatial data that may be incorporated into such a visualization include drilling information, daily / monthly production data, geochemical or geomechanical analysis results, production measurements or the like. Such point or non-spatial data types are typically not stored or displayed within a 3D earth model. Instead, the point or non-spatial data tends to be stored in databases or spreadsheets and displayed as 2D diagrams (e.g. XY plots, pie charts or the like). Comprehension of these data types, however, could be improved by effectively and interactively integrating the data into 3D models. Moreover, the usefulness of the data to predict or explain subsurf...


PUM


Abstract

A method of creating a visual display based on a plurality of data sources is provided. An exemplary embodiment of the method comprises extracting a set of extracted data from the plurality of data sources and processing at least a portion of the extracted data with a set of knowledge agents according to specific criteria to create at least one data assemblage. The exemplary method also comprises providing an integrated two-dimensional / three-dimensional (2D / 3D) visual display in which at least one 2D element of the at least one data assemblage is integrated into a 3D visual representation using a mapping identifier and a criteria identifier.

Description

CROSS-REFERENCE TO RELATED APPLICATION[0001]This application claims the benefit of U.S. Provisional Patent Application 61 / 125,088 filed Apr. 22, 2008 entitled FUNCTIONAL-BASED KNOWLEDGE ANALYSIS IN A 2D AND 3D VISUAL ENVIRONMENT, the entirety of which is incorporated by reference herein.FIELD OF THE INVENTION[0002]The present invention relates to improving the creation of visualizations of data. In particular, an exemplary embodiment of the present invention relates to a system and method for integrating a wide range of data sources and producing an integrated two-dimensional (2D) / three-dimensional (3D) visual display based on the data.BACKGROUND OF THE INVENTION[0003]Three-dimensional model construction and visualization has been widely accepted by numerous disciplines as a mechanism for analyzing, communicating, and comprehending complex 3D relationships. Examples of structures that can be subjected to 3D analysis include the earth's subsurface, facility designs and the human body...

Claims


Application Information

Patent Timeline
Patent Type & Authority Applications(United States)
IPC IPC(8): G06K9/00
CPCG06F17/30554G01V1/34G06F16/248
Inventor HOLL, JAMES E.CHENG, YAO-CHOUDOBIN, MARK W.SCHUETTE, JOHN F.KIM, CHUL-SUNGSCHMIDTKE, ERIC A.
Owner EXXONMOBIL UPSTREAM RES CO
Learn More