User Interface for Data Comparison

a data comparison and user interface technology, applied in the field of user interfaces, can solve the problems of complex and expensive processes, tedious manual comparison, and writing customized reports,

Active Publication Date: 2012-10-25
SAP AG
View PDF28 Cites 137 Cited by
  • Summary
  • Abstract
  • Description
  • Claims
  • Application Information

AI Technical Summary

Problems solved by technology

Such manual comparison can be a tedious and slow process.
However, writing customized reports can be a complex task in itself, requiring expertise with the database system.
Often, enterprises engage in complex and expensive processes of gathering requirements from business experts, preparing specifications for experts in reporting systems, and go through the development cycles for preparing customized reports required by the business experts.

Method used


Image

  • User Interface for Data Comparison
  • User Interface for Data Comparison
  • User Interface for Data Comparison

Examples


Embodiment Construction

[0022]Reference will now be made in detail to several embodiments, examples of which are illustrated in the accompanying figures. It is noted that wherever practicable similar or like reference numbers may be used in the figures and may indicate similar or like functionality. The figures depict embodiments of the disclosed system (or method) for purposes of illustration only. One skilled in the art will readily recognize from the following description that alternative embodiments of the structures and methods illustrated herein may be employed without departing from the principles described herein.

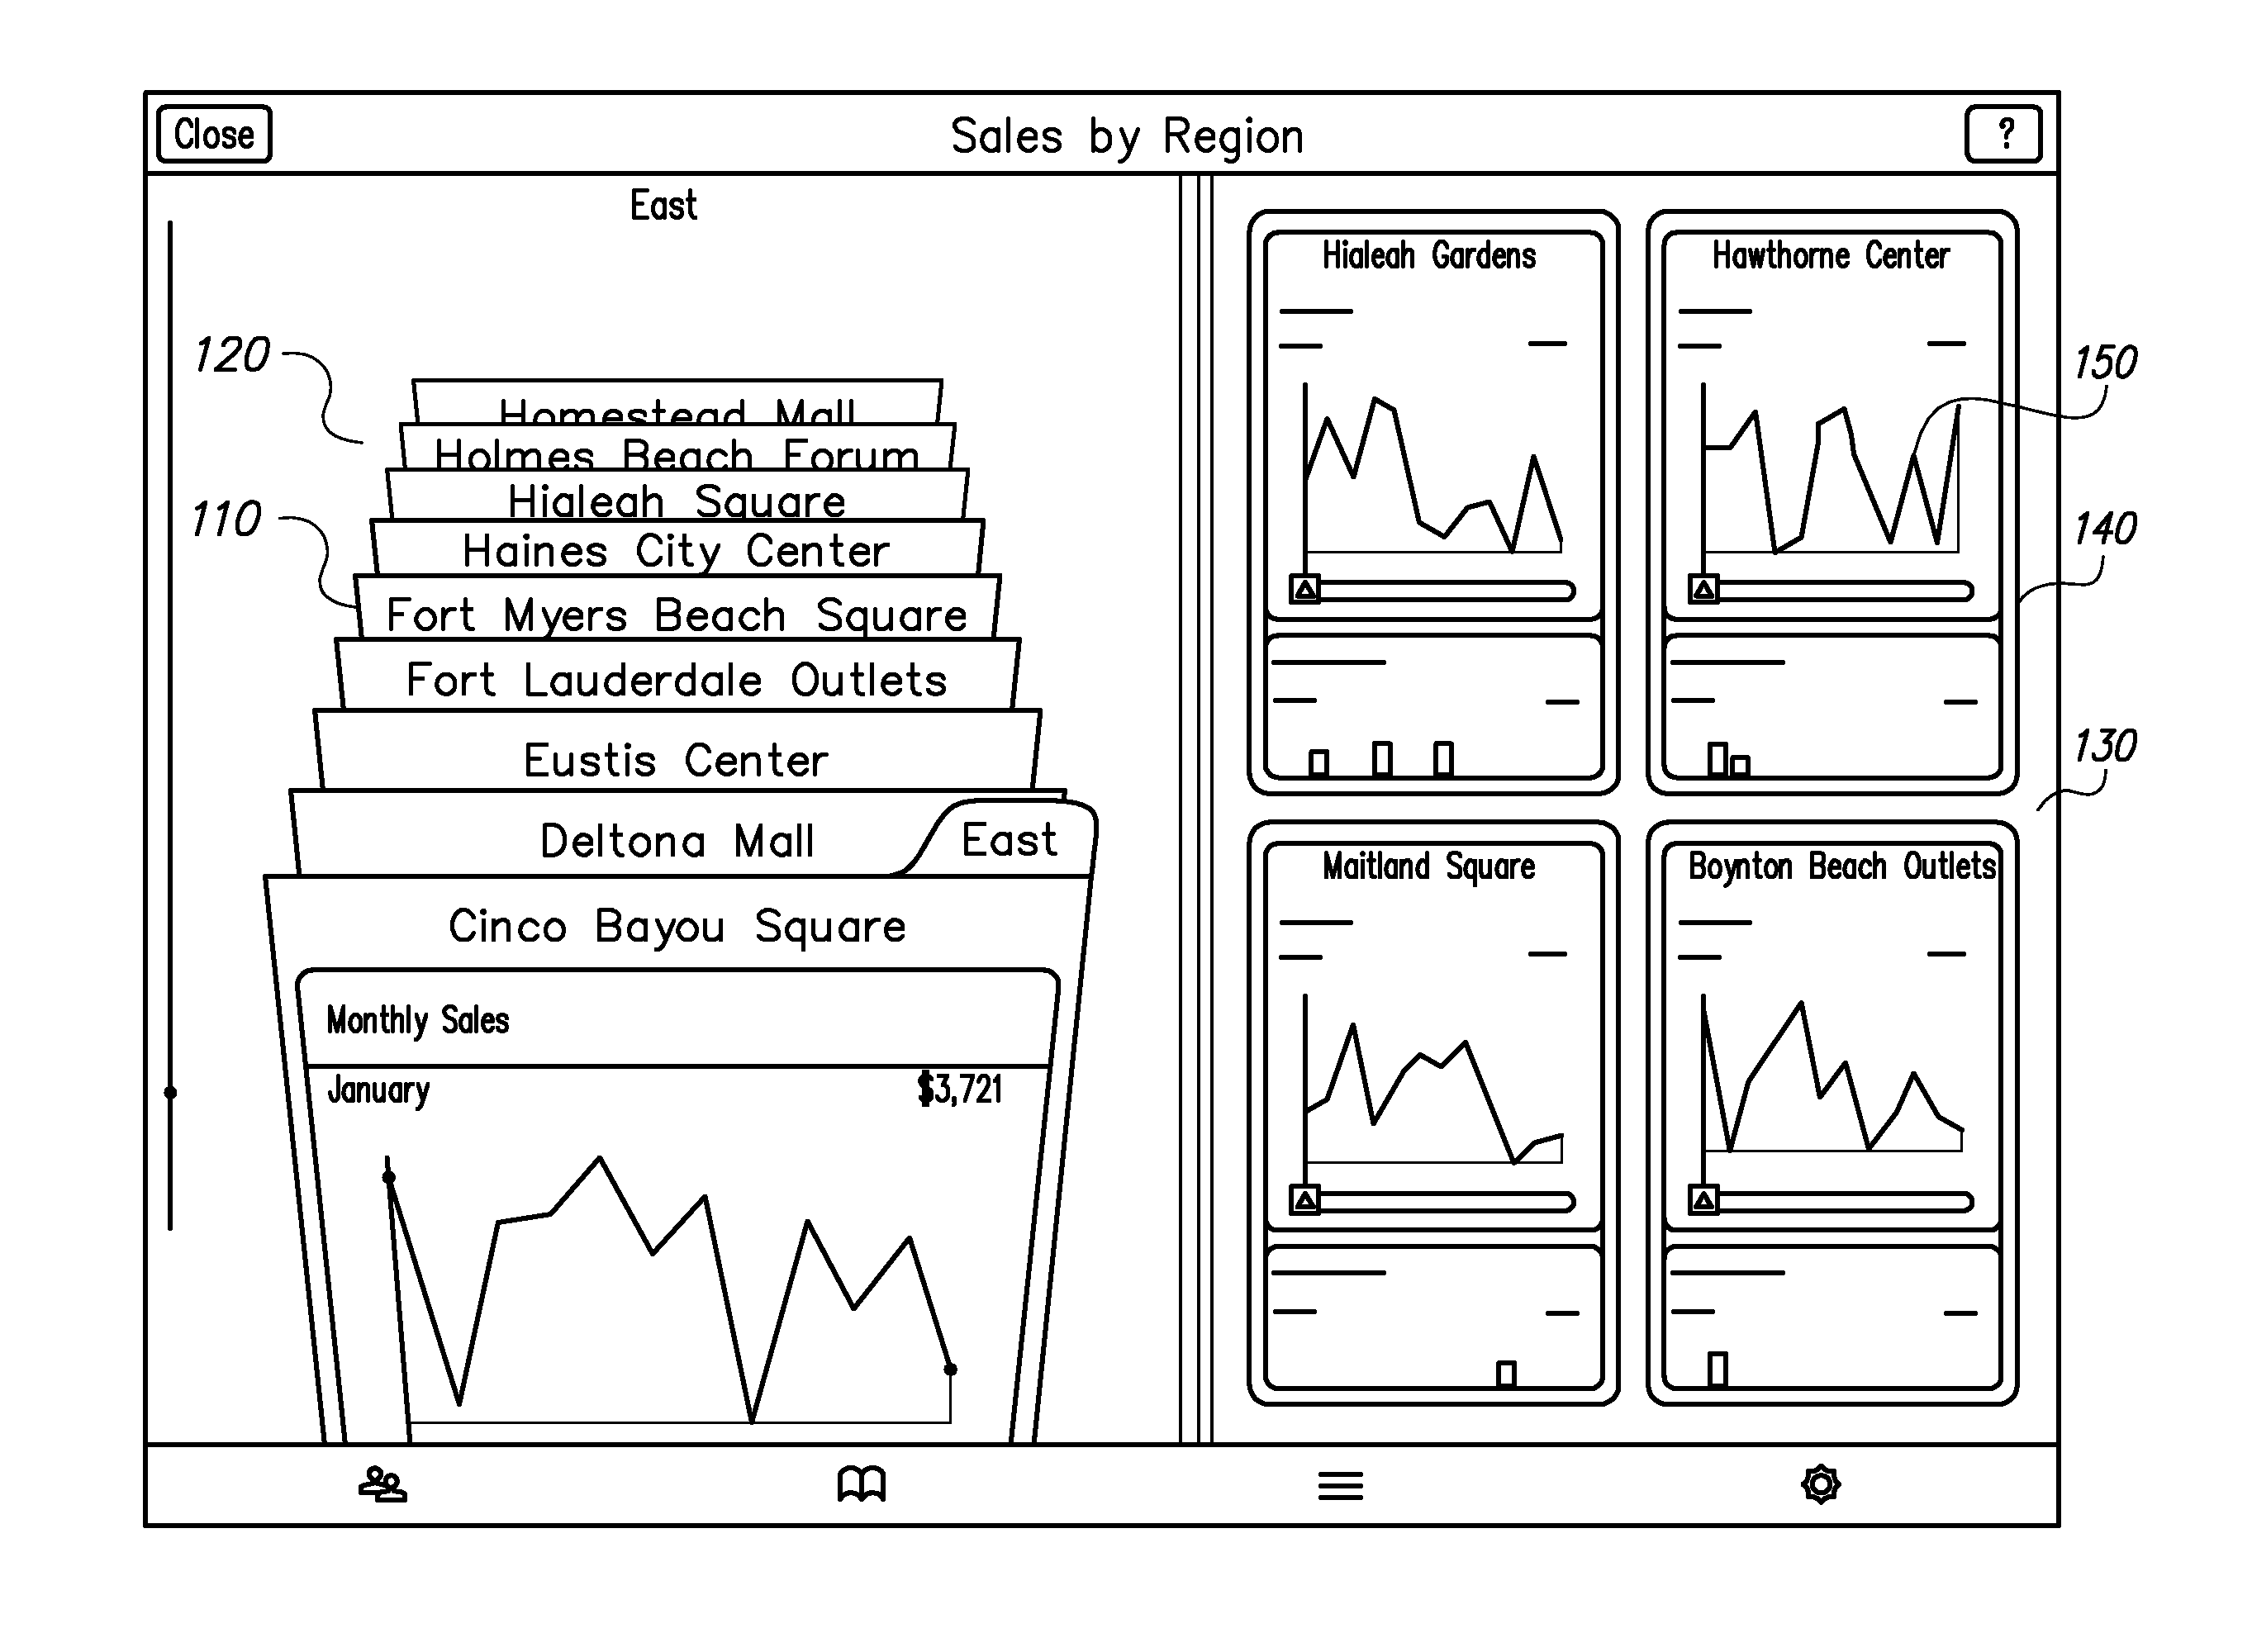
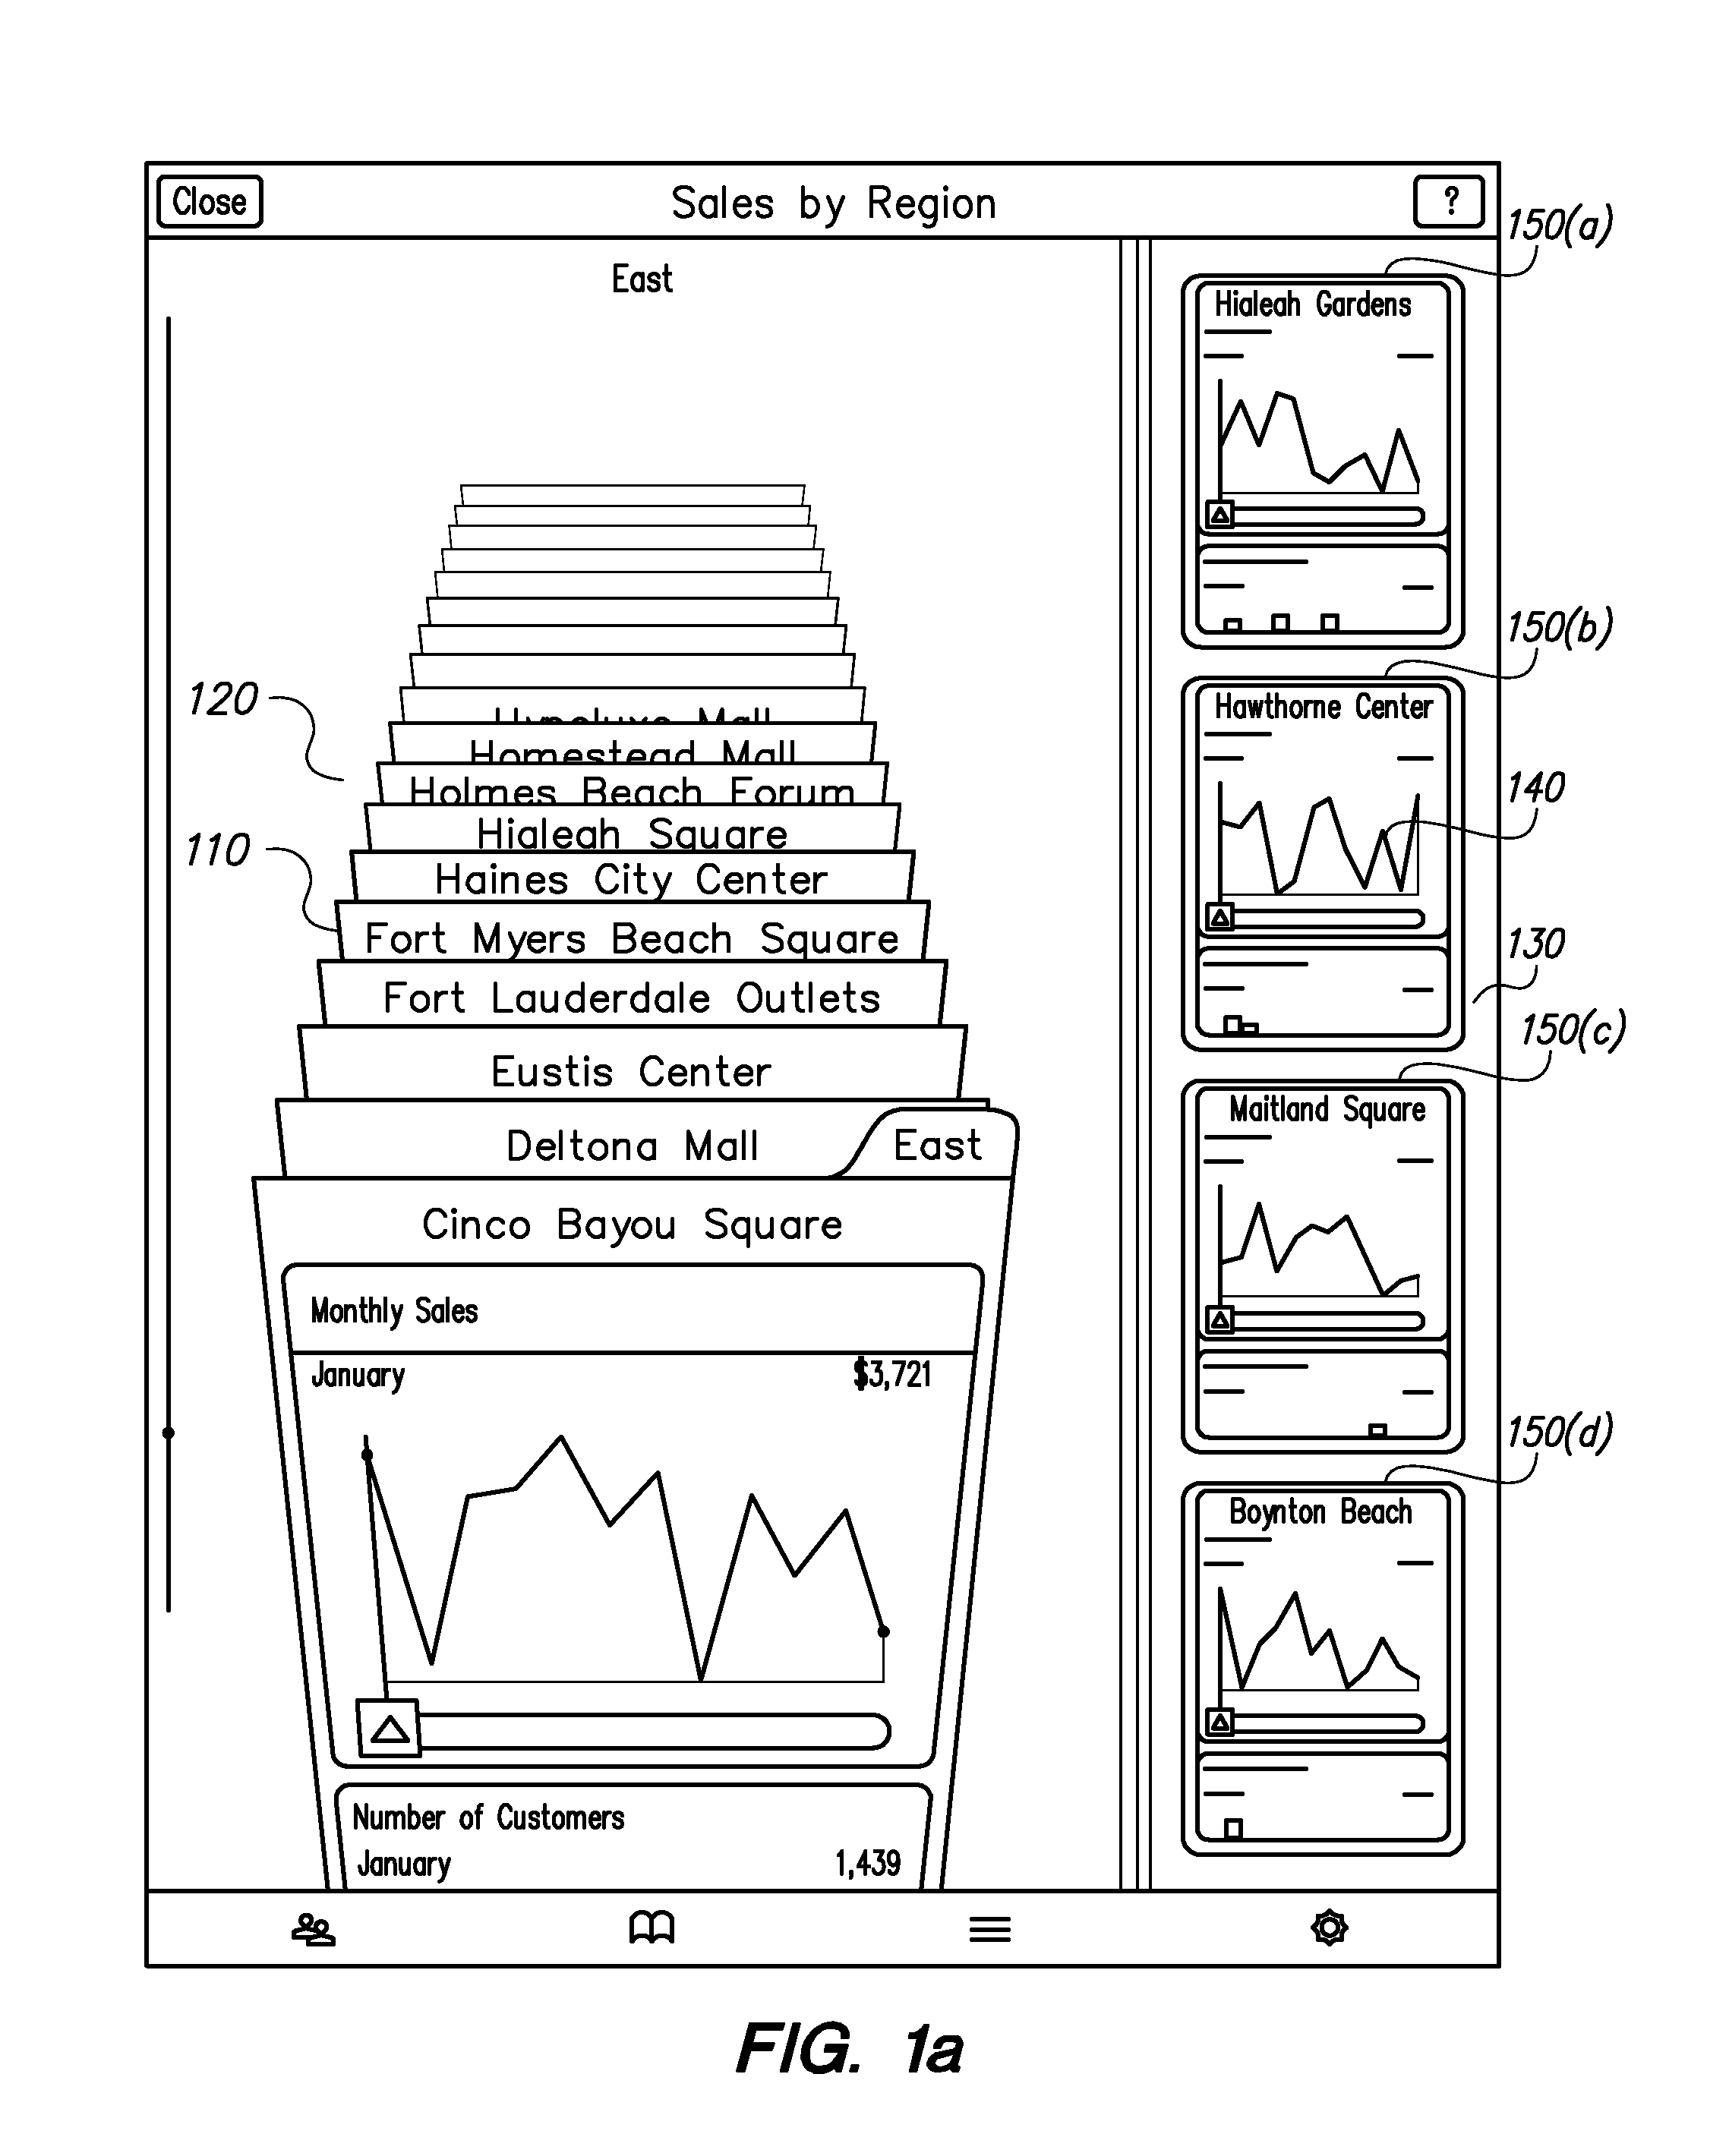
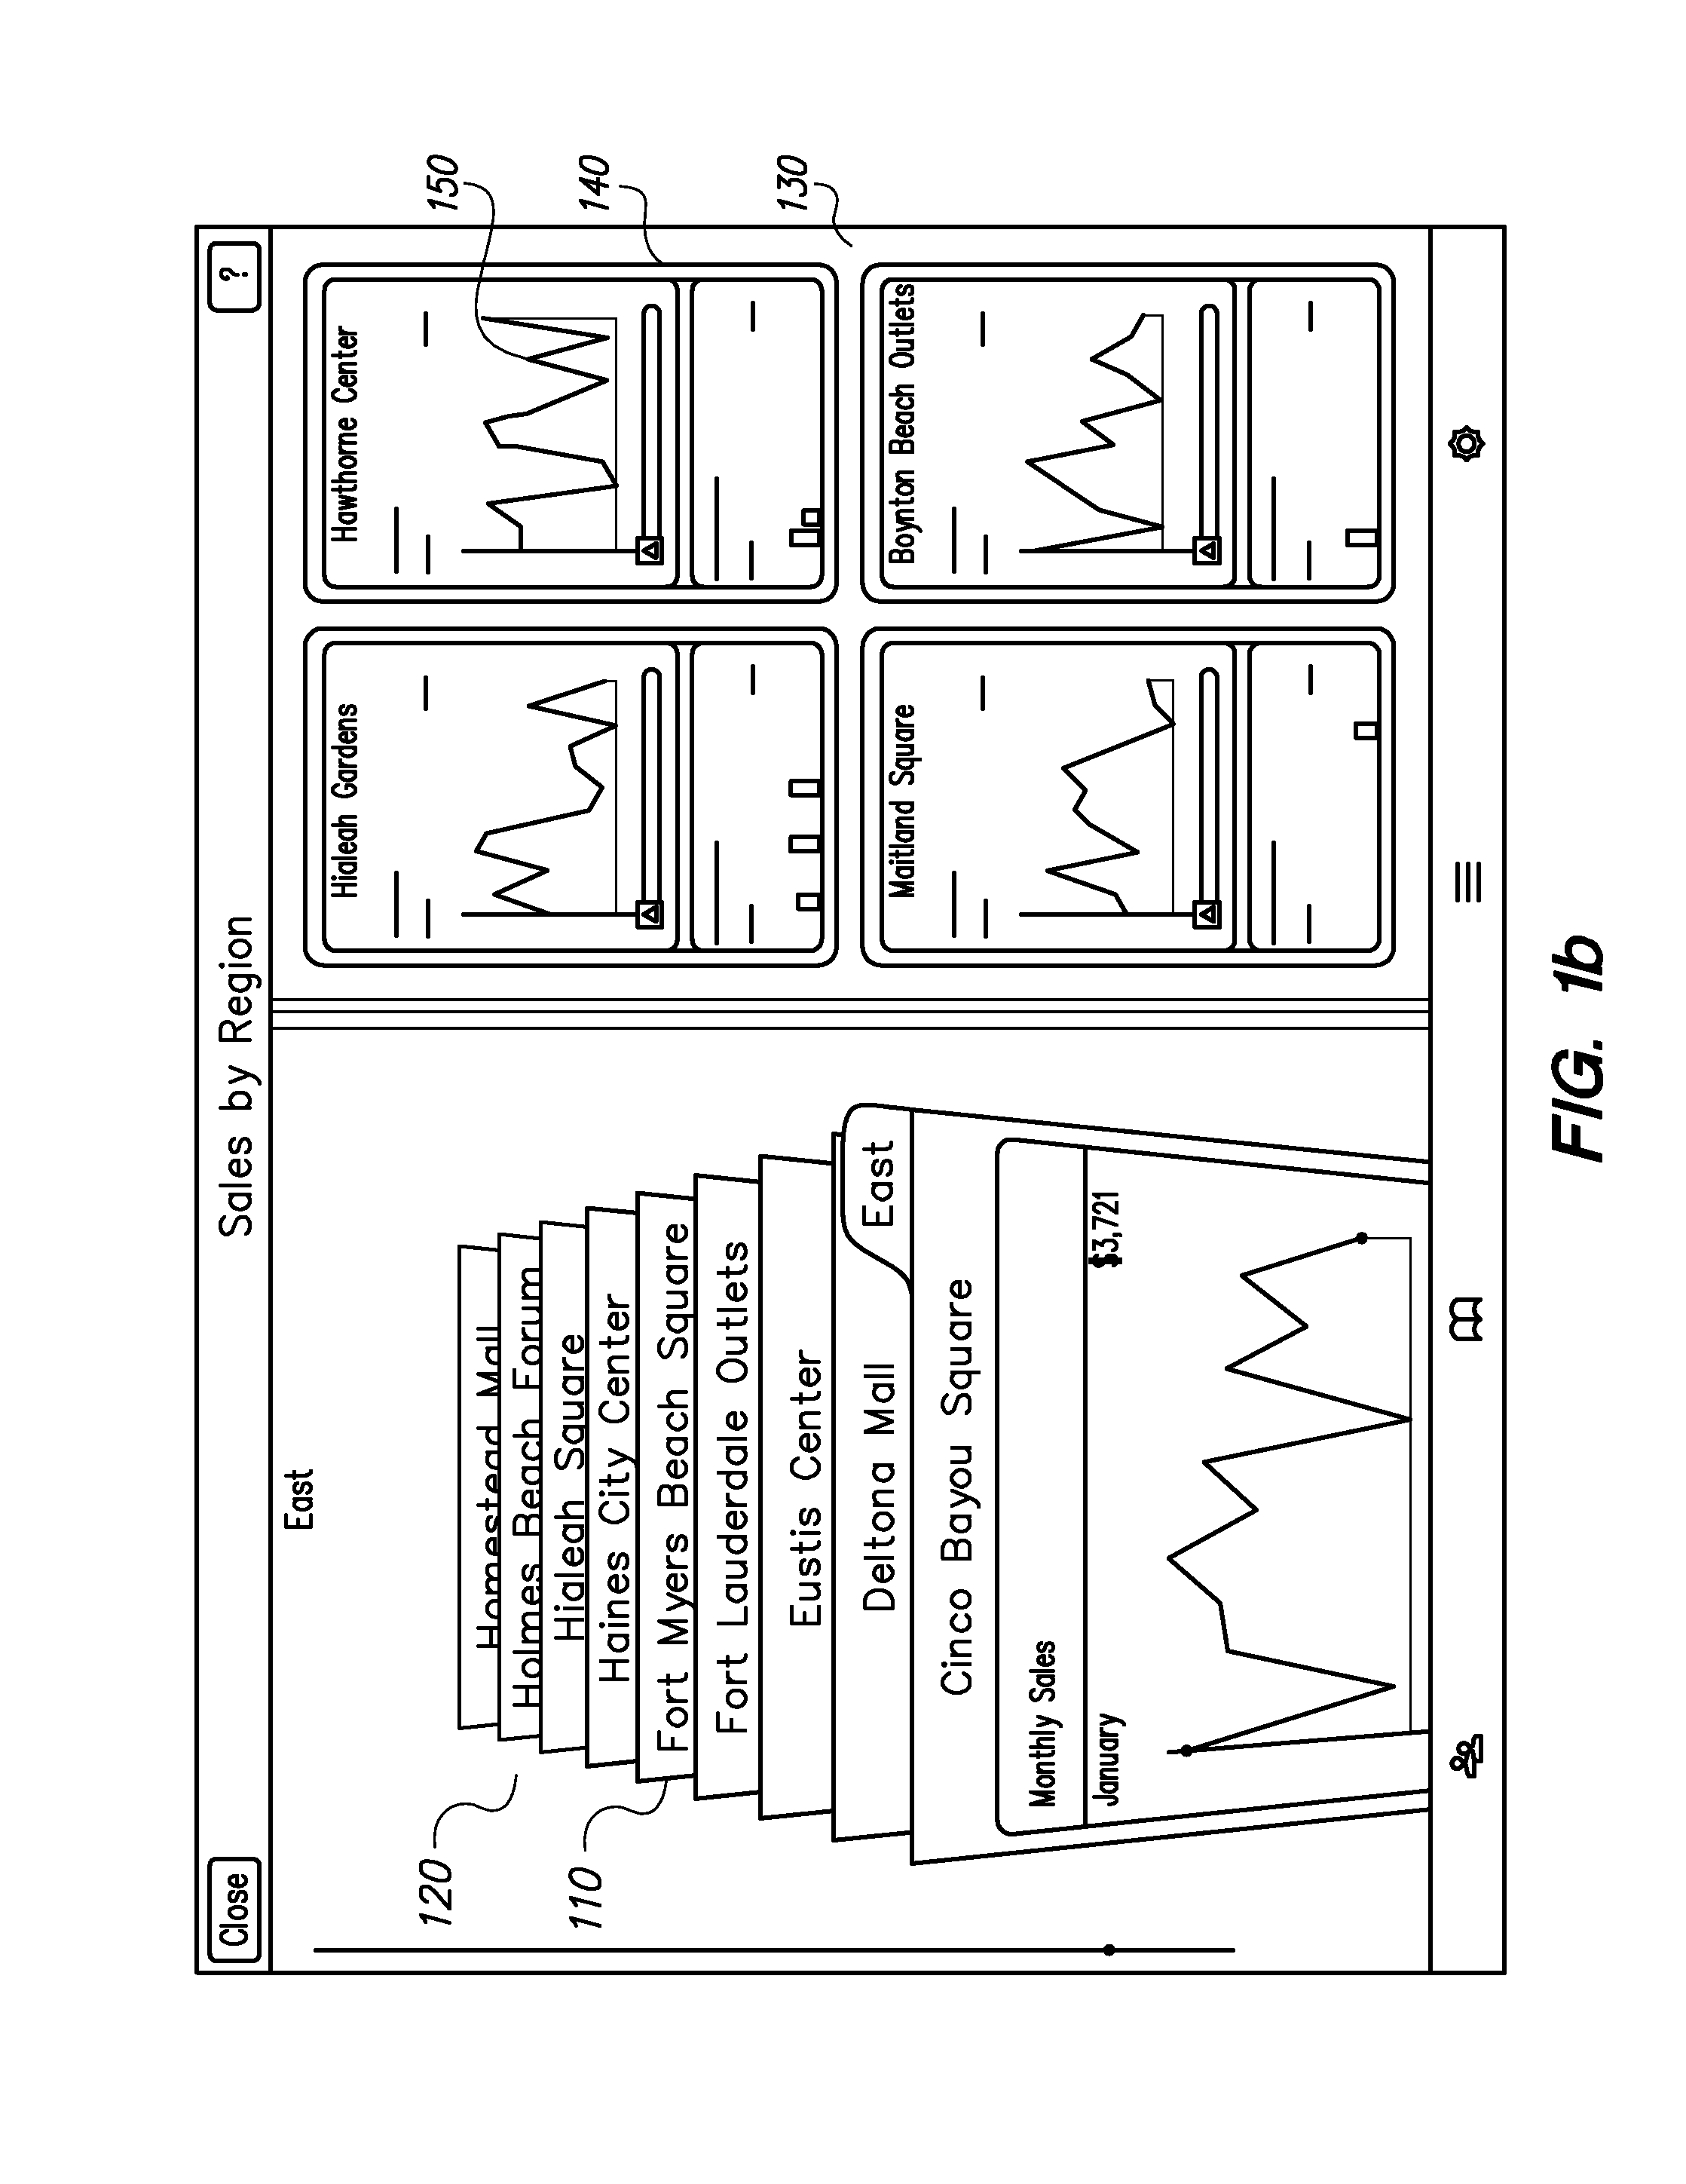
[0023]FIGS. 1(a) and 1(b) show graphical user interfaces displaying a simulated catalogue 120 of data records for allowing a user to select data records for comparison, in accordance with an embodiment of the invention. The data records 110 may represent pages of data from a report stored in the database. A user performs a swiping motion that causes the cards of the simulated catalogue 120...


PUM


Abstract

Systems and methods perform comparison of data represented as charts, for example, bar graphs, pie charts, line charts or stacked bar charts. The charts present visual representations mapping source values to target values. A user can select charts associated with a data records for comparison from an index of data records. The user selects a chart and a particular source value from the reference chart. The target values corresponding to the source value from other charts are compared against the target value from the reference chart. An aggregate of the target values associated with the source value from each chart may be presented to the user. The user can also use multi-touch input to select object representing data and drag them to perform actions associated with the objects. The actions performed on the objects depend on the locations of the objects as the user drags them.

Description

CROSS-REFERENCE TO RELATED APPLICATIONS[0001]This application is a continuation of PCT Application No. PCT / US2011 / 033324, filed on Apr. 20, 2011, which is incorporated by reference herein in its entirety.BACKGROUND[0002]1. Field of Art[0003]The disclosure generally relates to user interface for presenting data records as charts on a display device, and in particular to comparing data presented as charts.[0004]2. Description of the Related Art[0005]There are several ways of using charts or graphs to visually present statistical data available in reports including, for example, bar charts, pie charts, line graphs, and scatter graphs. Users often have to compare related data from one or more reports. For example, a user may want to compare reports that represent data associated with different time intervals, such as reports describing sales statistics for two different quarters. The user may view the individual reports as charts. However for comparison purposes the user may have to ide...

Claims


Application Information

Patent Timeline
Patent Type & Authority Applications(United States)
IPC IPC(8): G06F3/048
CPCG06F3/0488G06Q30/02G06F3/0486G06F3/04847G06F3/0481G06F9/543G06F3/04886G06F3/0482G06F3/04842G06T11/206G06T2200/24
Inventor KRAUT, JOEL
Owner SAP AG
Why Eureka
Try Eureka