Data binding graph for interactive chart
a data binding and interactive chart technology, applied in the field of interactive chart data binding graphs, can solve the problems of large complexity, error-prone plumbing, and inability to keep multiple chart views consistent,
- Summary
- Abstract
- Description
- Claims
- Application Information
AI Technical Summary
Benefits of technology
Problems solved by technology
Method used
Image

Examples
Embodiment Construction
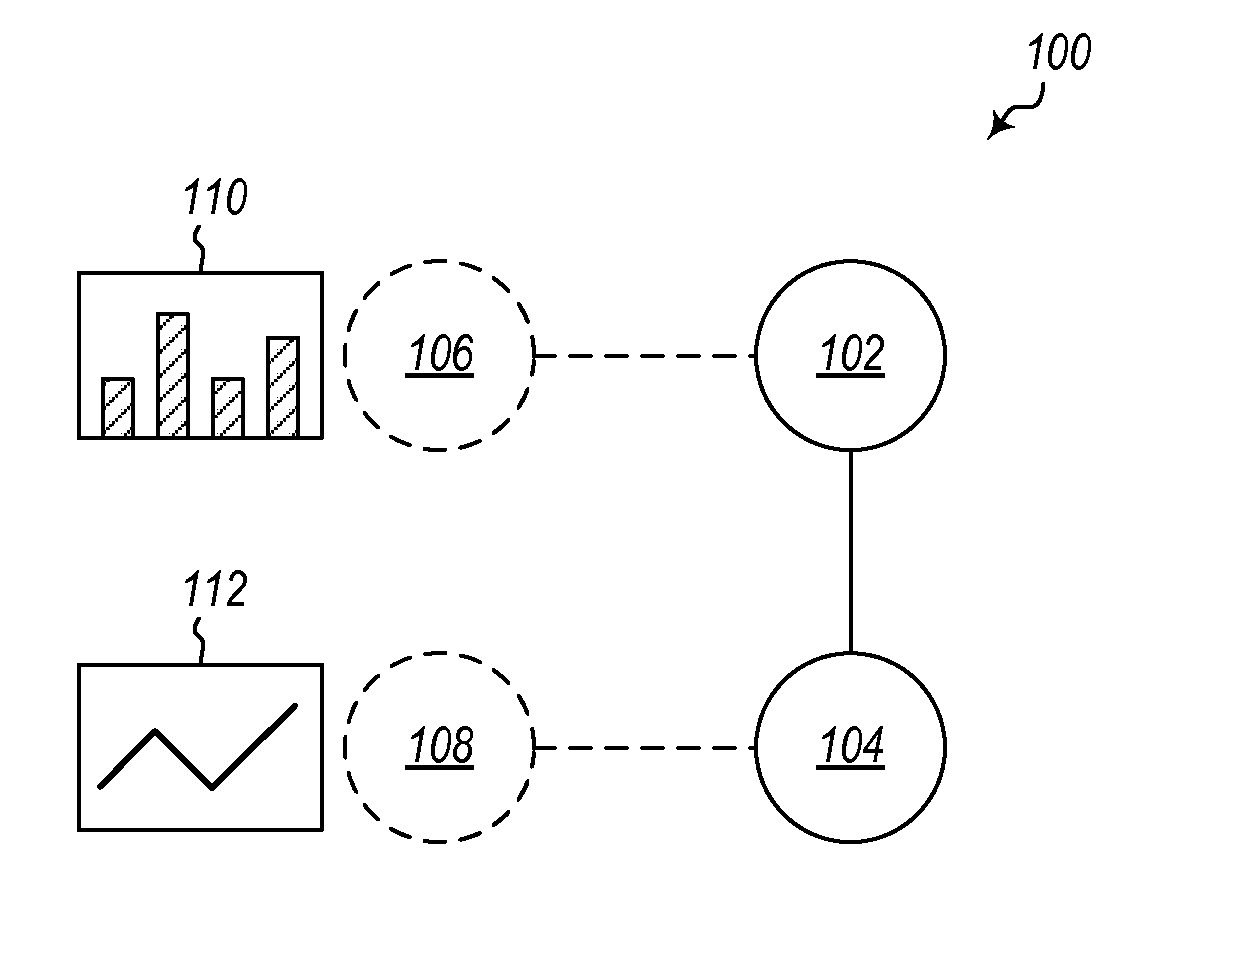
[0018]Embodiments described herein are directed to describing data and operations on data using a directed acyclic graph. Visualizations of data can be accomplished by coupling visualization nodes to nodes of the graph. User interaction with the visualizations is propagated back to the nodes to which the visualizations are connected. Finally, by operation of the directed acyclic graph, the user interactions are propagated downstream to other nodes where the user interactions affect visualization nodes (and hence visualizations) connected to downstream data source nodes of the directed acyclic graph.
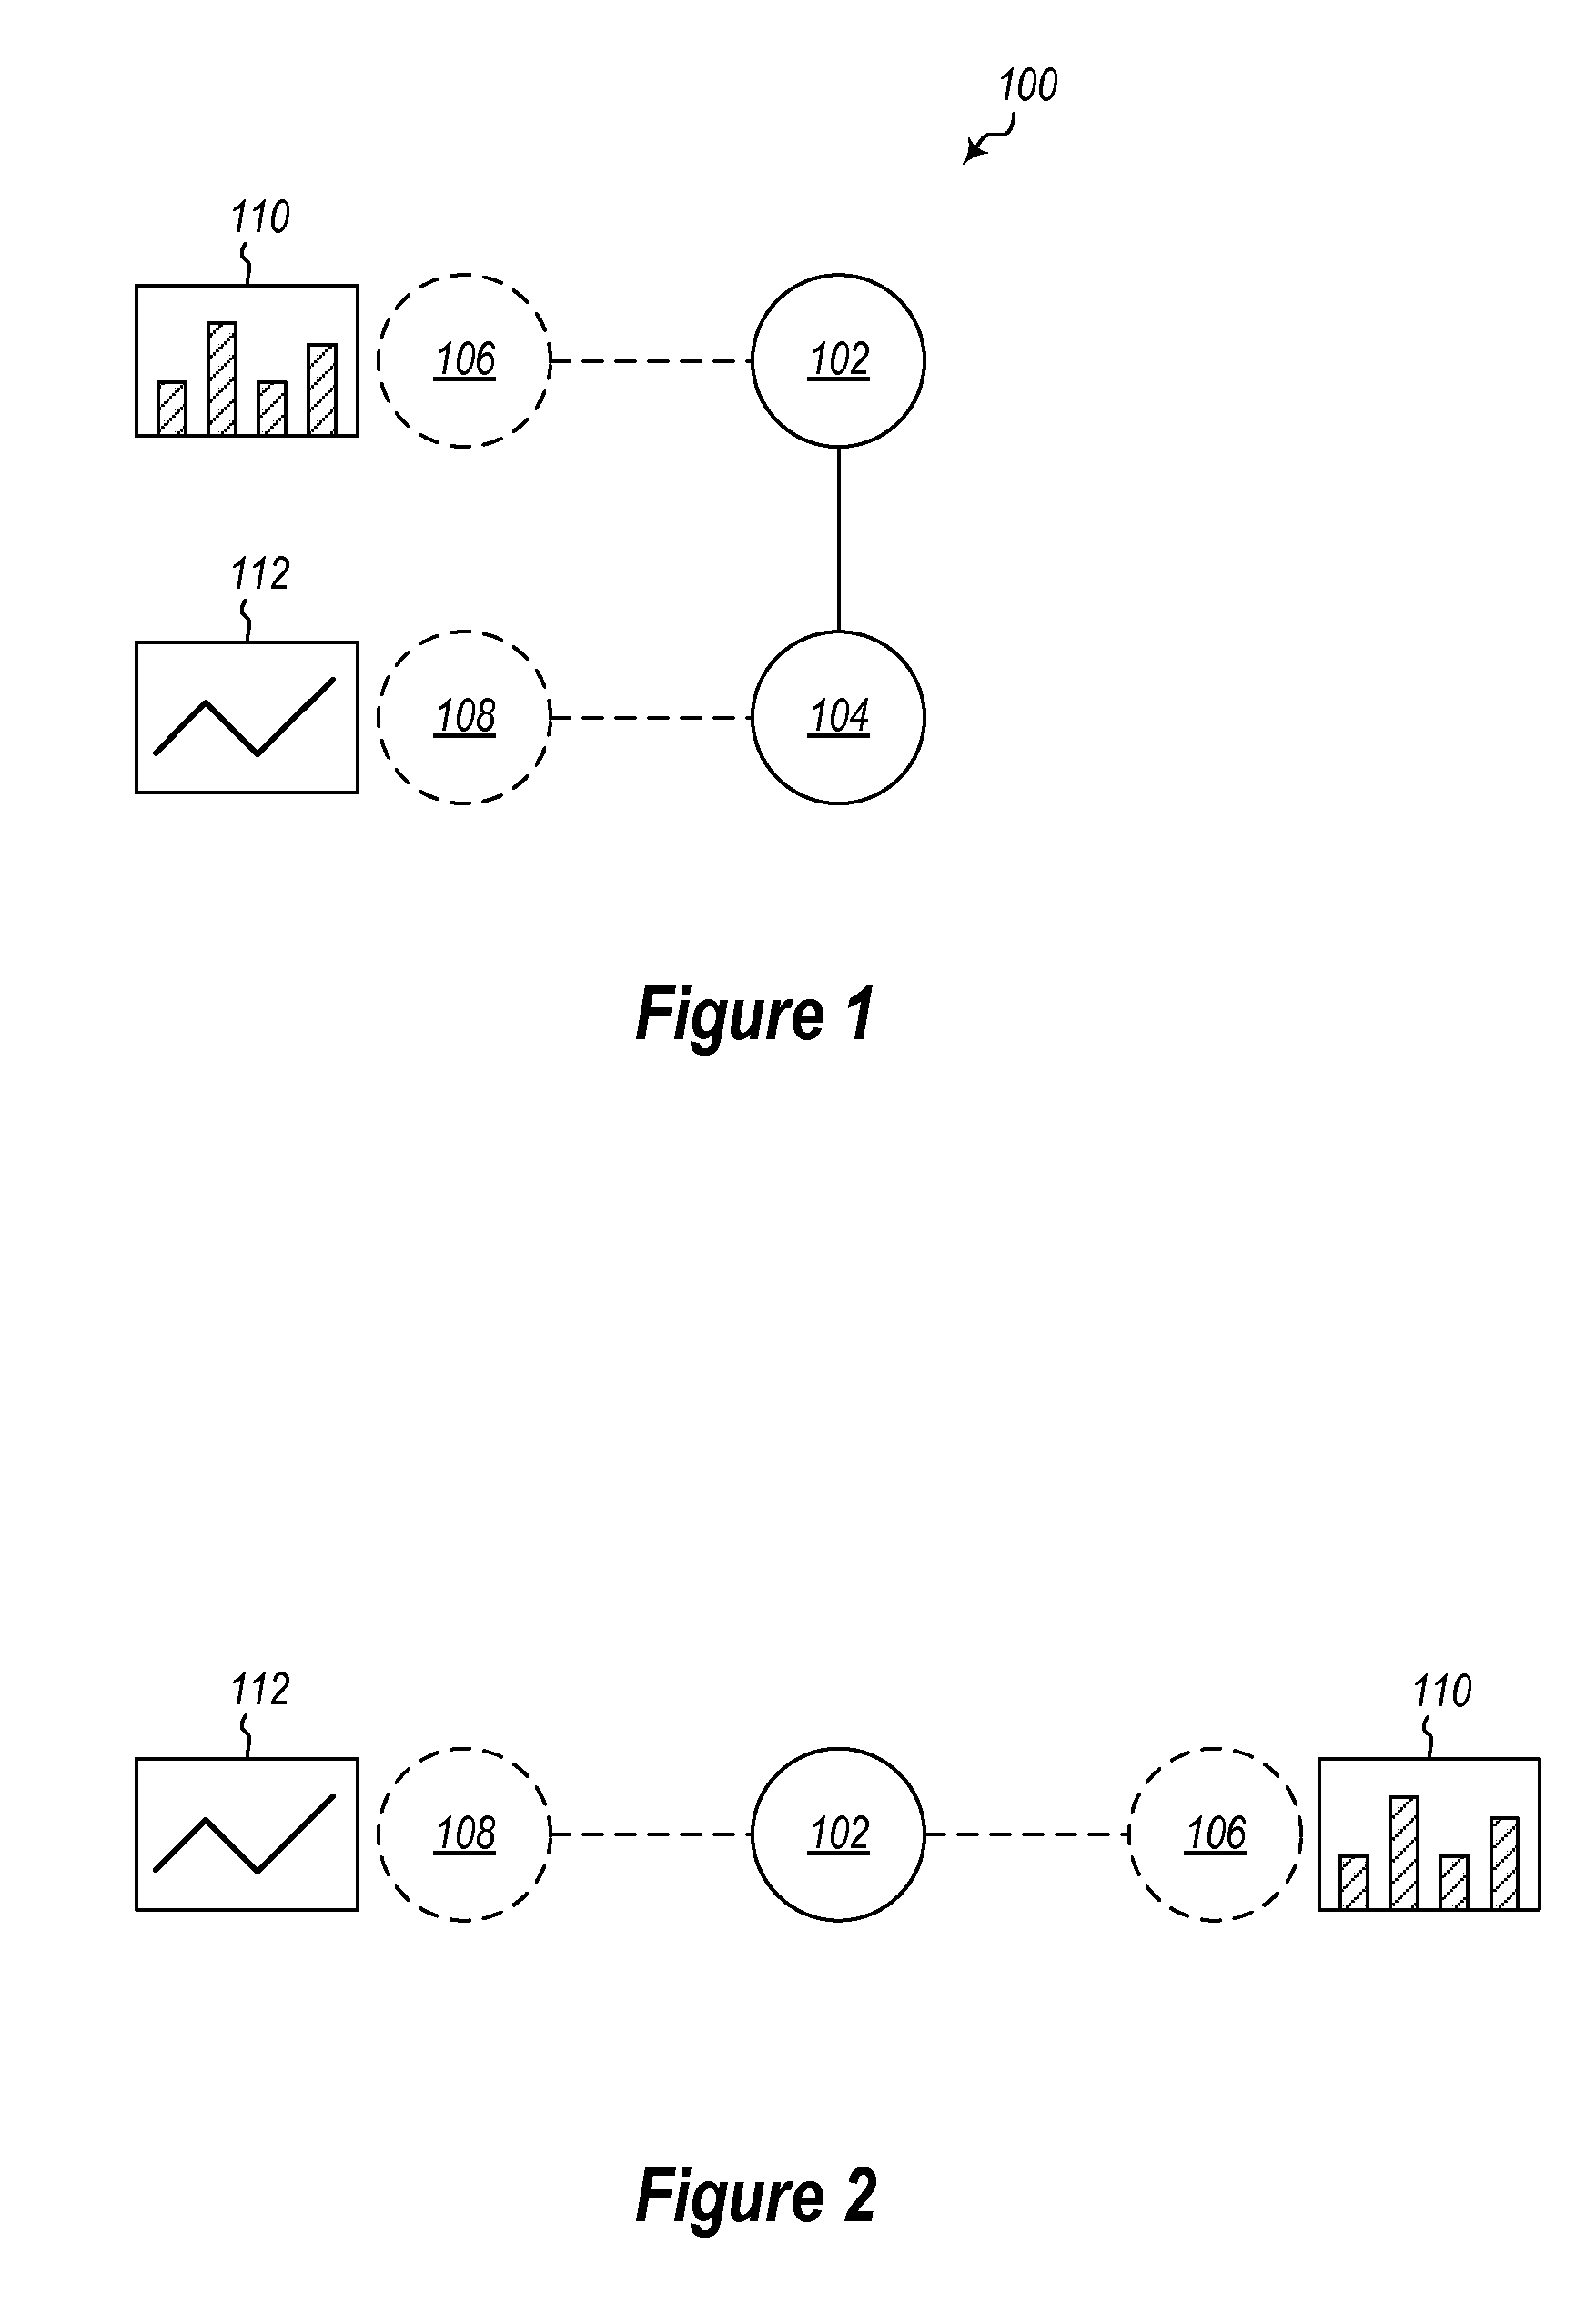
[0019]FIG. 1 illustrates a simple example. In particular, FIG. 1 illustrates a directed acyclic graph 100 including a data source node 102 and a data source node 104. Data in the graph 100 flows from node 102 to node 104. FIG. 1 further illustrates a visualization node 106 coupled to the data source node 102. A visualization node 108 is coupled to the data source node 104. Visualization n...
PUM
 Abstract
Description
Claims
Application Information
 - R&D
- Intellectual Property
- Life Sciences
- Materials
- Tech Scout
- Unparalleled Data Quality
- Higher Quality Content
- 60% Fewer Hallucinations
Browse by: Latest US Patents, China's latest patents, Technical Efficacy Thesaurus, Application Domain, Technology Topic, Popular Technical Reports.
© 2025 PatSnap. All rights reserved.Legal|Privacy policy|Modern Slavery Act Transparency Statement|Sitemap|About US| Contact US: help@patsnap.com