System and method for facilitating interactive data visualization and manipulation
a data visualization and manipulation system technology, applied in the field of systems and methods for data visualization and data management, can solve the problems of not making it any easier to consume the vast amount of information, and difficult to view large amounts of data
- Summary
- Abstract
- Description
- Claims
- Application Information
AI Technical Summary
Benefits of technology
Problems solved by technology
Method used
Image

Examples
example 1
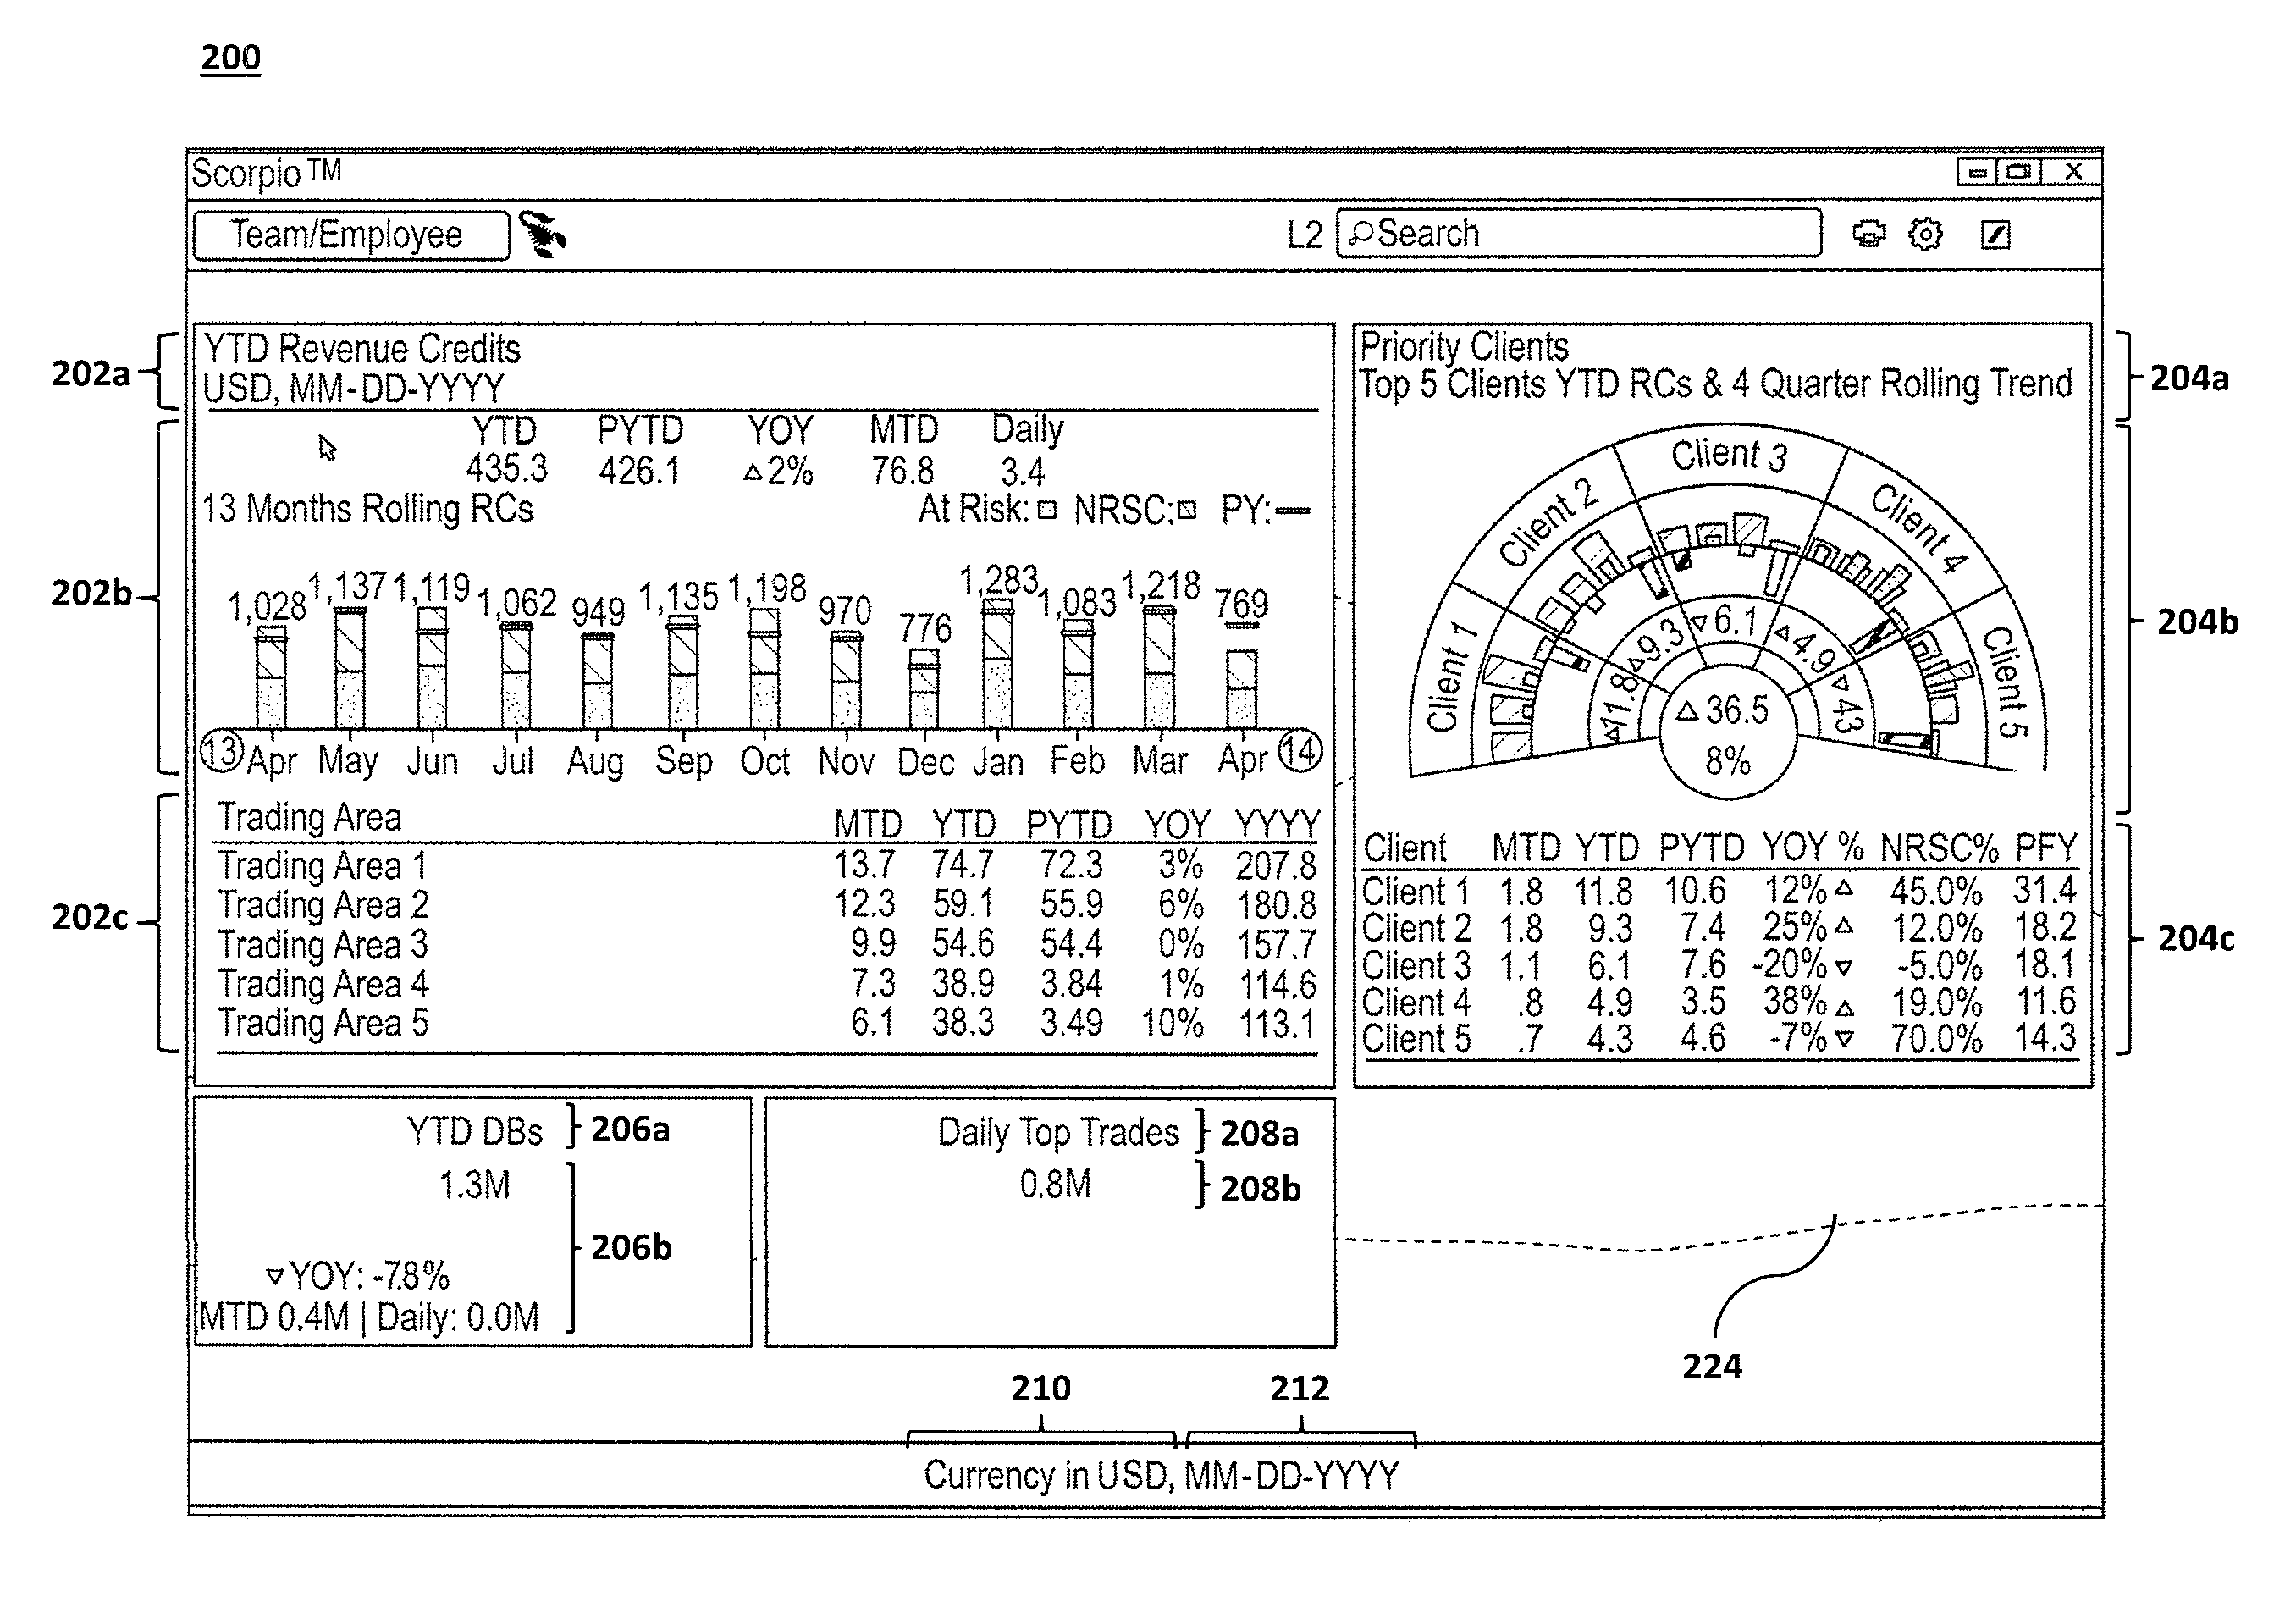
[0064]To provide an overview, the present invention may be illustrated by the Example illustrated in FIG. 2b. This Example is provided to aid in the understanding of the invention and is not to be construed as a limitation thereof. Specifically, FIG. 2b illustrates an example populated landing page 200 of a data visualization and data management system. As illustrated, the first visualization area 202 and second visualization area 204 each illustrate a title region 202a, 204a and a data visualization element, specifically, a trend chart 202b, and a fan chart 204b, and a data table 202c, 204c. Generally, the data visualization elements employed by the data visualization system may be dynamically updated and interactive, that is, they may contain user-selectable regions. Similarly, the first information tile 206 and the second information tile 208 provide a title region 206a, 208a and textual element 206c, 208c. The textual element may comprise plain text (e.g., 208b) or further inclu...
example 2
[0076]To provide an overview, the present invention may be illustrated by the Example illustrated in FIGS. 4b and 4c. This Example is provided to aid in the understanding of the invention and is not to be construed as a limitation thereof. In view of the foregoing, FIG. 4b illustrates an example dashboard page 300 displaying the first side of a data visualization element represented in the form of a populated multi-dimensional donut 400. In the following example, the total value of the current view of the revenue credits (“RC”) dataset is provided at the center portion 402 as 435.3M (e.g., $435.3 Million, with a Year over Year (“YOY”) variance of 2%).
[0077]The multi-dimensional donut 400 of FIG. 4b is further illustrated as having three clusters 416 (labeled at the corresponding portion of the first concentric ring 404 as Trading Area, Client Priority and Sales Region). Corresponding data for each dimension 416 vis-à-vis each sub-category is provided at the second and third concentr...
example 3
[0088]To provide an overview, the present invention may be illustrated by the Example illustrated in FIG. 5b. This Example is provided to aid in the understanding of the invention and is not to be construed as a limitation thereof. FIG. 5b illustrates an example dashboard page 300 having a data visualization element represented in the form of a populated data table 500. Specifically, FIG. 5b illustrates a data table 500 with two dimensions, Trading Area and Sector. To select the dimensions for a given chart view (e.g., those being used at the X and Y axis of the data table 500); the user may access a dimension selector table window 510 by selecting the dimension selector icon 502.
[0089]Selector table window 510. FIG. 5c illustrates an example selector table window 510 overlaying the dashboard page 300 of FIG. 5b. The selector table window 510 may comprise two tabs, one for a dimension cross selector element 512 and another for other settings 512. As illustrated, six dimensions (i.e....
PUM
 Abstract
Description
Claims
Application Information
 - R&D Engineer
- R&D Manager
- IP Professional
- Industry Leading Data Capabilities
- Powerful AI technology
- Patent DNA Extraction
Browse by: Latest US Patents, China's latest patents, Technical Efficacy Thesaurus, Application Domain, Technology Topic.
© 2024 PatSnap. All rights reserved.Legal|Privacy policy|Modern Slavery Act Transparency Statement|Sitemap