
Analysis view for pivot table interfacing

a technology of pivot table and analysis view, applied in the field of analysis view for pivot table interfacing, can solve the problems of overwhelming data contained within a spreadsheet and difficult to comprehend

Inactive Publication Date: 2016-09-01
MICROSOFT TECH LICENSING LLC
View PDF5 Cites 8 Cited by
  • Summary
  • Abstract
  • Description
  • Claims
  • Application Information

AI Technical Summary

Benefits of technology

The patent describes a way to visualize data analysis results by displaying a window with selectable objects. These objects can be selected and dragged out of the window, or they can be automatically closed and removed when the window is closed without needing further input from the user. The technical effect of this is that it allows for more efficient and flexible visualization of data analysis results, making it easier for users to quickly and easily identify and to interact with relevant information.

Problems solved by technology

Sometimes, the data contained within a spreadsheet can be overwhelming and difficult to comprehend.

Method used


Image

  • Analysis view for pivot table interfacing
  • Analysis view for pivot table interfacing
  • Analysis view for pivot table interfacing

Examples


Embodiment Construction

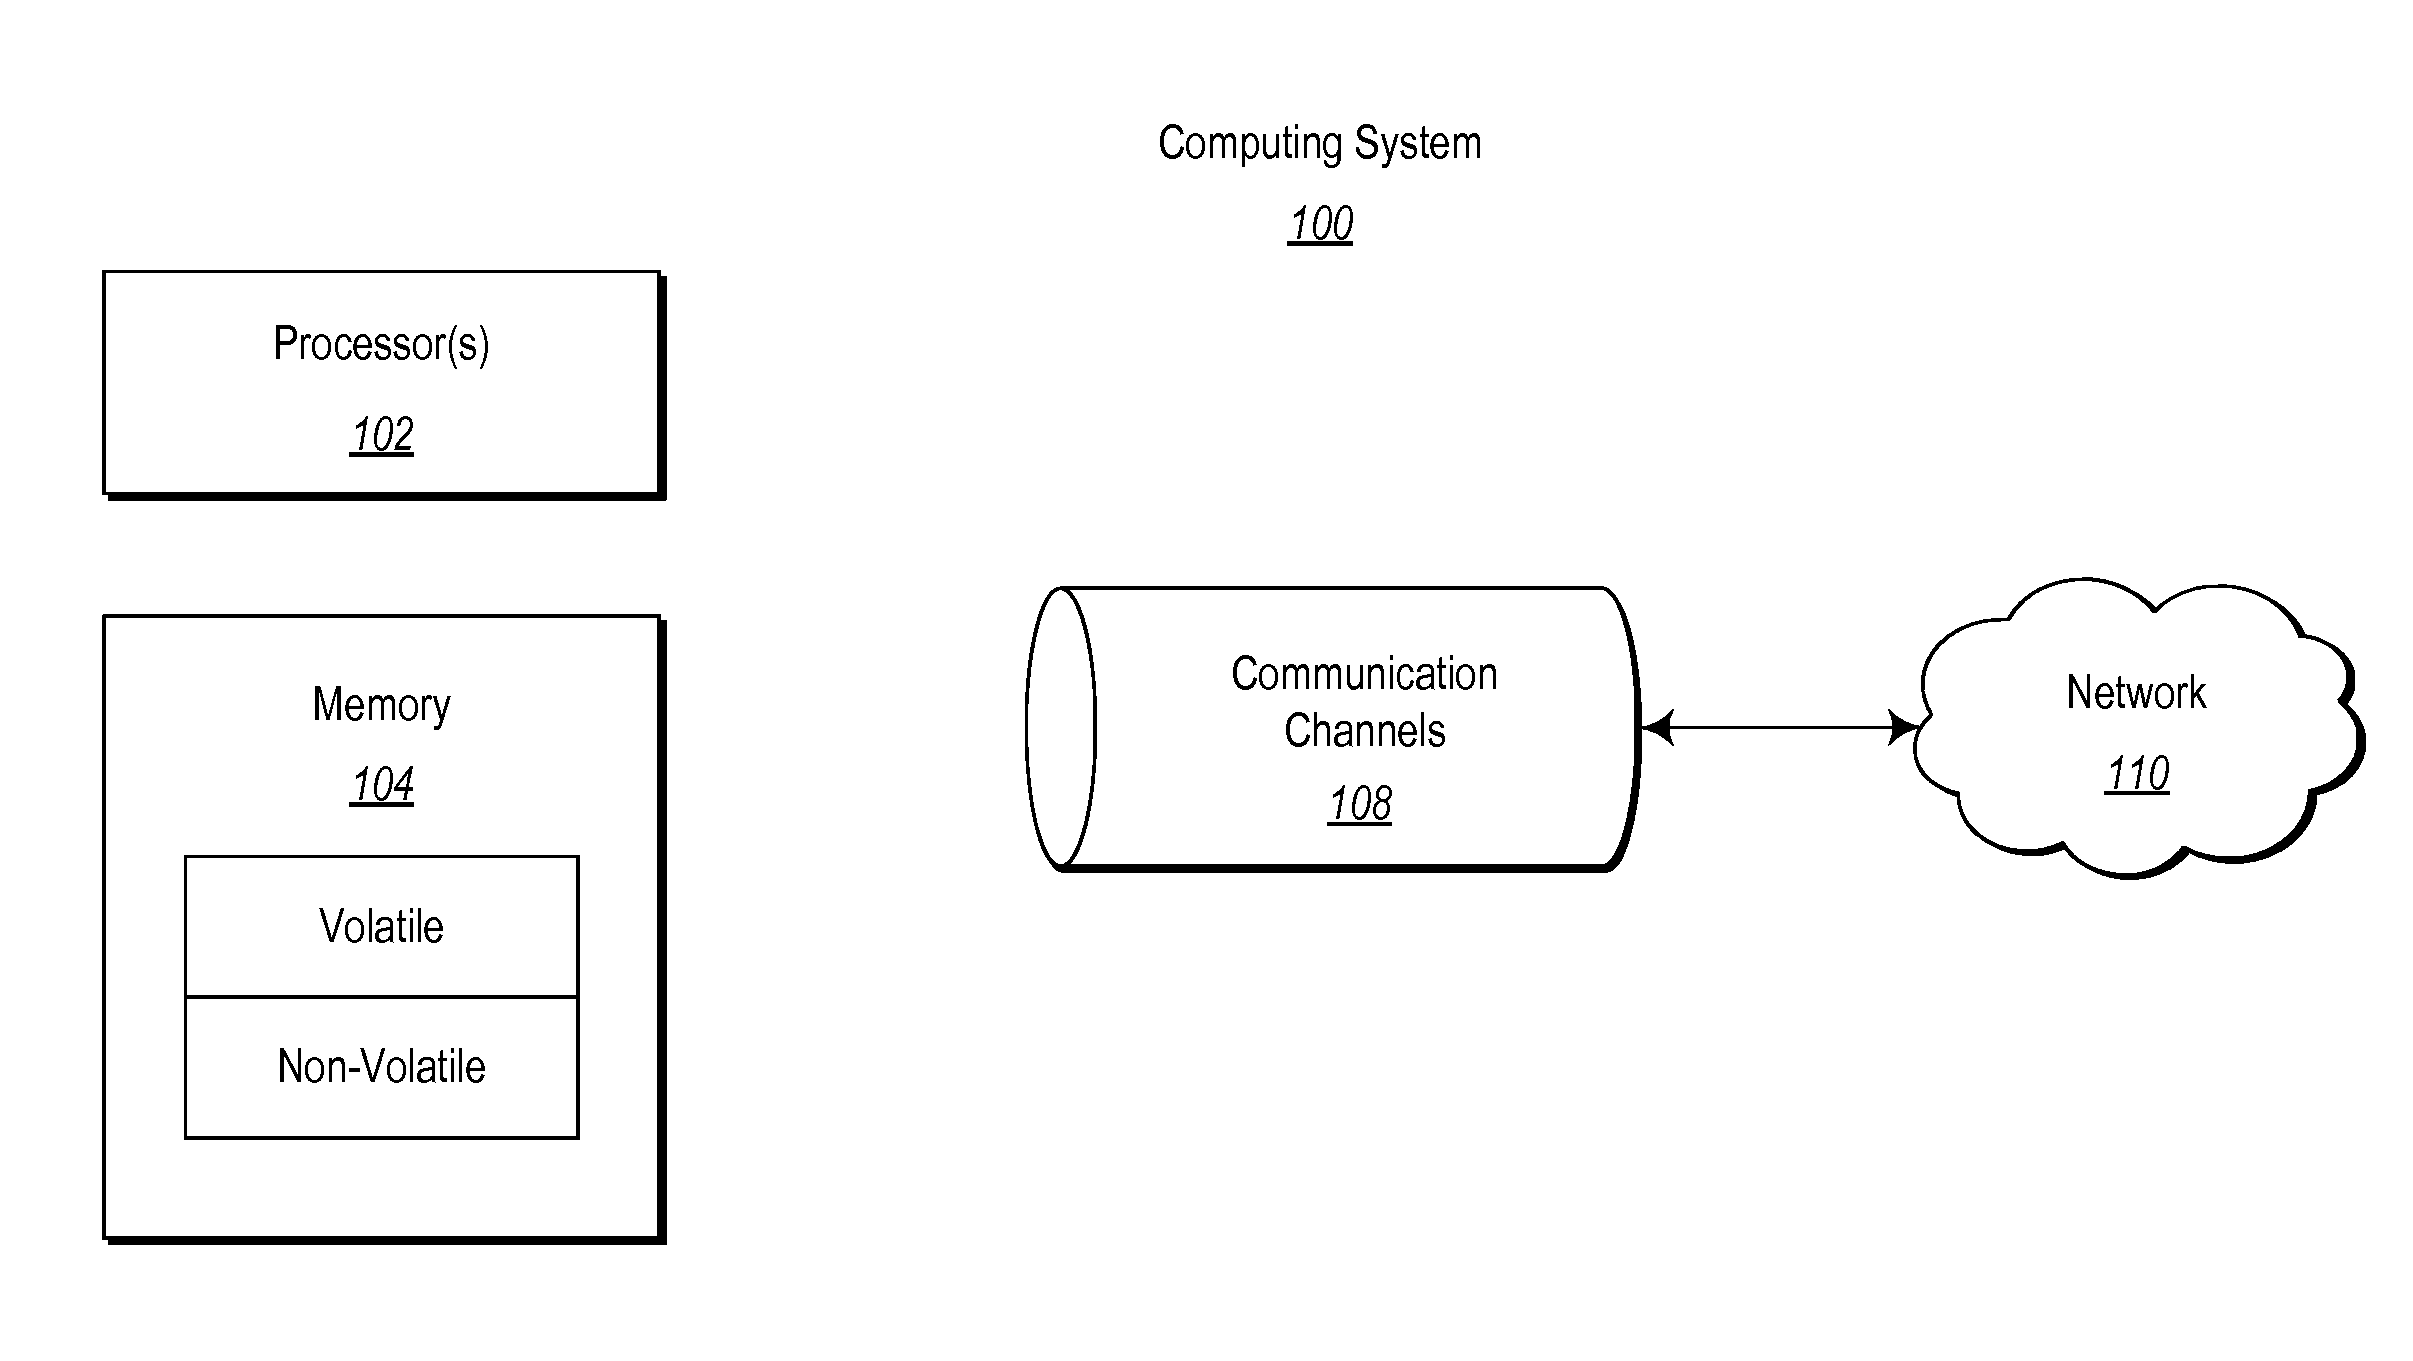
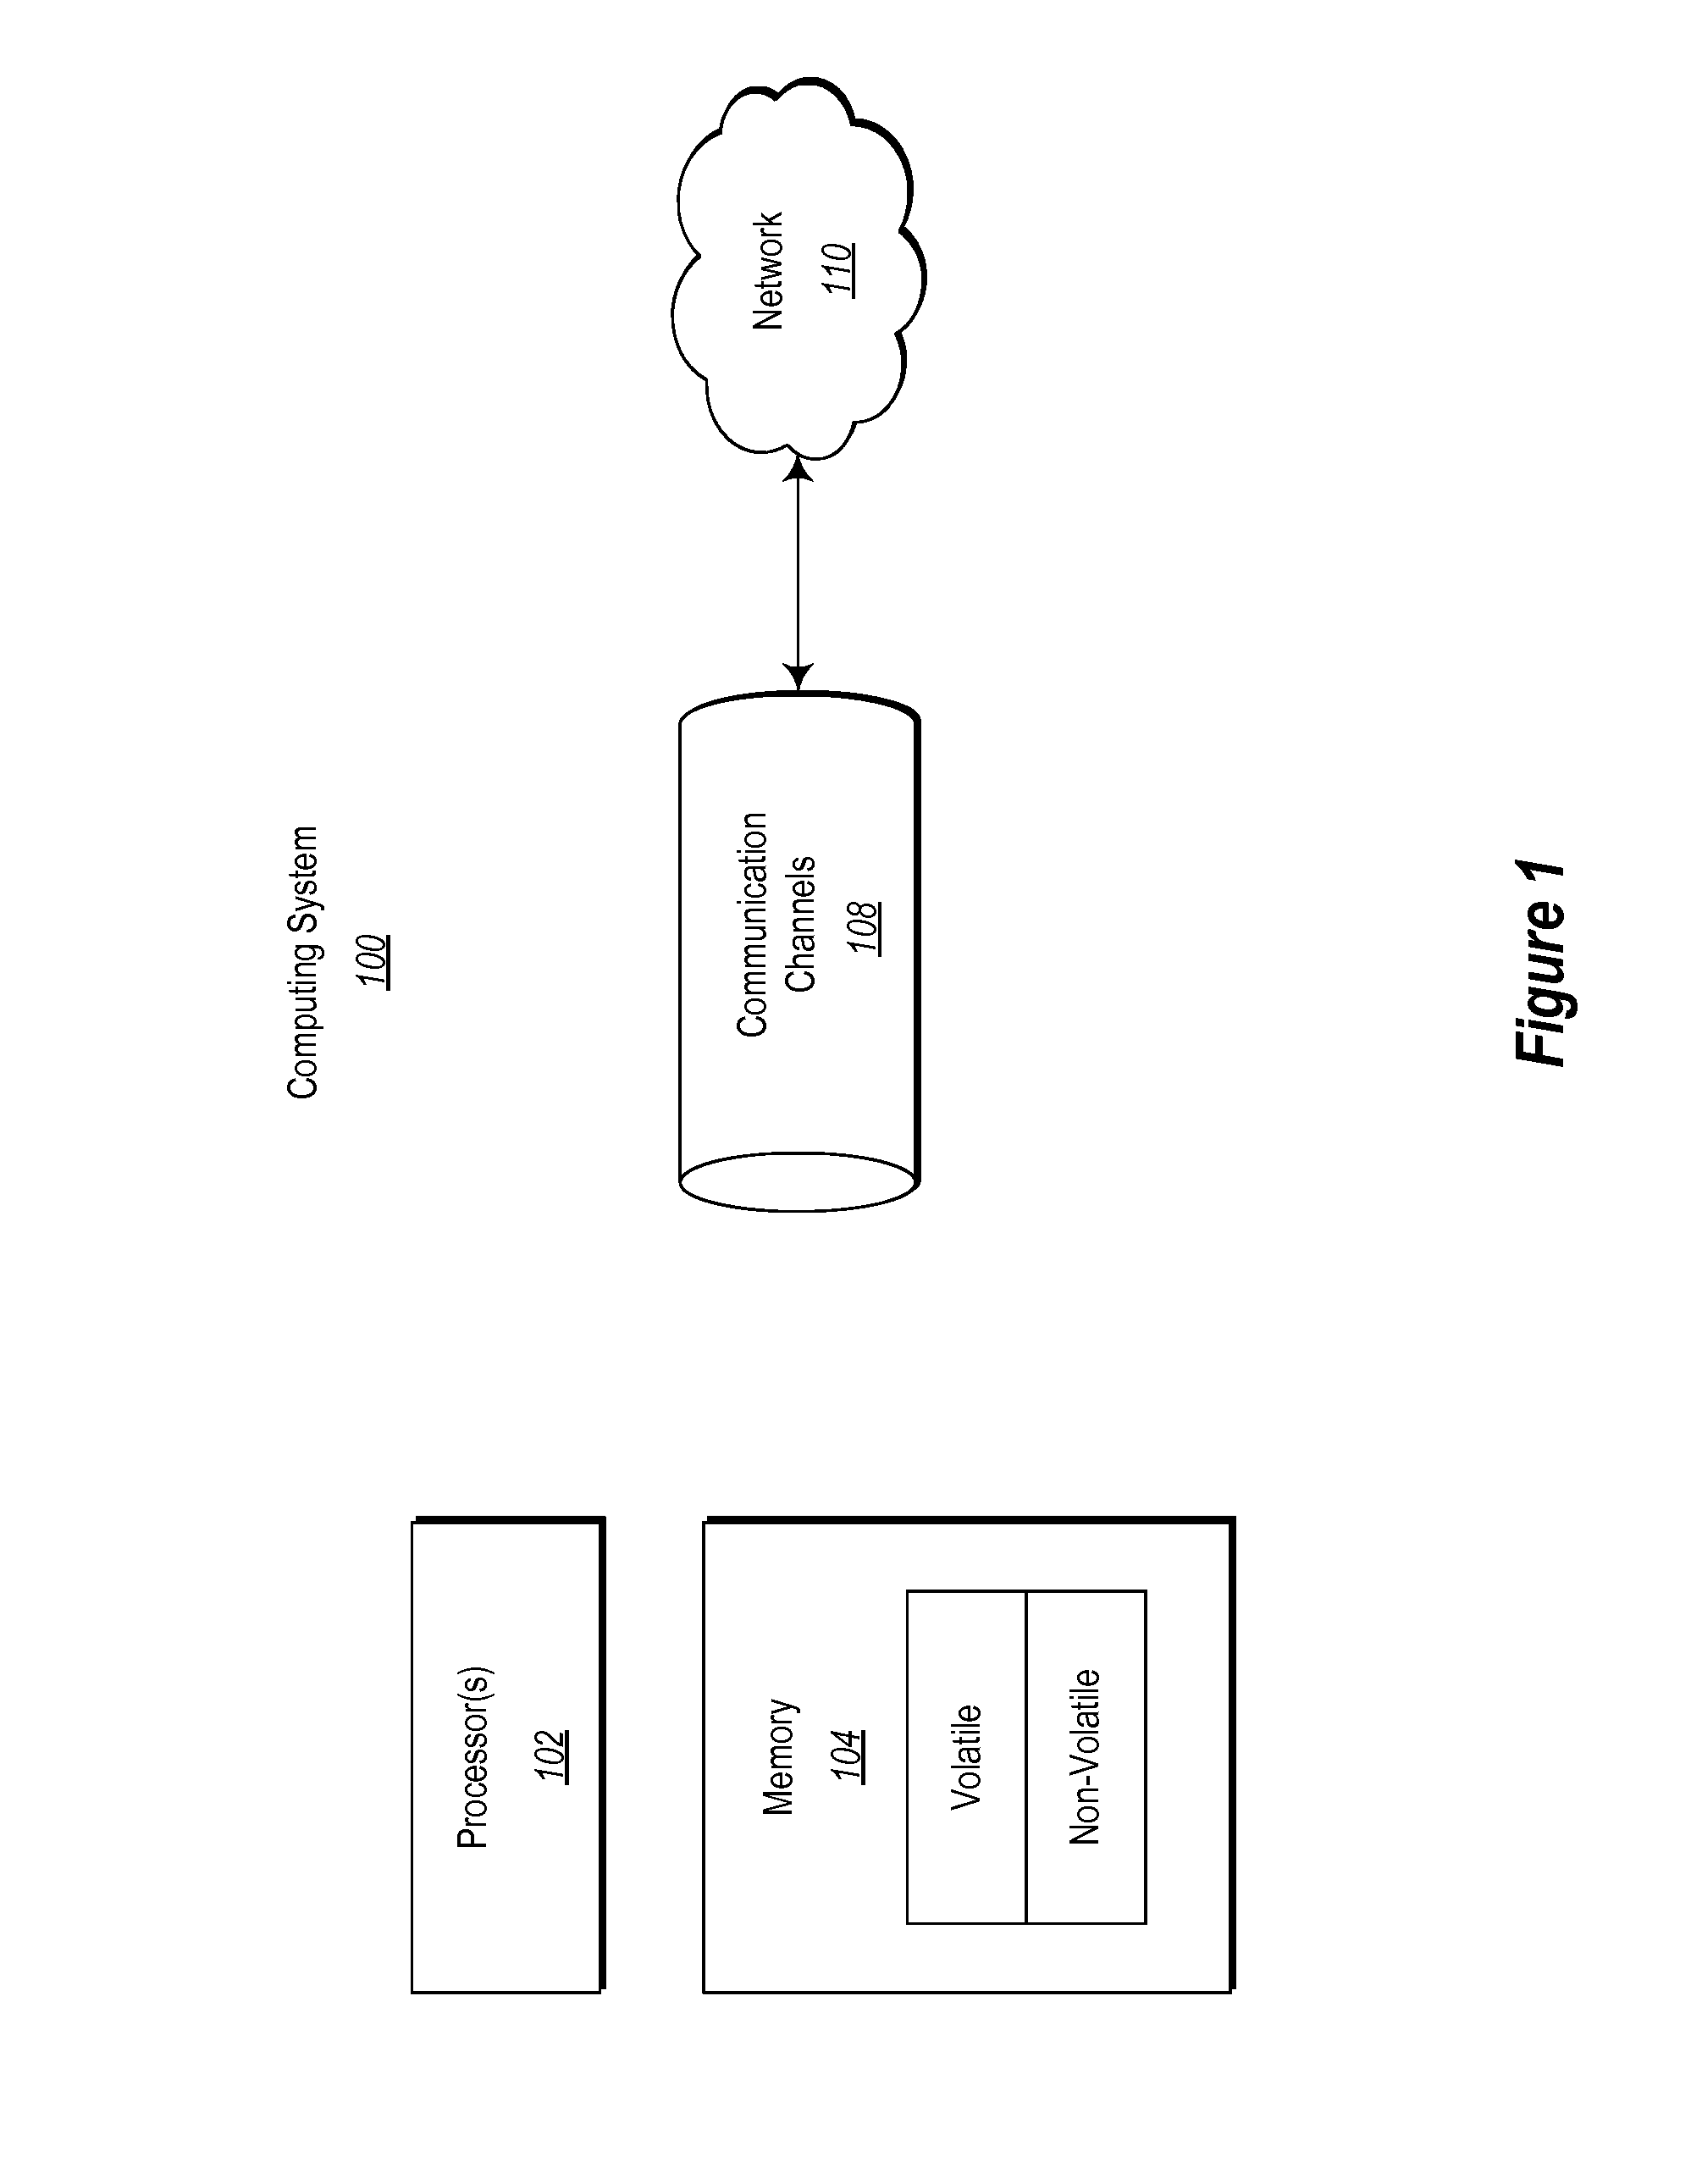
[0020]Aspects of the disclosed embodiments relate to the creation and use of analysis view interfaces and objects that can be used for interfacing with pivot tables.

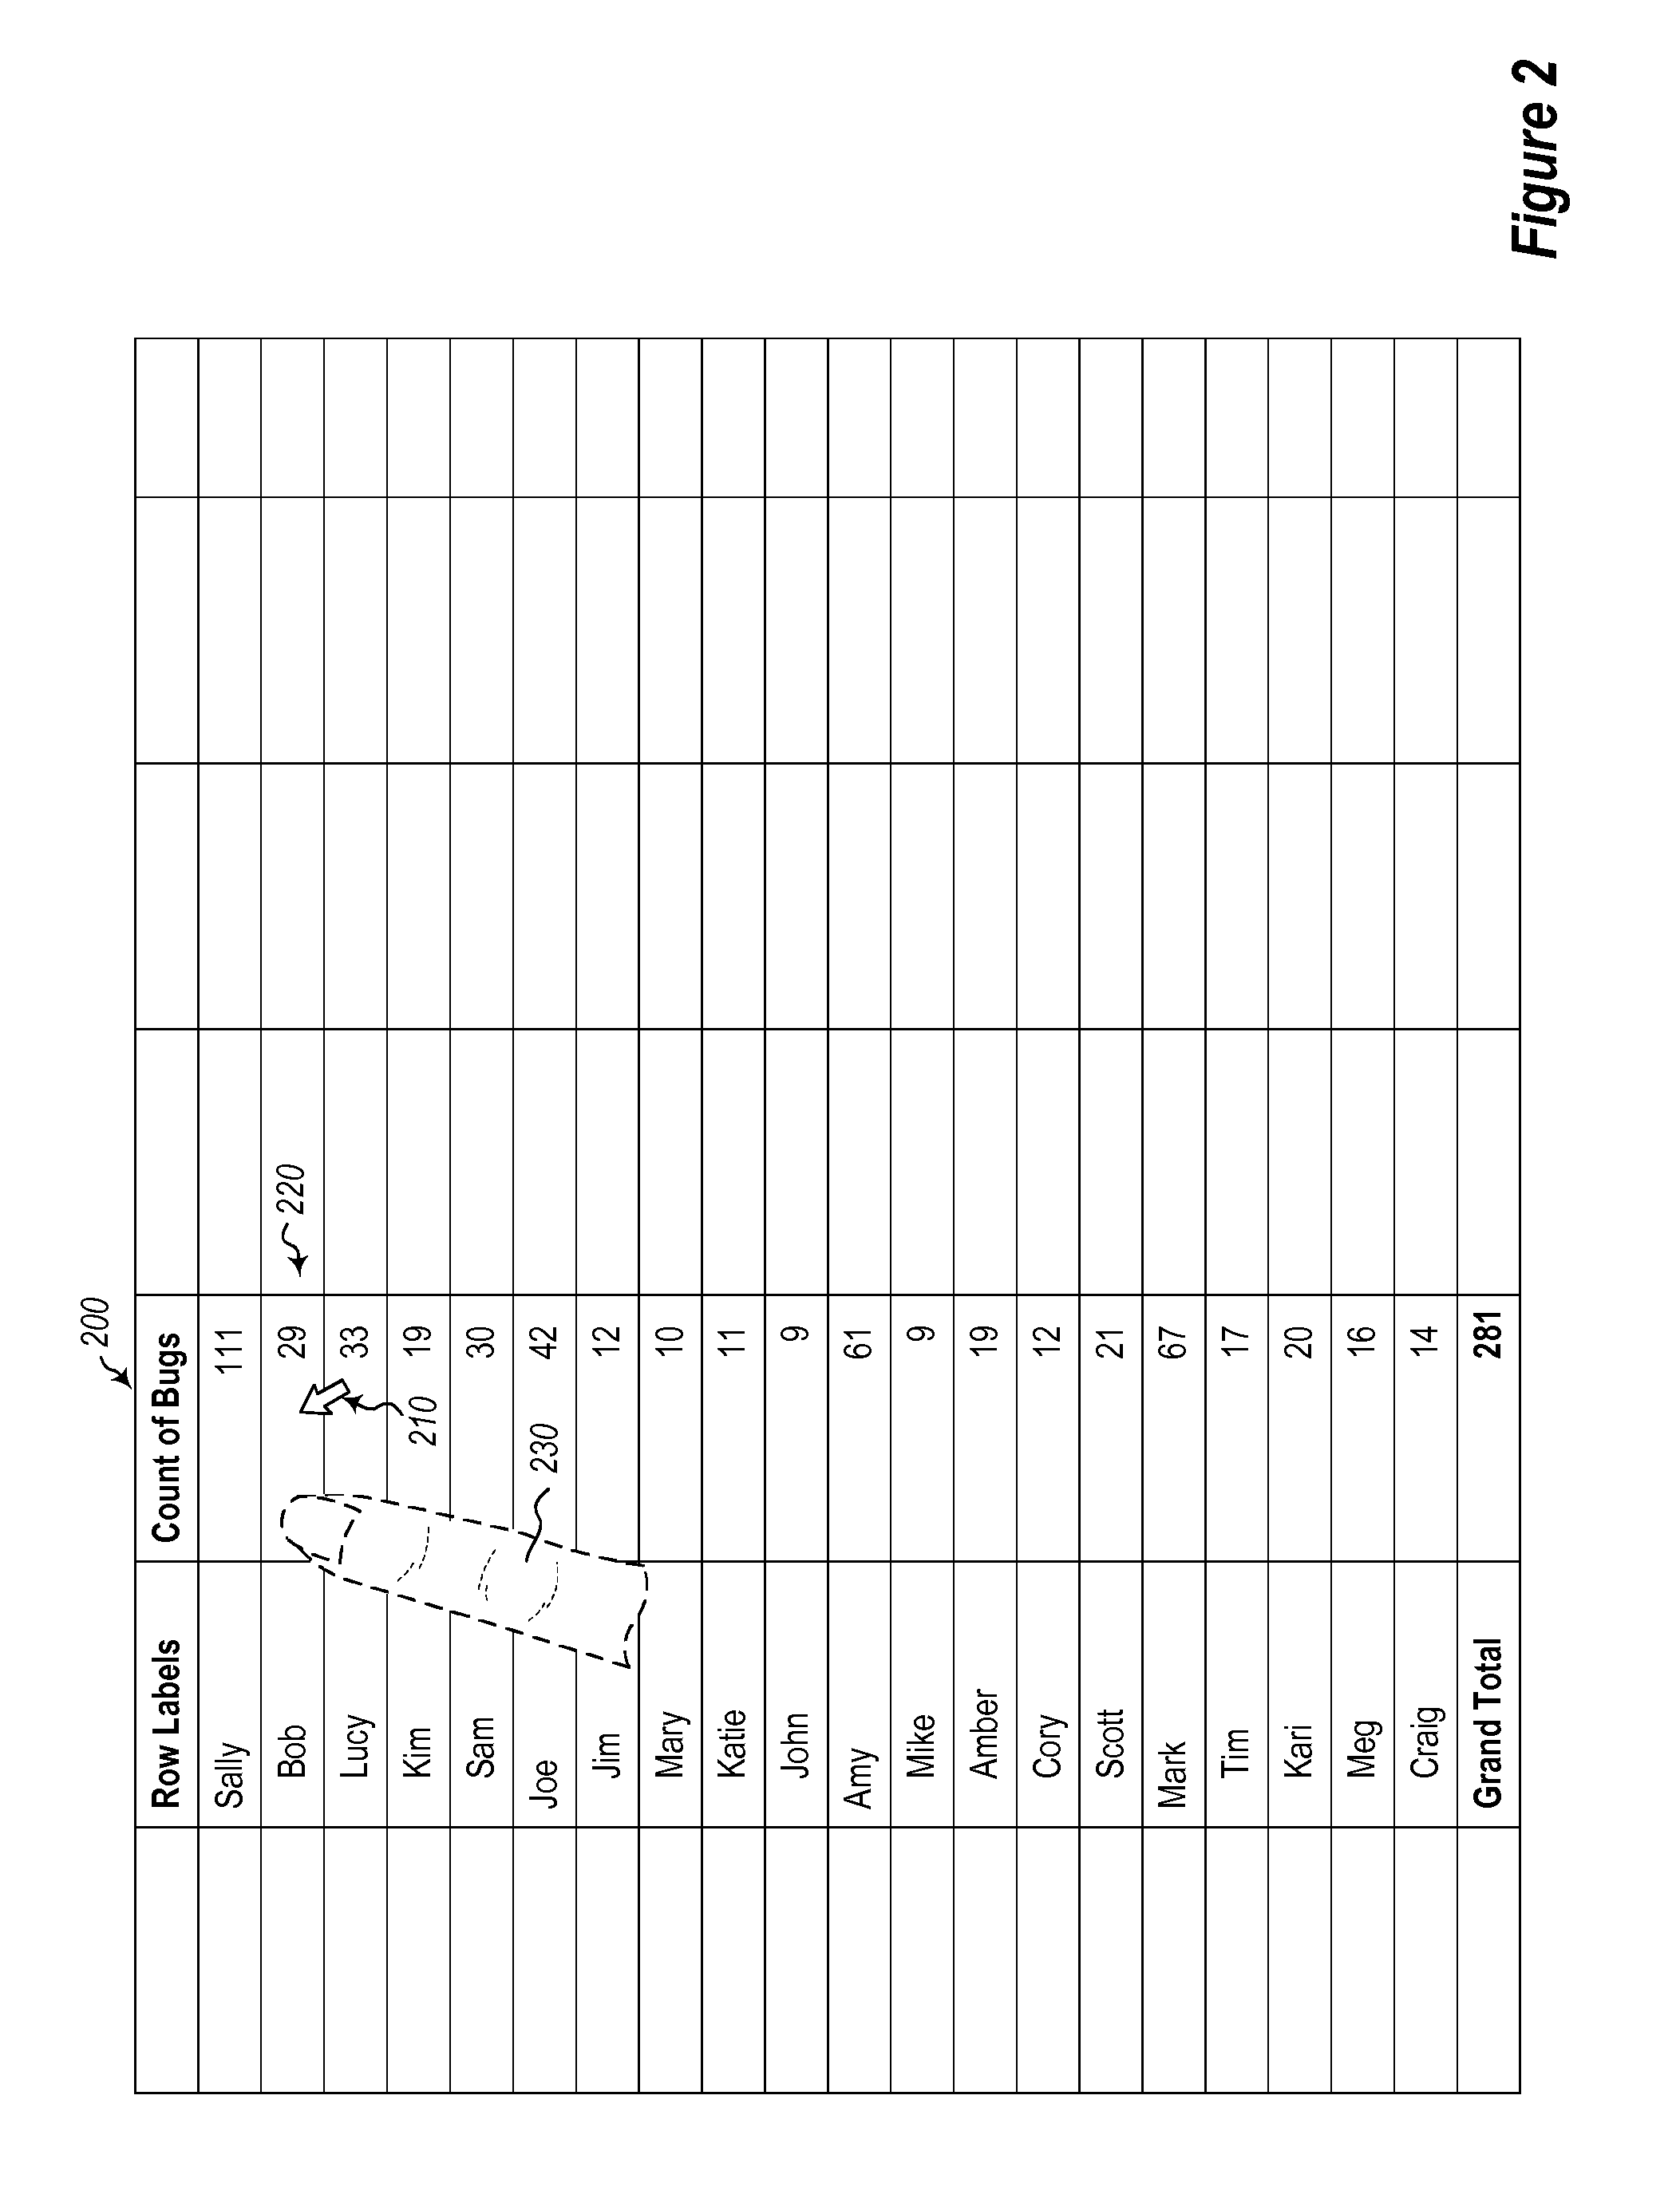
[0021]While some pivot table interfaces currently exist, it can still be difficult for a user to comprehend how to navigate the data presented by a pivot table and how to create and / or utilize graphics for a pivot table.

[0022]In the present disclosure an analysis view is described, which is capable of improving the user experiences associated with pivot tables. The analysis view can be used in some embodiments to create graphics that are transient and that can be nimbly rotated in and out of view, along with other graphics, in response to simple gestures, without requiring a user to navigate through complex hierarchies of menus and chart wizards.

[0023]There are various technical effects and benefits that can be achieved by implementing aspects of the disclosed embodiments. By way of example, the disclosed embodiments can...


PUM


Abstract

Various methods, systems and storage devices are used for creating and utilizing an analysis view for pivot table interfacing. The analysis view can be created with a visualization that reflects data summarized in the pivot table automatically in response to detecting user input directed at a particular data field (i.e., cell) of the pivot table and without requiring any additional user input, such as user input required to navigate a chart wizard or any other graphics interface. The visualization includes at least one selectable and transient object that is configured for being selected and dragged out of the analysis view window and which persists even after the analysis view window is closed, unless it is first dragged outside of the boundaries of the analysis view window and without requiring additional user input for separately closing and / or removing the transient object.

Description

BACKGROUND[0001]Many types of computer applications exist to help users access and manipulate data, including spreadsheet applications. These applications can also be referred to simply as spreadsheets. Excel is one example of a spreadsheet.[0002]A spreadsheet will typically present data in cells that are located within a grid of columns and rows. A spreadsheet can include a single worksheet or a compilation of worksheets in a workbook. Each cell in the spreadsheet can contain a specific value entered by a user, or a formula that defines a relative relationship to data contained within one or more other cells. When a formula is provided in a cell, the corresponding value is displayed to the user.[0003]Sometimes, the data contained within a spreadsheet can be overwhelming and difficult to comprehend. Accordingly, various tools are provided for summarizing the data and relationships defined therein. A pivot table is one type of a data summarization tool that is found in spreadsheets a...

Claims


Application Information

Patent Timeline
IPC IPC(8): G06F17/24G06F3/0482G06F3/0481
CPCG06F17/246G06F3/0482G06F3/04817G06F3/0486G06F40/18
Inventor OLINGER, MATHEWDAVENPORT, MICHAEL G.
Owner MICROSOFT TECH LICENSING LLC
Learn More