Method for aiding detection of nonalcoholic steatohepatitis
- Summary
- Abstract
- Description
- Claims
- Application Information
AI Technical Summary
Benefits of technology
Problems solved by technology
Method used
Image

Examples
example 1
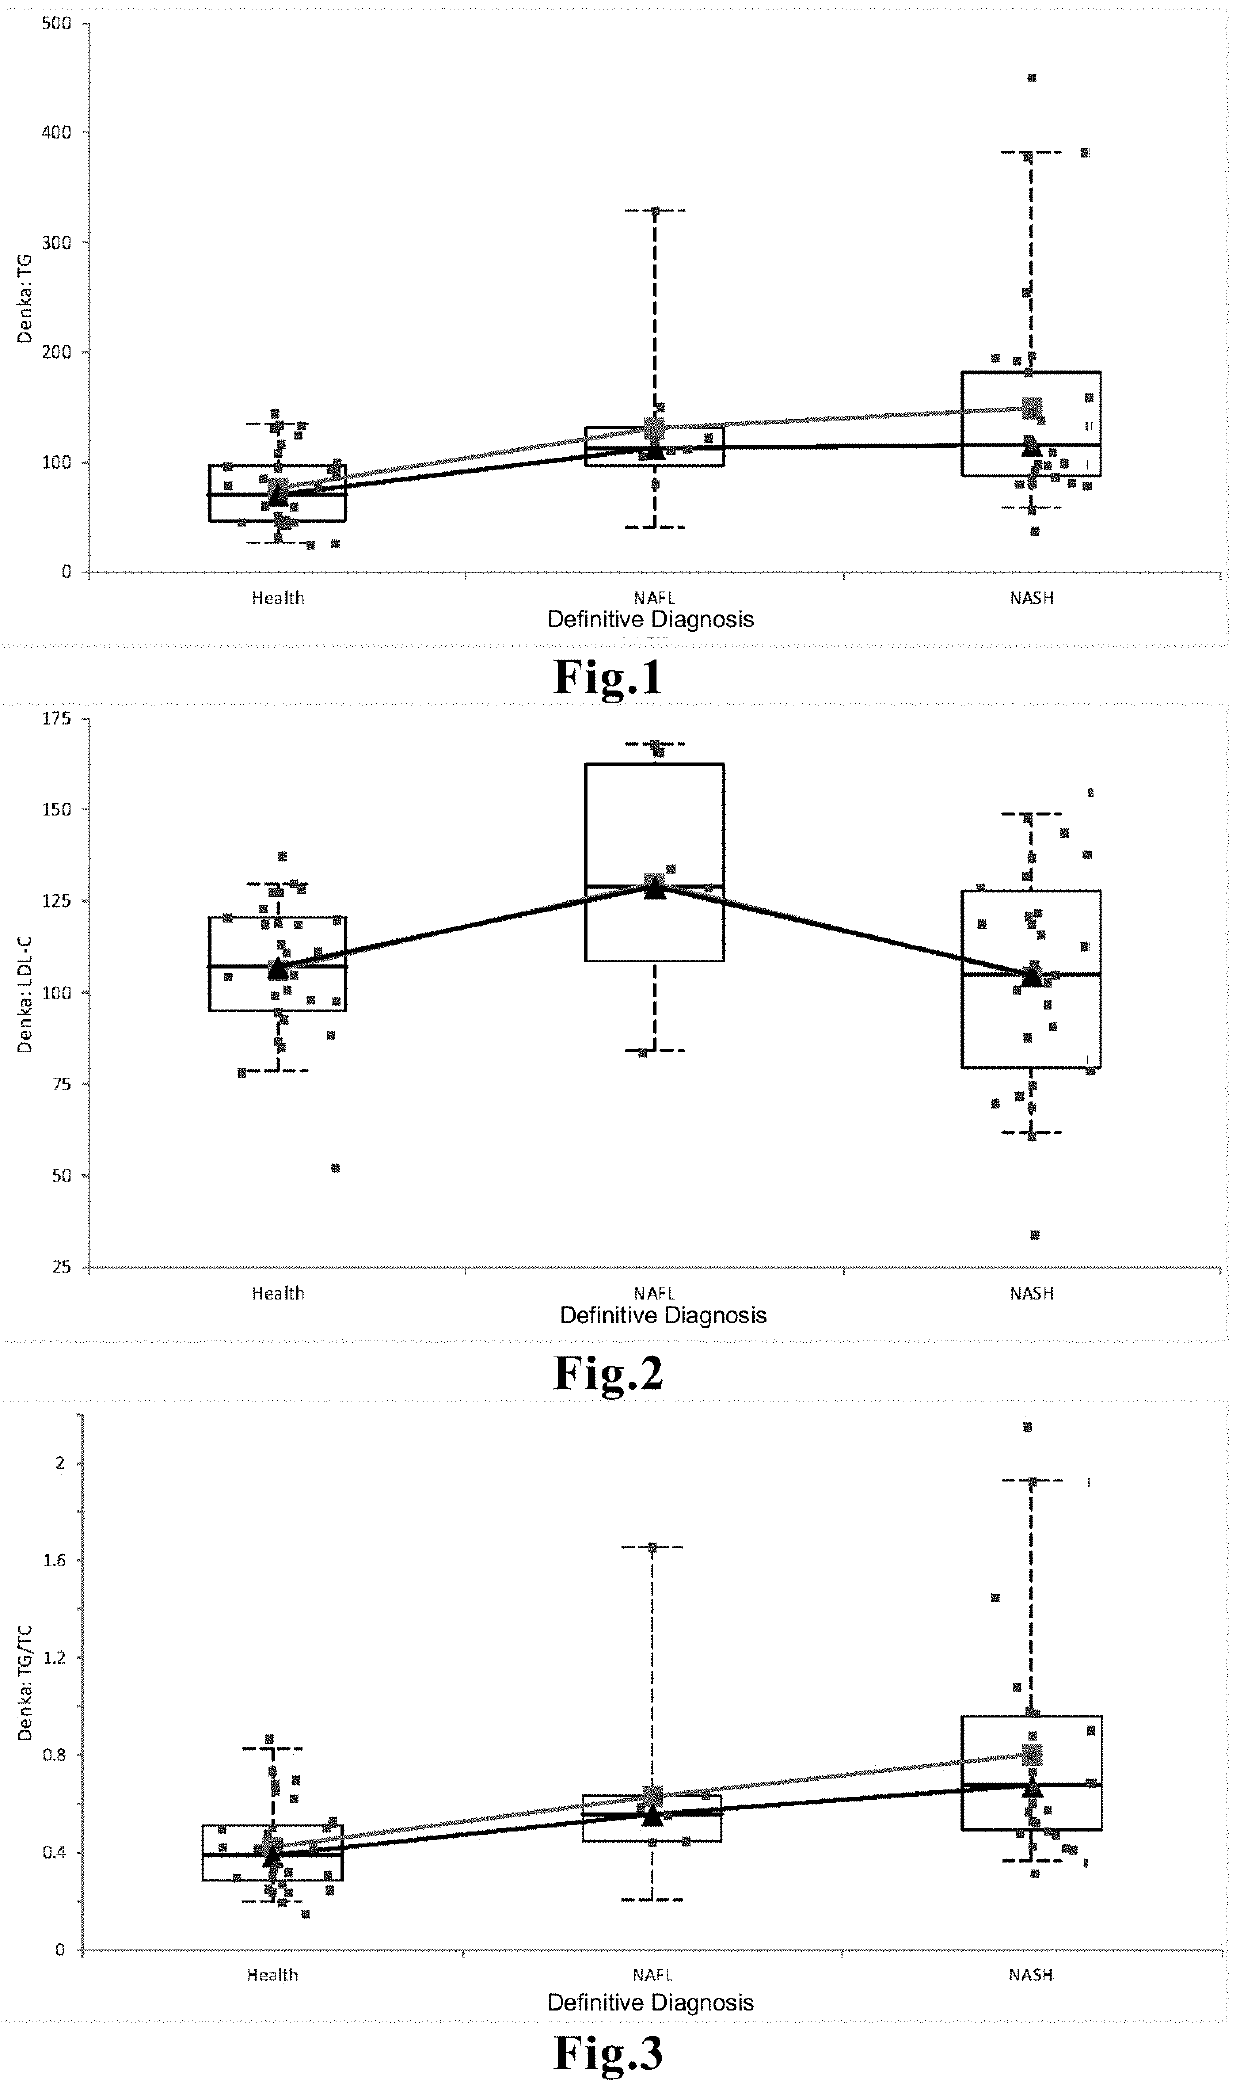
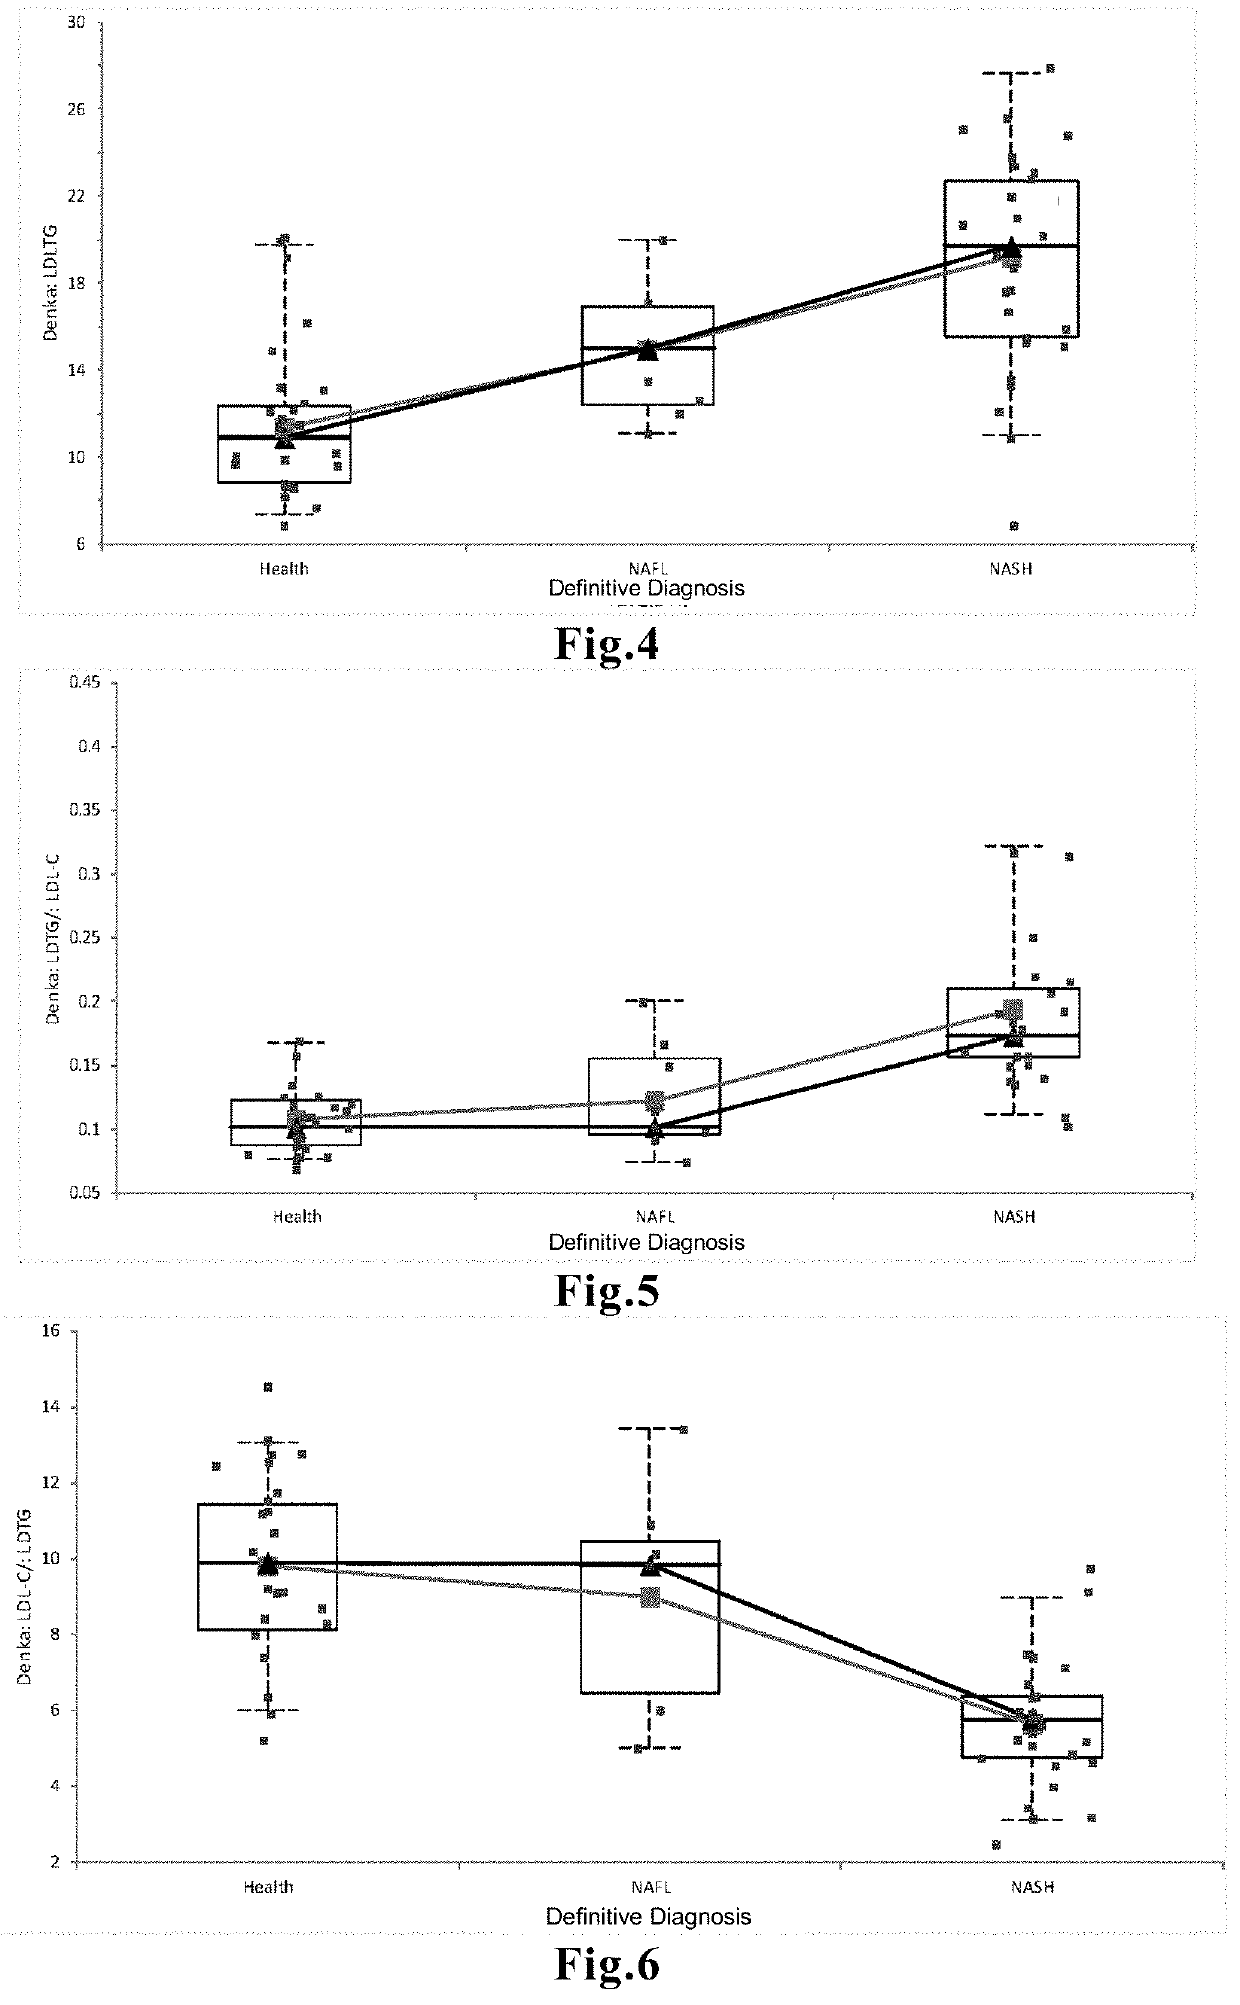
[0078]The LDL-TG content was measured in the blood samples collected from a total of 80 subjects in the same population as in Comparative Example 1, which was composed of 36 healthy individuals (Health), 9 NAFL patients, and 35 NASH patients, and was compared between groups. An automated analyzer used in medical laboratories was used to measure the LDL-TG content by means of an LDL-triglyceride assay reagent LDL TG-EX “SEIKEN” (manufactured by Denka SEIKEN Co., Ltd.). The comparison is graphically represented in FIG. 4.
[0079]The result indicated that the LDL-TG content of the NASH group was significantly higher compared to that of the NAFL group (p<0.05) and that of the group of healthy individuals (p<0.0001), and that, moreover, the LDL-TG content of the NAFL group was significantly higher than that of the group of healthy individuals (p<0.05).
example 2-1
[0080]The LDL-TG content and the LDL-C content were measured in the blood samples collected from a total of 80 subjects in the same population as in Comparative Example 1, which was composed of 36 healthy individuals (Health), 9 NAFL patients, and 35 NASH patients, by the same methods as in Example 1 and Comparative Example 2 to calculate the LDL-TG / LDL-C ratio in each group, and the resulting ratio was compared between groups. The comparison is graphically represented in FIG. 5.
[0081]The result indicated that the LDL-TG / LDL-C ratio of the NASH group was significantly higher compared to that of the NAFL group (p<0.05) and was also significantly higher compared to that of the group of healthy individuals (p<0.0001), and that, moreover, the LDL-TG / LDL-C ratio was not significantly different between the NAFL group and the group of healthy individuals.
example 2-2
[0082]The LDL-TG content and the LDL-C content were measured in the blood samples collected from a total of 80 subjects in the same population as in Comparative Example 1, which was composed of 36 healthy individuals (Health), 9 NAFL patients, and 35 NASH patients, by the same methods as in Example 1 and Comparative Example 2 to calculate the LDL-C / LDL-TG in each group, and the resulting ratio was compared between groups. The comparison is graphically represented in FIG. 6.
[0083]The result indicated that the LDL-C / LDL-TG ratio of the NASH group was significantly lower compared to that of the NAFL group (p<0.05) and was also significantly lower compared to that of the group of healthy individuals (p<0.0001), and that, moreover, the LDL-C / LDL-TG ratio was not significantly different between the NAFL group and the group of healthy individuals.
[0084]As demonstrated in , , and , the NASH and NAFL groups failed to be clearly distinguished by measuring total TG content, LDL-C content, or T...
PUM
 Abstract
Description
Claims
Application Information
 - Generate Ideas
- Intellectual Property
- Life Sciences
- Materials
- Tech Scout
- Unparalleled Data Quality
- Higher Quality Content
- 60% Fewer Hallucinations
Browse by: Latest US Patents, China's latest patents, Technical Efficacy Thesaurus, Application Domain, Technology Topic, Popular Technical Reports.
© 2025 PatSnap. All rights reserved.Legal|Privacy policy|Modern Slavery Act Transparency Statement|Sitemap|About US| Contact US: help@patsnap.com