System level analysis and control of manufacturing process variation

a manufacturing process and system level technology, applied in the field of optimization of the performance of manufacturing systems, can solve the problems of not ensuring the lowest end-of-line variation, affecting the performance of the manufacturing system,

Inactive Publication Date: 2005-05-31
TRIAD NAT SECURITY LLC
View PDF5 Cites 28 Cited by
  • Summary
  • Abstract
  • Description
  • Claims
  • Application Information

AI Technical Summary

Problems solved by technology

Changes in signal factors generally result in a relatively large change (or shift) in the response distribution, while noise factors represent (and thus contribute to) unavoidable and undesirable nuisance variation in the response variable.
They argue that optimizing each subprocess individually (using such methods as Taguchi robust design methods or response surface methods) does not guarantee the lowest end-of-line variation.
In addition, none of these methods is nearly as robust nor as applicable to as many different situations likely to be encountered in practice as the method presented here.

Method used


Image

  • System level analysis and control of manufacturing process variation
  • System level analysis and control of manufacturing process variation
  • System level analysis and control of manufacturing process variation

Examples


example problem

Results

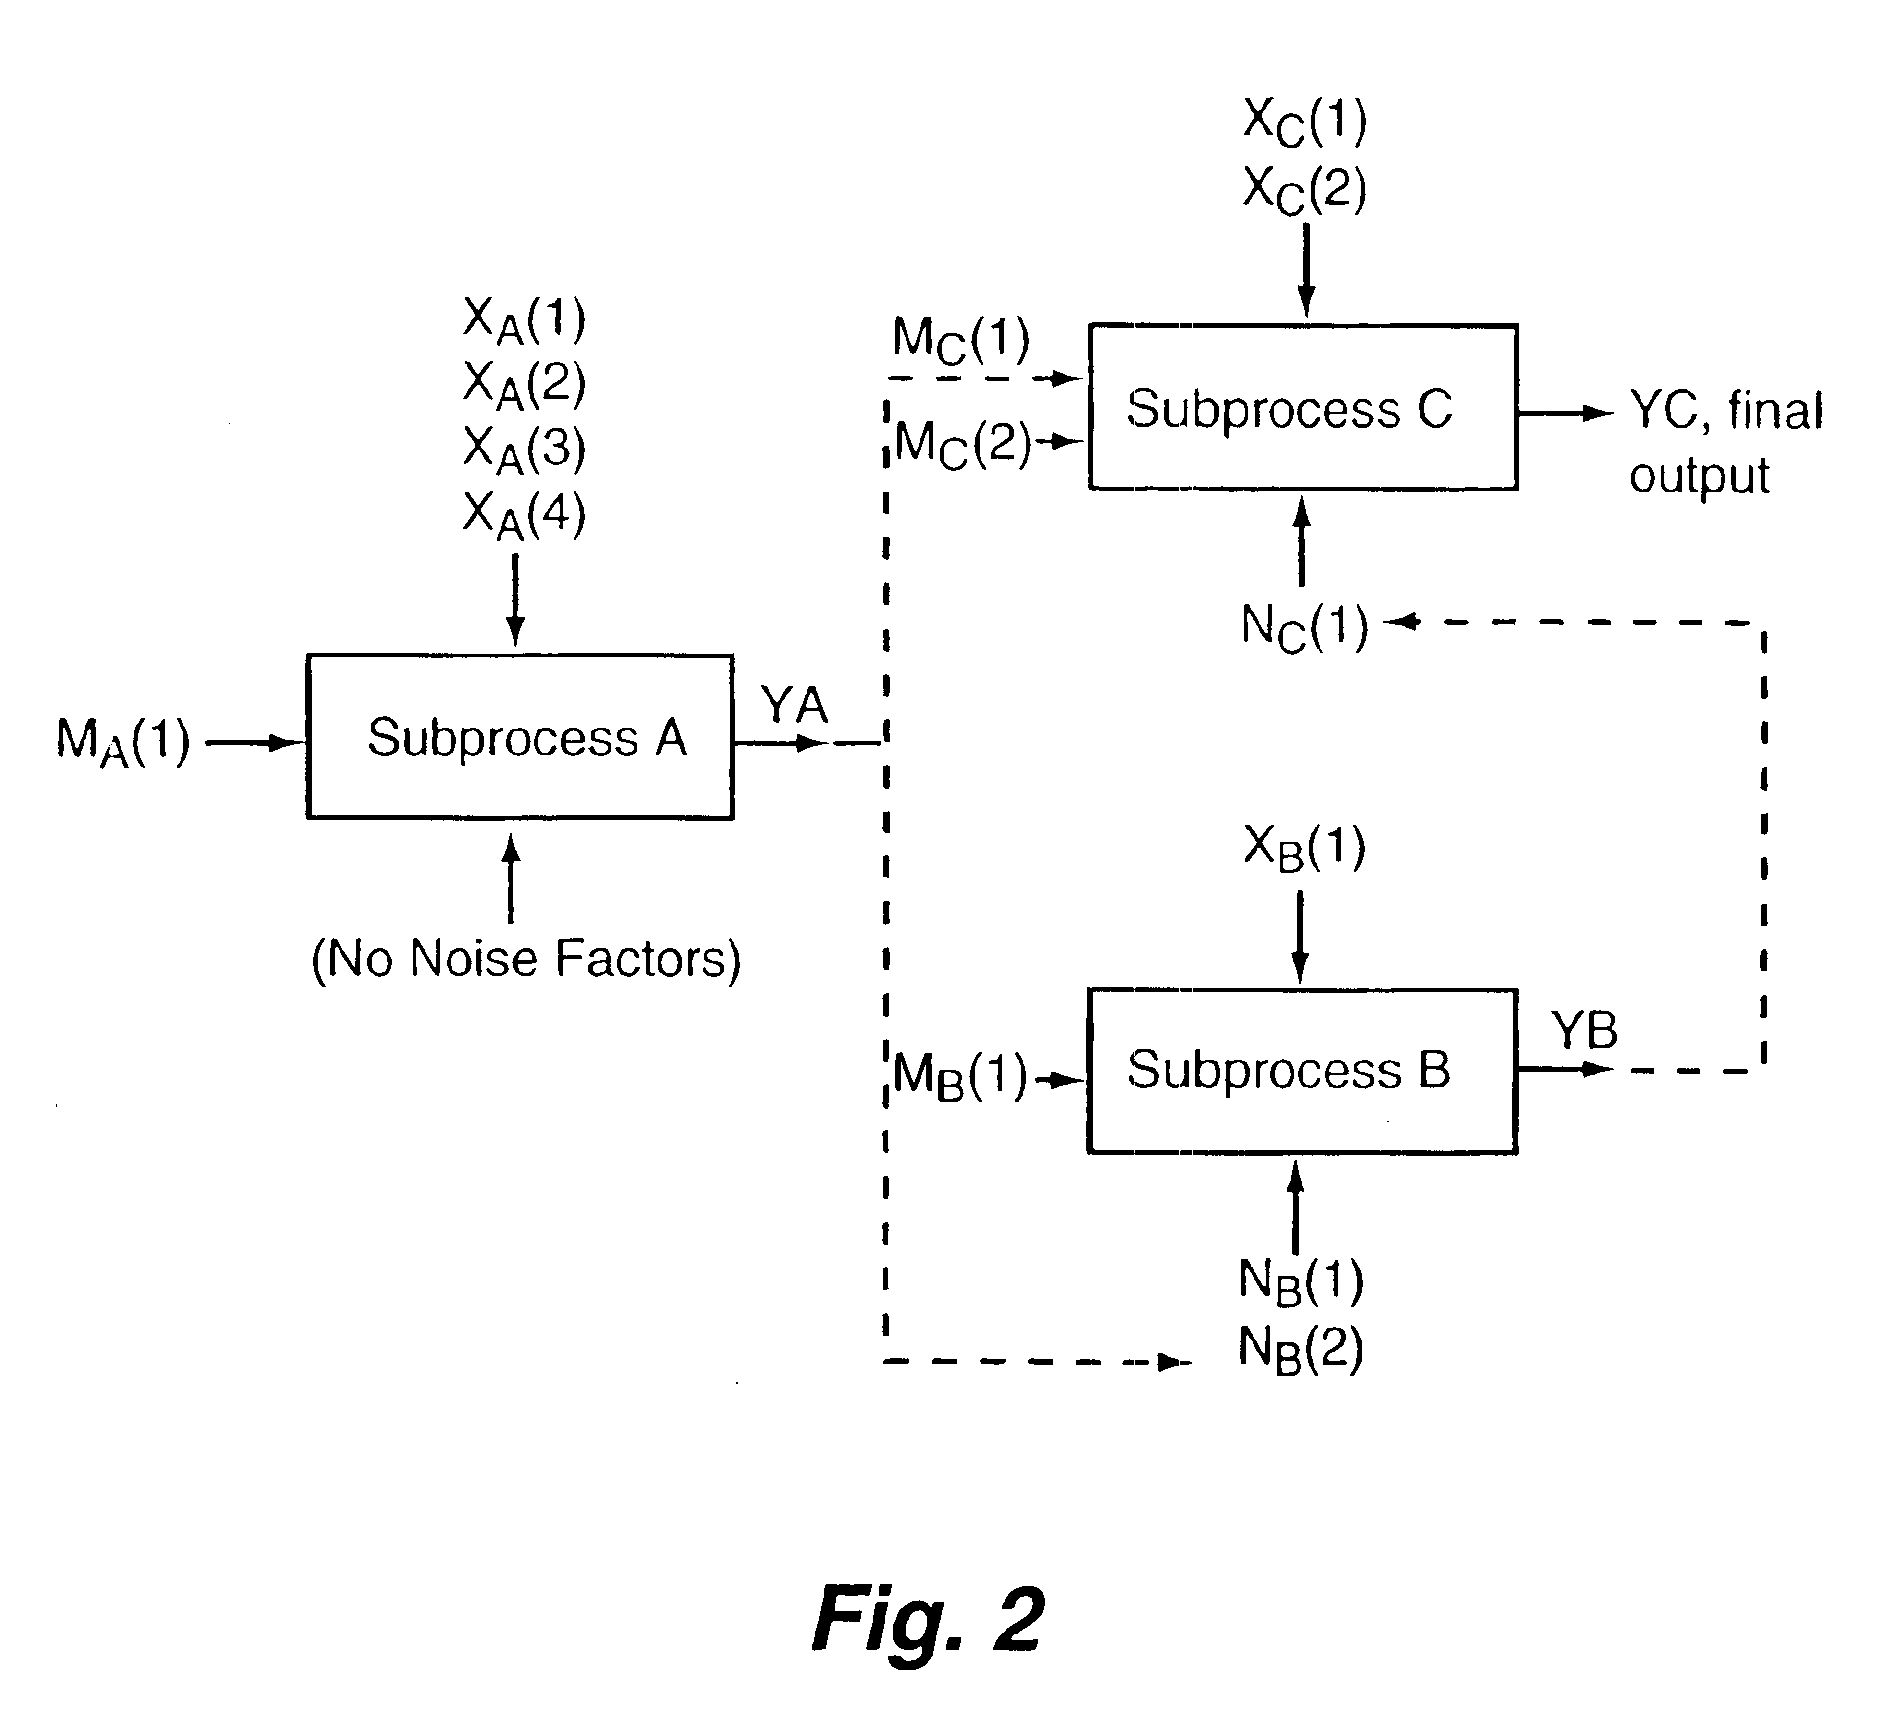
[0094]Consider the results obtained by executing the code in Appendix 4 using input data obtained from the response models fitted in Step 1. In all cases, the results are based on 100,000 Monte Carlo replications (samples). Table 10 gives some summary sample moments and quantiles of the distribution of the responses yA, yAfixed, yB, yBfixed, yC, and yCfixed for the case in which all the unconstrained signal and control factors[0095]MA(1), XA(1), XA(2), XA(3), XA(4), MB(1), XB(1), Mc(2), Xc(1), and Xc(2) have been set equal to 1. Of primary interest is the final system response yC and yCfixed.

[0096]

TABLE 10Example Problem Results When All Unconstrained Signal andControl Factors Are Set Equal To 1.0ResponseMeanSDMCError2.5%5.0%Median95.0%97.5%YA141.525.40.0891.499.9141.4183.2191.7YAfixed141.624.30.0894.2101.7141.6181.7189.2YB11.72.70.0096.47.311.816.217.1YBfixed11.82.60.0086.67.411.816.016.9YC26.44.20.0118.419.626.333.434.8YCfixed26.44.10.0118.719.926.433.234.6

[0097]The distrib...


PUM


Abstract

A computer-implemented method is implemented for determining the variability of a manufacturing system having a plurality of subsystems. Each subsystem of the plurality of subsystems is characterized by signal factors, noise factors, control factors, and an output response, all having mean and variance values. Response models are then fitted to each subsystem to determine unknown coefficients for use in the response models that characterize the relationship between the signal factors, noise factors, control factors, and the corresponding output response having mean and variance values that are related to the signal factors, noise factors, and control factors. The response models for each subsystem are coupled to model the output of the manufacturing system as a whole. The coefficients of the fitted response models are randomly varied to propagate variances through the plurality of subsystems and values of signal factors and control factors are found to optimize the output of the manufacturing system to meet a specified criterion.

Description

STATEMENT REGARDING FEDERAL RIGHTS[0001]This invention was made with government support under Contract No. W-7405-ENG-36 awarded by the U.S. Department of Energy and CRADA No. LA99C10420-A002. The government has certain rights in the invention.FIELD OF THE INVENTION[0002]The present invention relates generally to optimizing the performance of manufacturing systems, and, more particularly, to analysis and control of process variations in a manufacturing process to improve product and process reliability.BACKGROUND OF THE INVENTION[0003]Variability (or variation) in key process performance measures (such as measures of quality) is an extremely important aspect of most manufacturing processes. It is widely recognized that control of undesired variation can be instrumental in improving both process and product reliability. For example, consider the set of processing transformations illustrated in FIG. 2. The set of transformations depicted in FIG. 2 is referred to herein as a process or...

Claims


Application Information

Patent Timeline
Patent Type & Authority Patents(United States)
IPC IPC(8): G06F19/00G06Q10/00
CPCG06Q10/04
Inventor HAMADA, MICHAEL S.MARTZ, HARRY F.ELESWARPU, JAY K.PREISSLER, MICHAEL J.
Owner TRIAD NAT SECURITY LLC
Why Eureka
Try Eureka