Method and apparatus for the assimilation and visualization of information from 3D data volumes

a technology of data volume and assimilation method, applied in the field of data modeling and presentation, can solve the problems of complex software, large computer resources and complex processing, and difficult detection of stratigraphic and structural changes, and achieve the problem of difficult to identify fault surfaces within a 3-d volume where no fault reflections have been recorded

Inactive Publication Date: 2005-09-27
CONOCOPHILLIPS CO
View PDF17 Cites 38 Cited by
  • Summary
  • Abstract
  • Description
  • Claims
  • Application Information

AI Technical Summary

Problems solved by technology

Processing requires extensive computer resources and complex software to enhance the signal received from the subsurface and to mute accompanying noise which masks the signal.
Changes in stratigraphy and structure are often difficult to detect on traditional seismic displays due to the limited amount of information that seismic data contain in a cross-section view.
Although 3-D views provide an opportunity to see a much larger portion of these features, it is difficult to identify fault surfaces within a 3-D volume where no fault reflections have been recorded.
As pointed out in Giertsen, it is difficult to get a good understanding of complicated 3-D data set on a flat screen or a piece of paper.
It is also laborious and difficult to interact with 3-D objects using a keyboard and a mouse.
Furthermore, the screen size limits the amount of information that can be presented.
Yet another drawback of prior methods of displaying 3-D data is that the interactive output of a graphical workstation is necessarily viewable only by a limited number of viewers.
The number of possible schemes using these and other properties of color create presentation forms not possible using just shades of gray.
The potential increase in data density and the new presentation schemes present new problems to the interpreter.
Second, artifacts of the color display must be identified and removed from the interpretation.
Most black-and-white variable density displays also have this range limitation.
Each of these methods has advantages and drawbacks, but the advantages can not be realized unless a careful study of the color bar is made.
The scaling criteria for color displays is more critical than for black and white VA+WT displays and also creates more possibilities and problems.
Current commercially available 3D data presentation techniques for the petroleum exploration industry do not allow simultaneous display of information related to multiple geologic bedding planes (or features) without sacrificing display of information related to the relative or absolute sequencing of the planes (or features) to each other.
Thus, only a limited amount of information can be presented to the interpreter or engineer in a single unified format, preventing the interpreter or engineer from making necessary associations, interpretations, or inferences to the multiple physical or geologic information available.

Method used


Image

  • Method and apparatus for the assimilation and visualization of information from 3D data volumes
  • Method and apparatus for the assimilation and visualization of information from 3D data volumes
  • Method and apparatus for the assimilation and visualization of information from 3D data volumes

Examples


Embodiment Construction

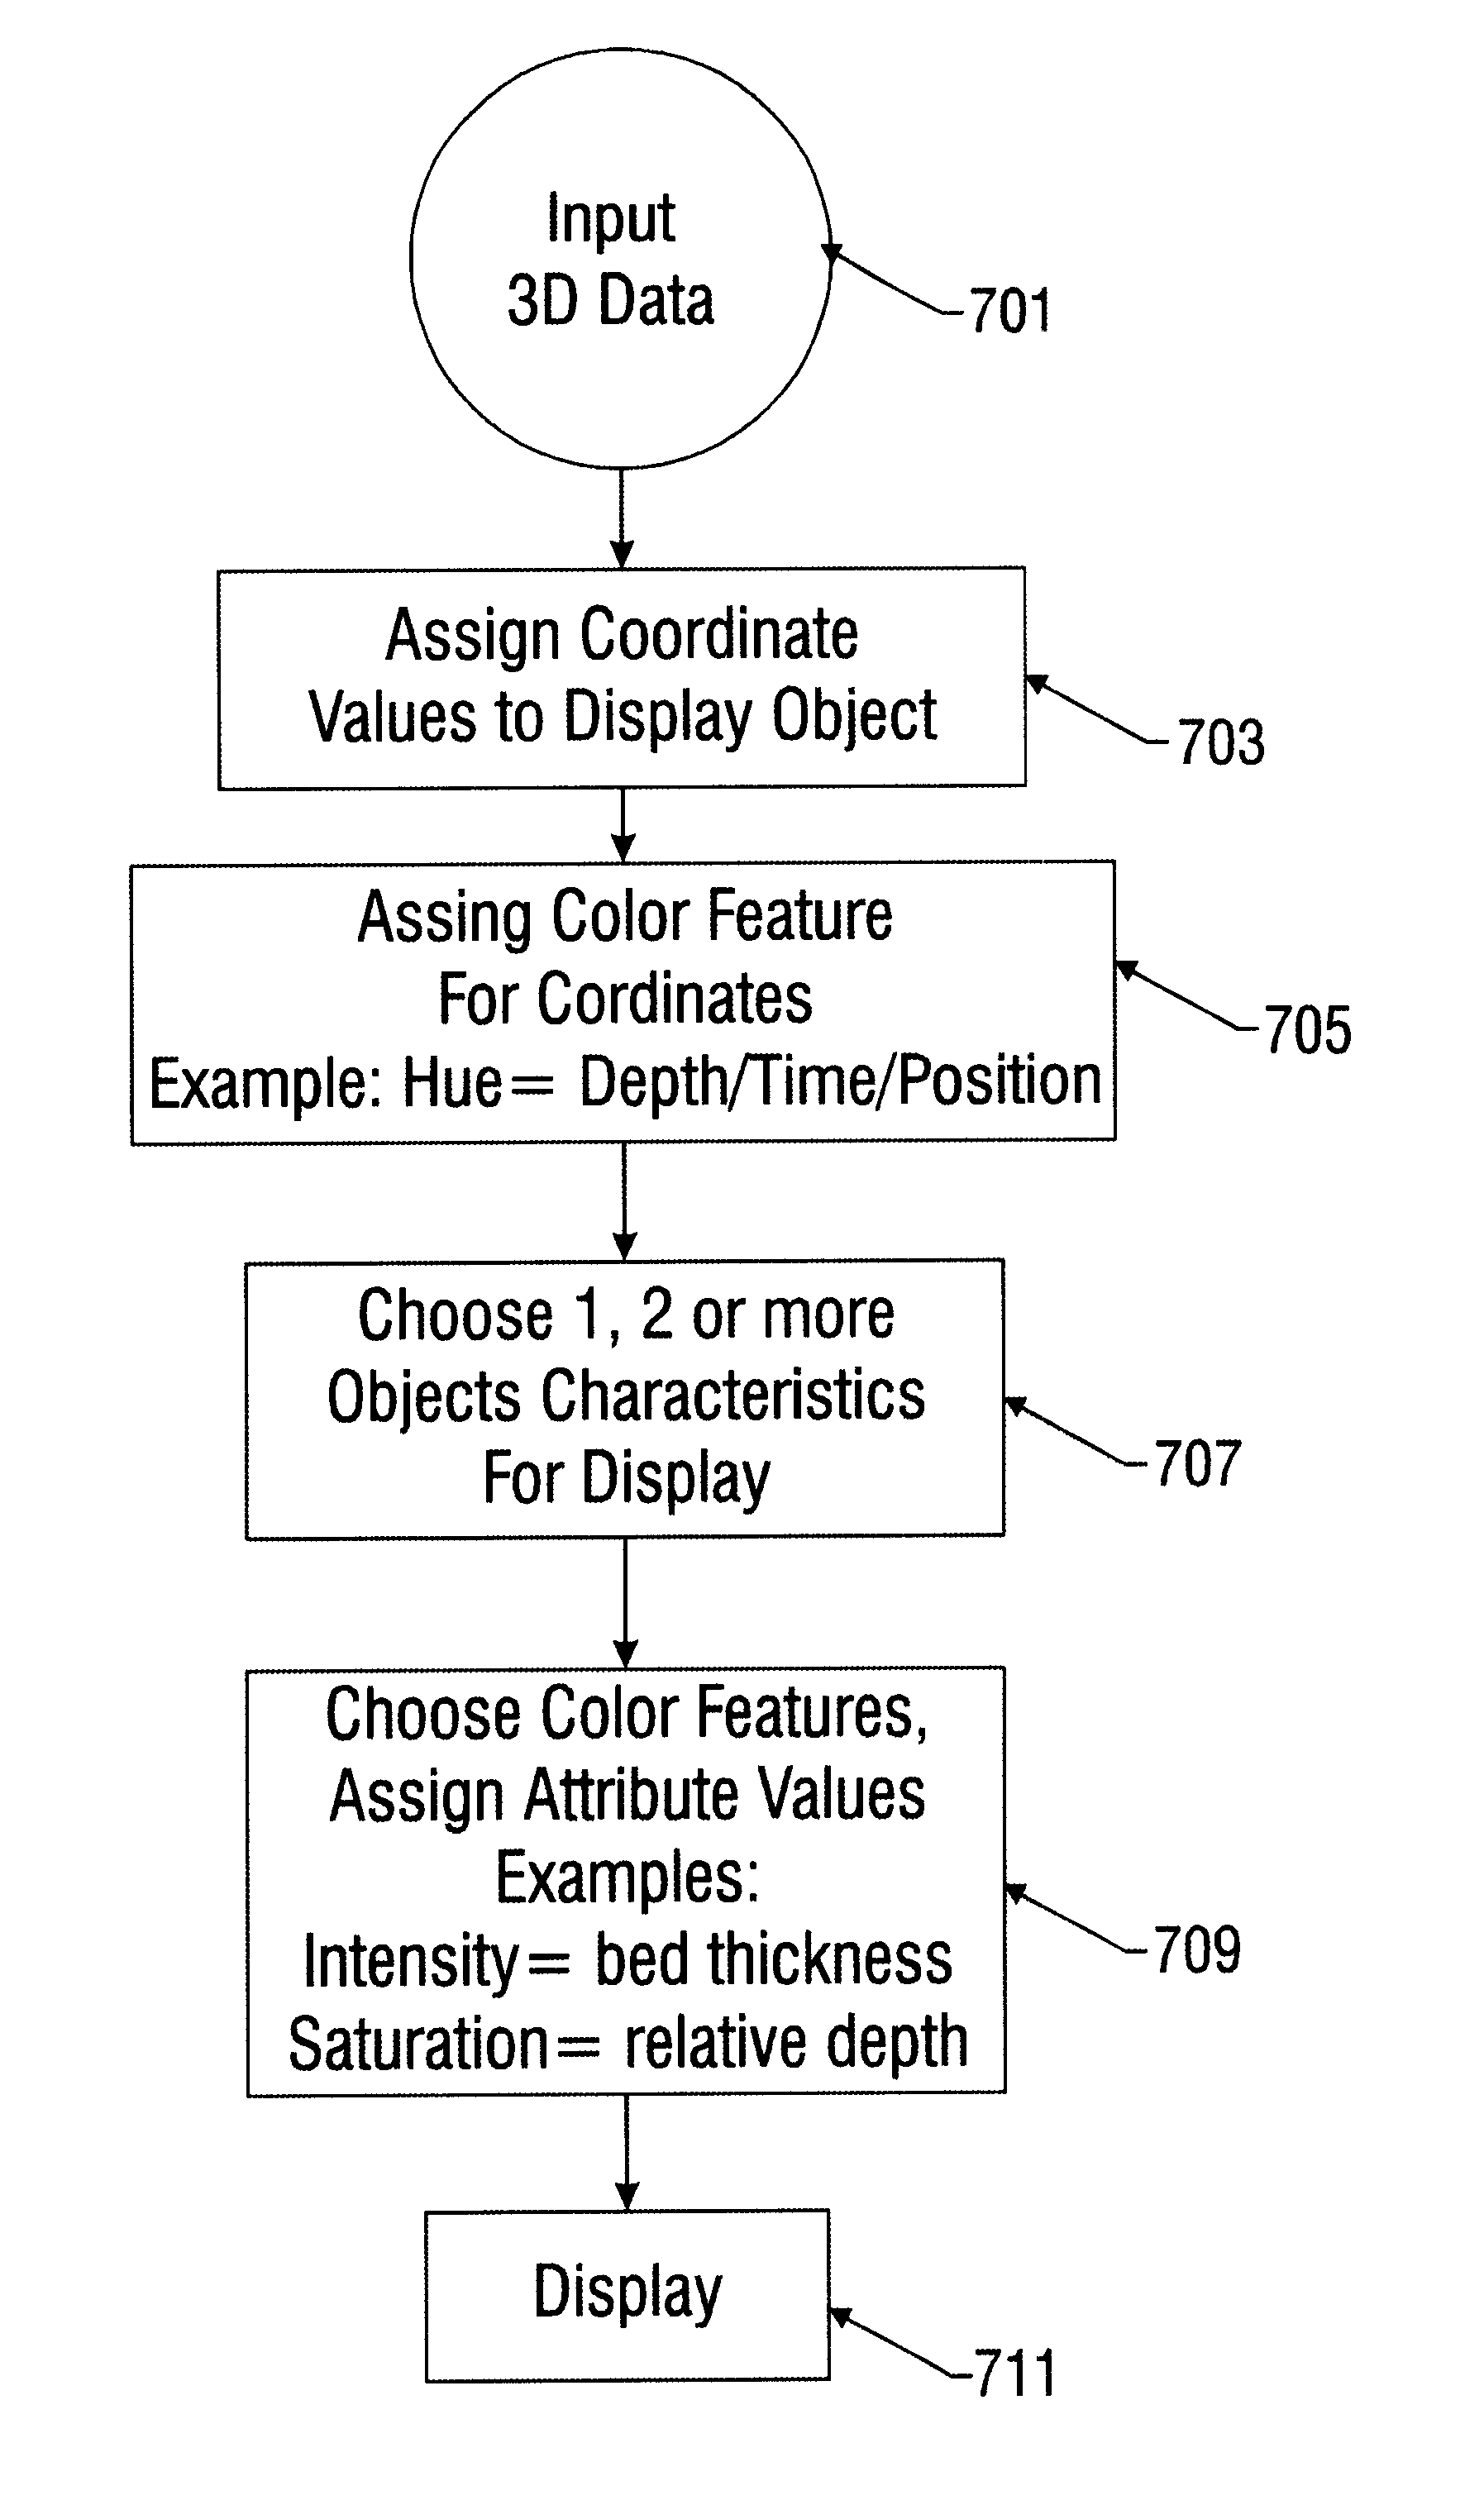
[0037]The present invention is a method and apparatus for the presentation, assimilation and visualization of characteristics of objects in and associated with large quantities of information from multidimensional data volumes, for example 3D geoscience data sets. The method and apparatus provides for displays of data objects and features and characteristics of data objects wherein these displays contain enhanced information. For example, a multidimensional display is able to simultaneously communicate an object's position, depth, thickness and density in one image. Additionally, other objects or features with the same or other characteristics can be displayed in the same image. Varying attribute values of one or more geological feature characteristics can be viewed in one display. Incorporating several attributes of objects in a display into a single image is more convenient relative to creating individual displays of separate characteristics. Other advantages of the invention will...


PUM


Abstract

The present invention provides a method and apparatus for displaying selected characteristics of geological features. Color-features, for example, hue, saturation and intensity, or other use selected color-features, are assigned to represent different attribute values of geological feature characteristics. The method provides for displaying multiple characteristics of multidimensional geological or other displays in one presentation. Various characteristics that may be displayed concurrently include geological feature position, shape, coordinates, thickness values, petrophysical values, amplitude values, and velocity values. The invention provides a device adapted for use by a workstation wherein geological data is read into memory and processed into a color display of a subterranean feature, or used in a computer programmed to produce images representative of a subsurface geological features.

Description

FIELD OF THE INVENTION[0001]This invention relates to the field of “data modeling and presentation” and, more particularly, to the use of color displays in geoscience data representation and displaying attributes of a 3-D volume of data for identifying structural and stratigraphic features in three dimensions.BACKGROUND OF THE INVENTION[0002]In the oil and gas industry, geophysical and geological prospecting techniques are commonly used to aid in the search for and evaluation of subterranean hydrocarbon deposits. Geophysical data are combined with geological data and interpreted for purposes of analysis and for presentation to decision makers. The interpretations, and the information they contain, form the basis for decisions whether and where to drill for hydrocarbons. The interpretations are comprised of representations of subterranean geological features or objects like bedding layers, fault traps, anticlines, and other features well known to practitioners in the art. For example...

Claims


Application Information

Patent Timeline
Patent Type & Authority Patents(United States)
IPC IPC(8): G01V1/28G01V1/34
CPCG01V1/34
Inventor KNOBLOCH, CHARLES S.
Owner CONOCOPHILLIPS CO
Why Eureka
Try Eureka