

Technology evaluation system and method
a technology evaluation and technology evaluation technology, applied in the field of technology evaluation systems, can solve the problems of inability to easily set a trading price, licensees are unwilling to pay more than 15% of the total revenues, and it is not easy to get an appropriate reference sample for this method
- Summary
- Abstract
- Description
- Claims
- Application Information
AI Technical Summary
Benefits of technology
Problems solved by technology
Method used
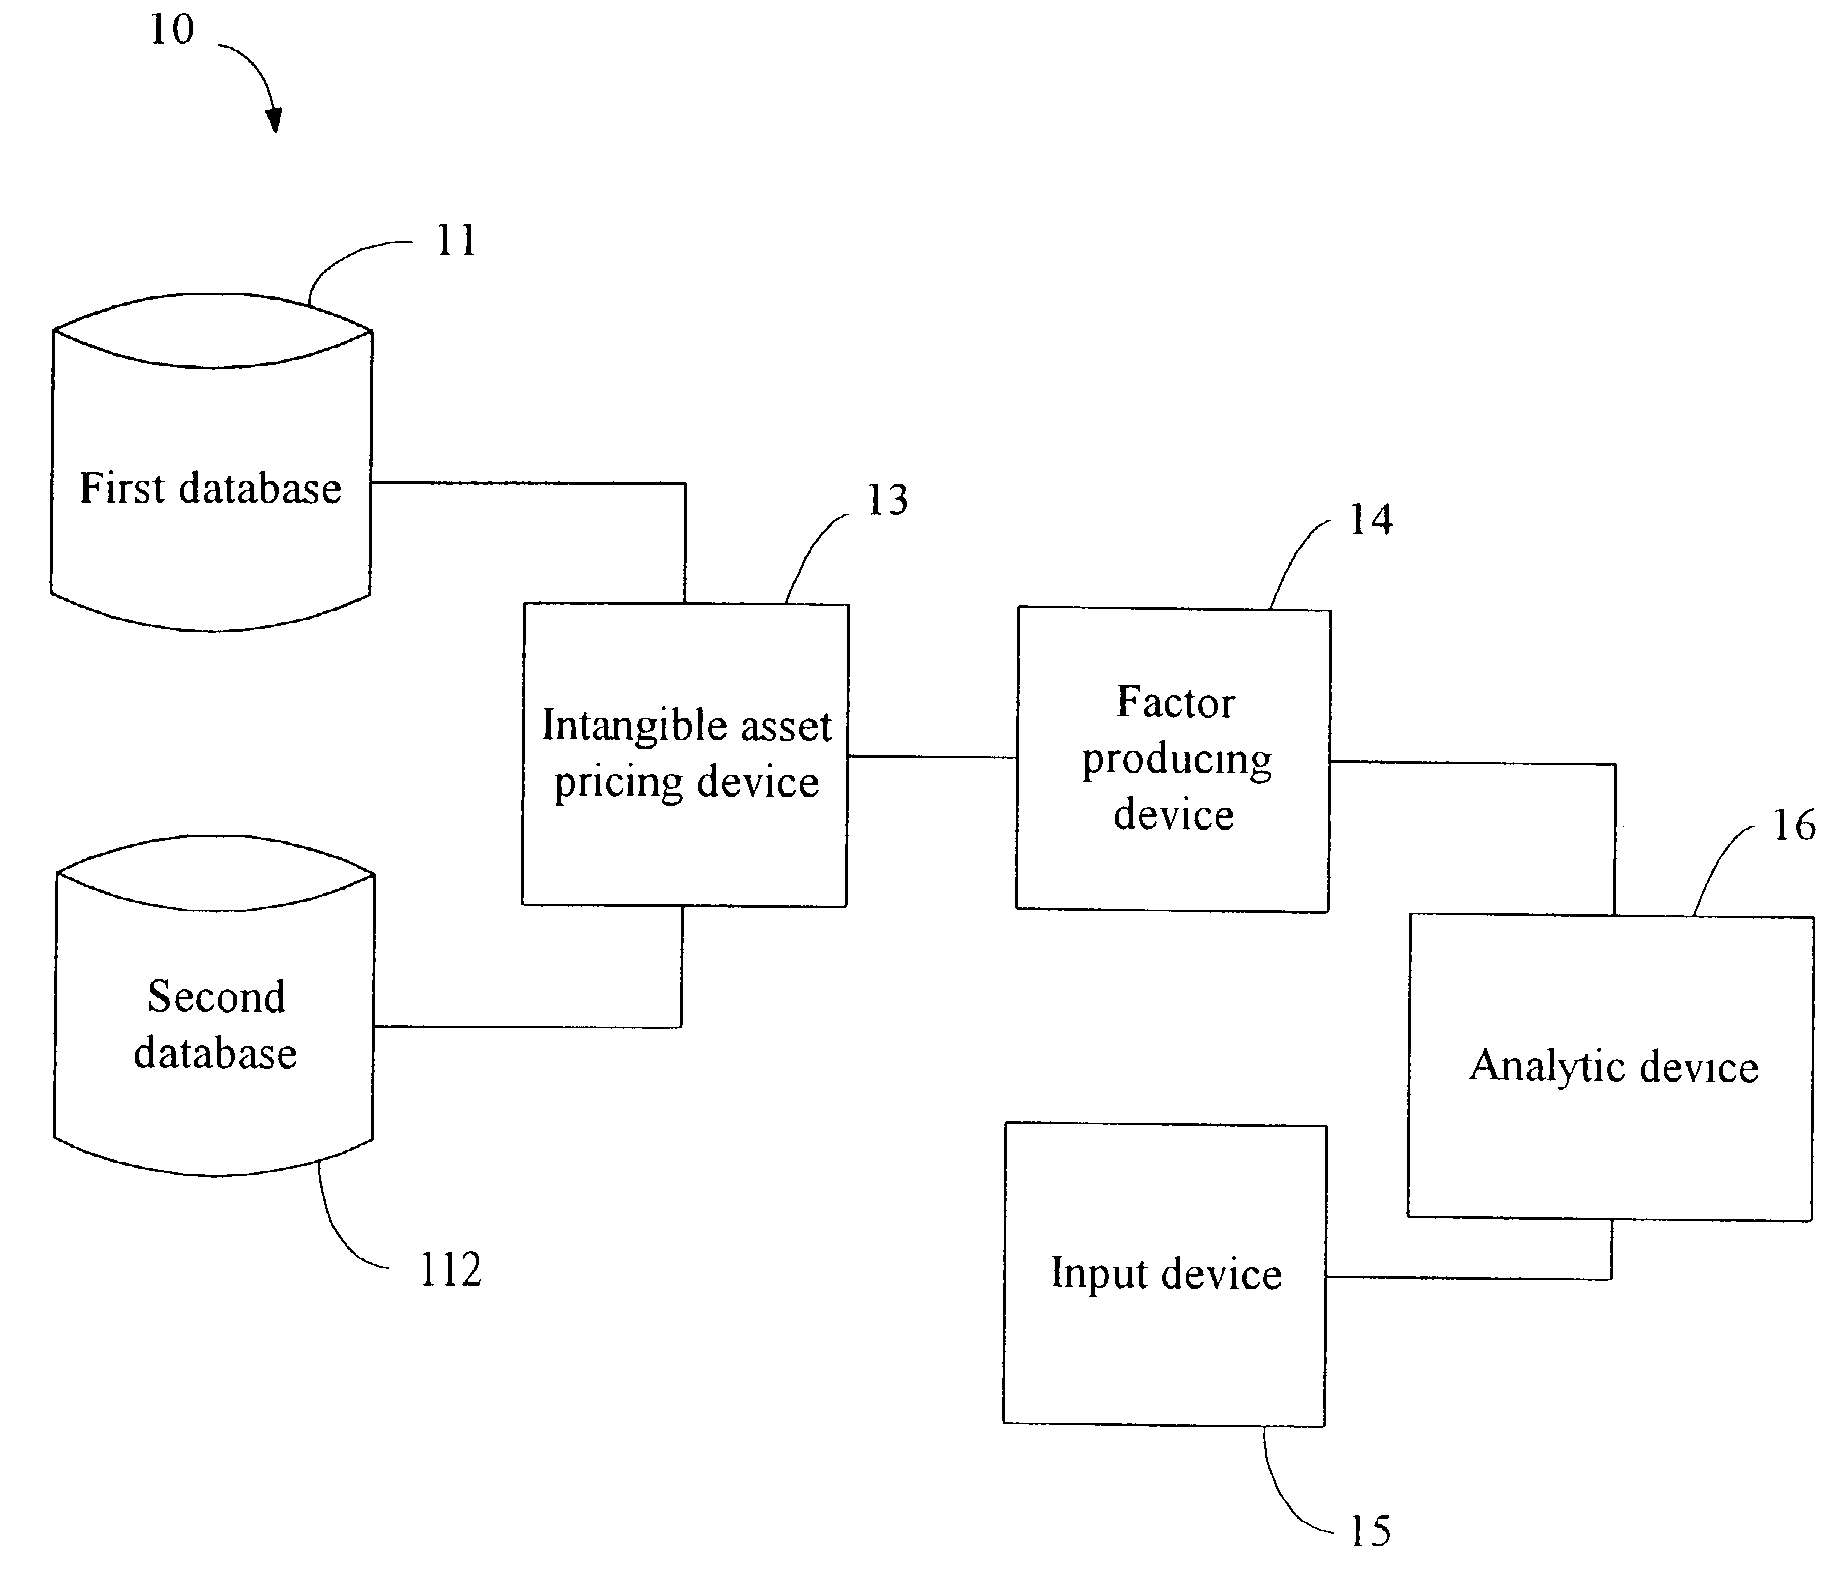
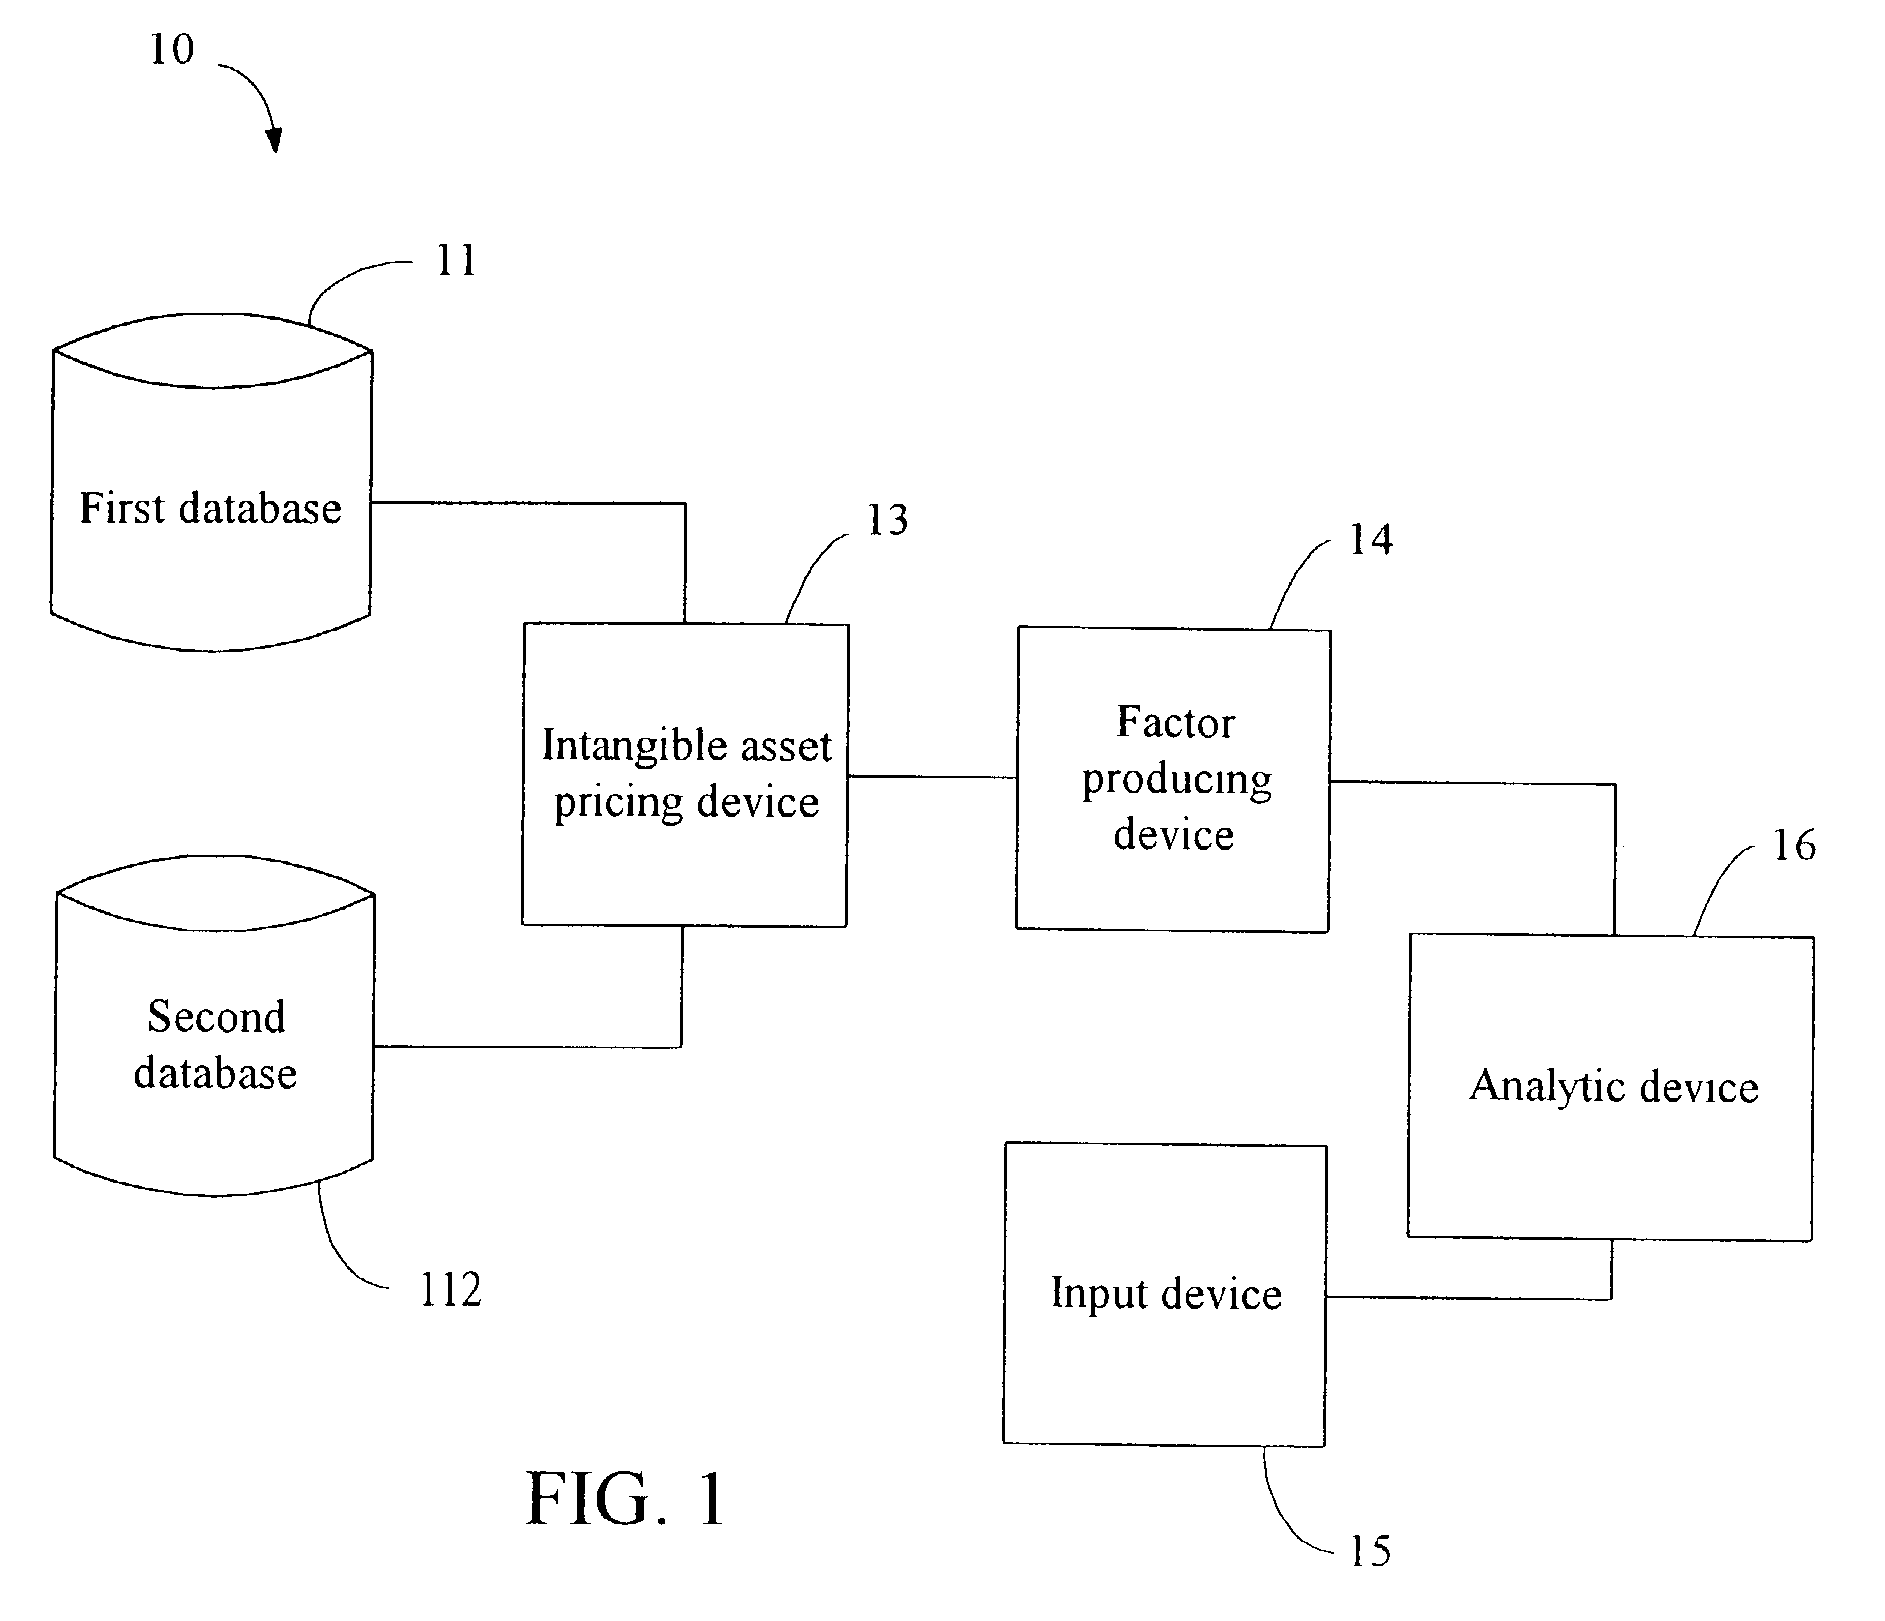
Image

Examples
embodiment 2
[0050]In embodiment 2, as shown in the above Table, the average of the Patent value can be substitute for the average of the R&D value, and the first SD of the Patent value can be substitute for the first SD of the R&D value. The predicted value of the technology is defined as follows:
EV2=PV·N(d1)−(E / erT)·N(d2)
Wherein EV2 is the predicted value of the technology, PV is the average of the patent value of the corresponding subgroup, E is the predetermined cost of the technology needed for launch, T is the predetermined time of the technology needed for launch, e is a natural exponent, r is a predetermined rate, N(d1) is an accumulative standard normal distribution function value at d1, N(d2) is an accumulative standard normal distribution function value at d2, d1=(ln(PV / E)+rT) / (δT1 / 2)+0 5δT1 / 2, d2=d1δT1 / 2, δ is the first standard deviation of the Patent Value of the corresponding subgroup.
embodiment 3
[0051]With EV1 and EV2, in embodiment 3 the analytic device 16 can also produces a predicted value of said technology, which is smaller than EV1 but equal to or greater than EV2
embodiment 4
[0052]In embodiment 4, the weighted average of the R&D value can be substitute for the average of the R&D value, and the second SD of the R&D value can be substitute for the first SD of the R&D value. The predicted value of the technology is defined as follows
EV4=WRV*N(d1)−(E / erT)*N(d2);
Wherein EV4 is the predicted value of the technology, WRV is the weighted average of the research-and-develop value of the corresponding subgroup, E is the predetermined cost of the technology needed for launch, T is the predetermined time of the technology needed for launch, e is a natural exponent, r is a predetermined rate, N(d1) is an accumulative standard normal distribution function value at d1, N(d2) is an accumulative standard normal distribution function value at d2, d1=(ln(WRV / E)+rT) / (δT1 / 2)+0.5δT1 / 2, d2=d1−δT1 / 2, δ is the second standard deviation of the research-and-develop value of the corresponding subgroup.
PUM
 Abstract
Description
Claims
Application Information