

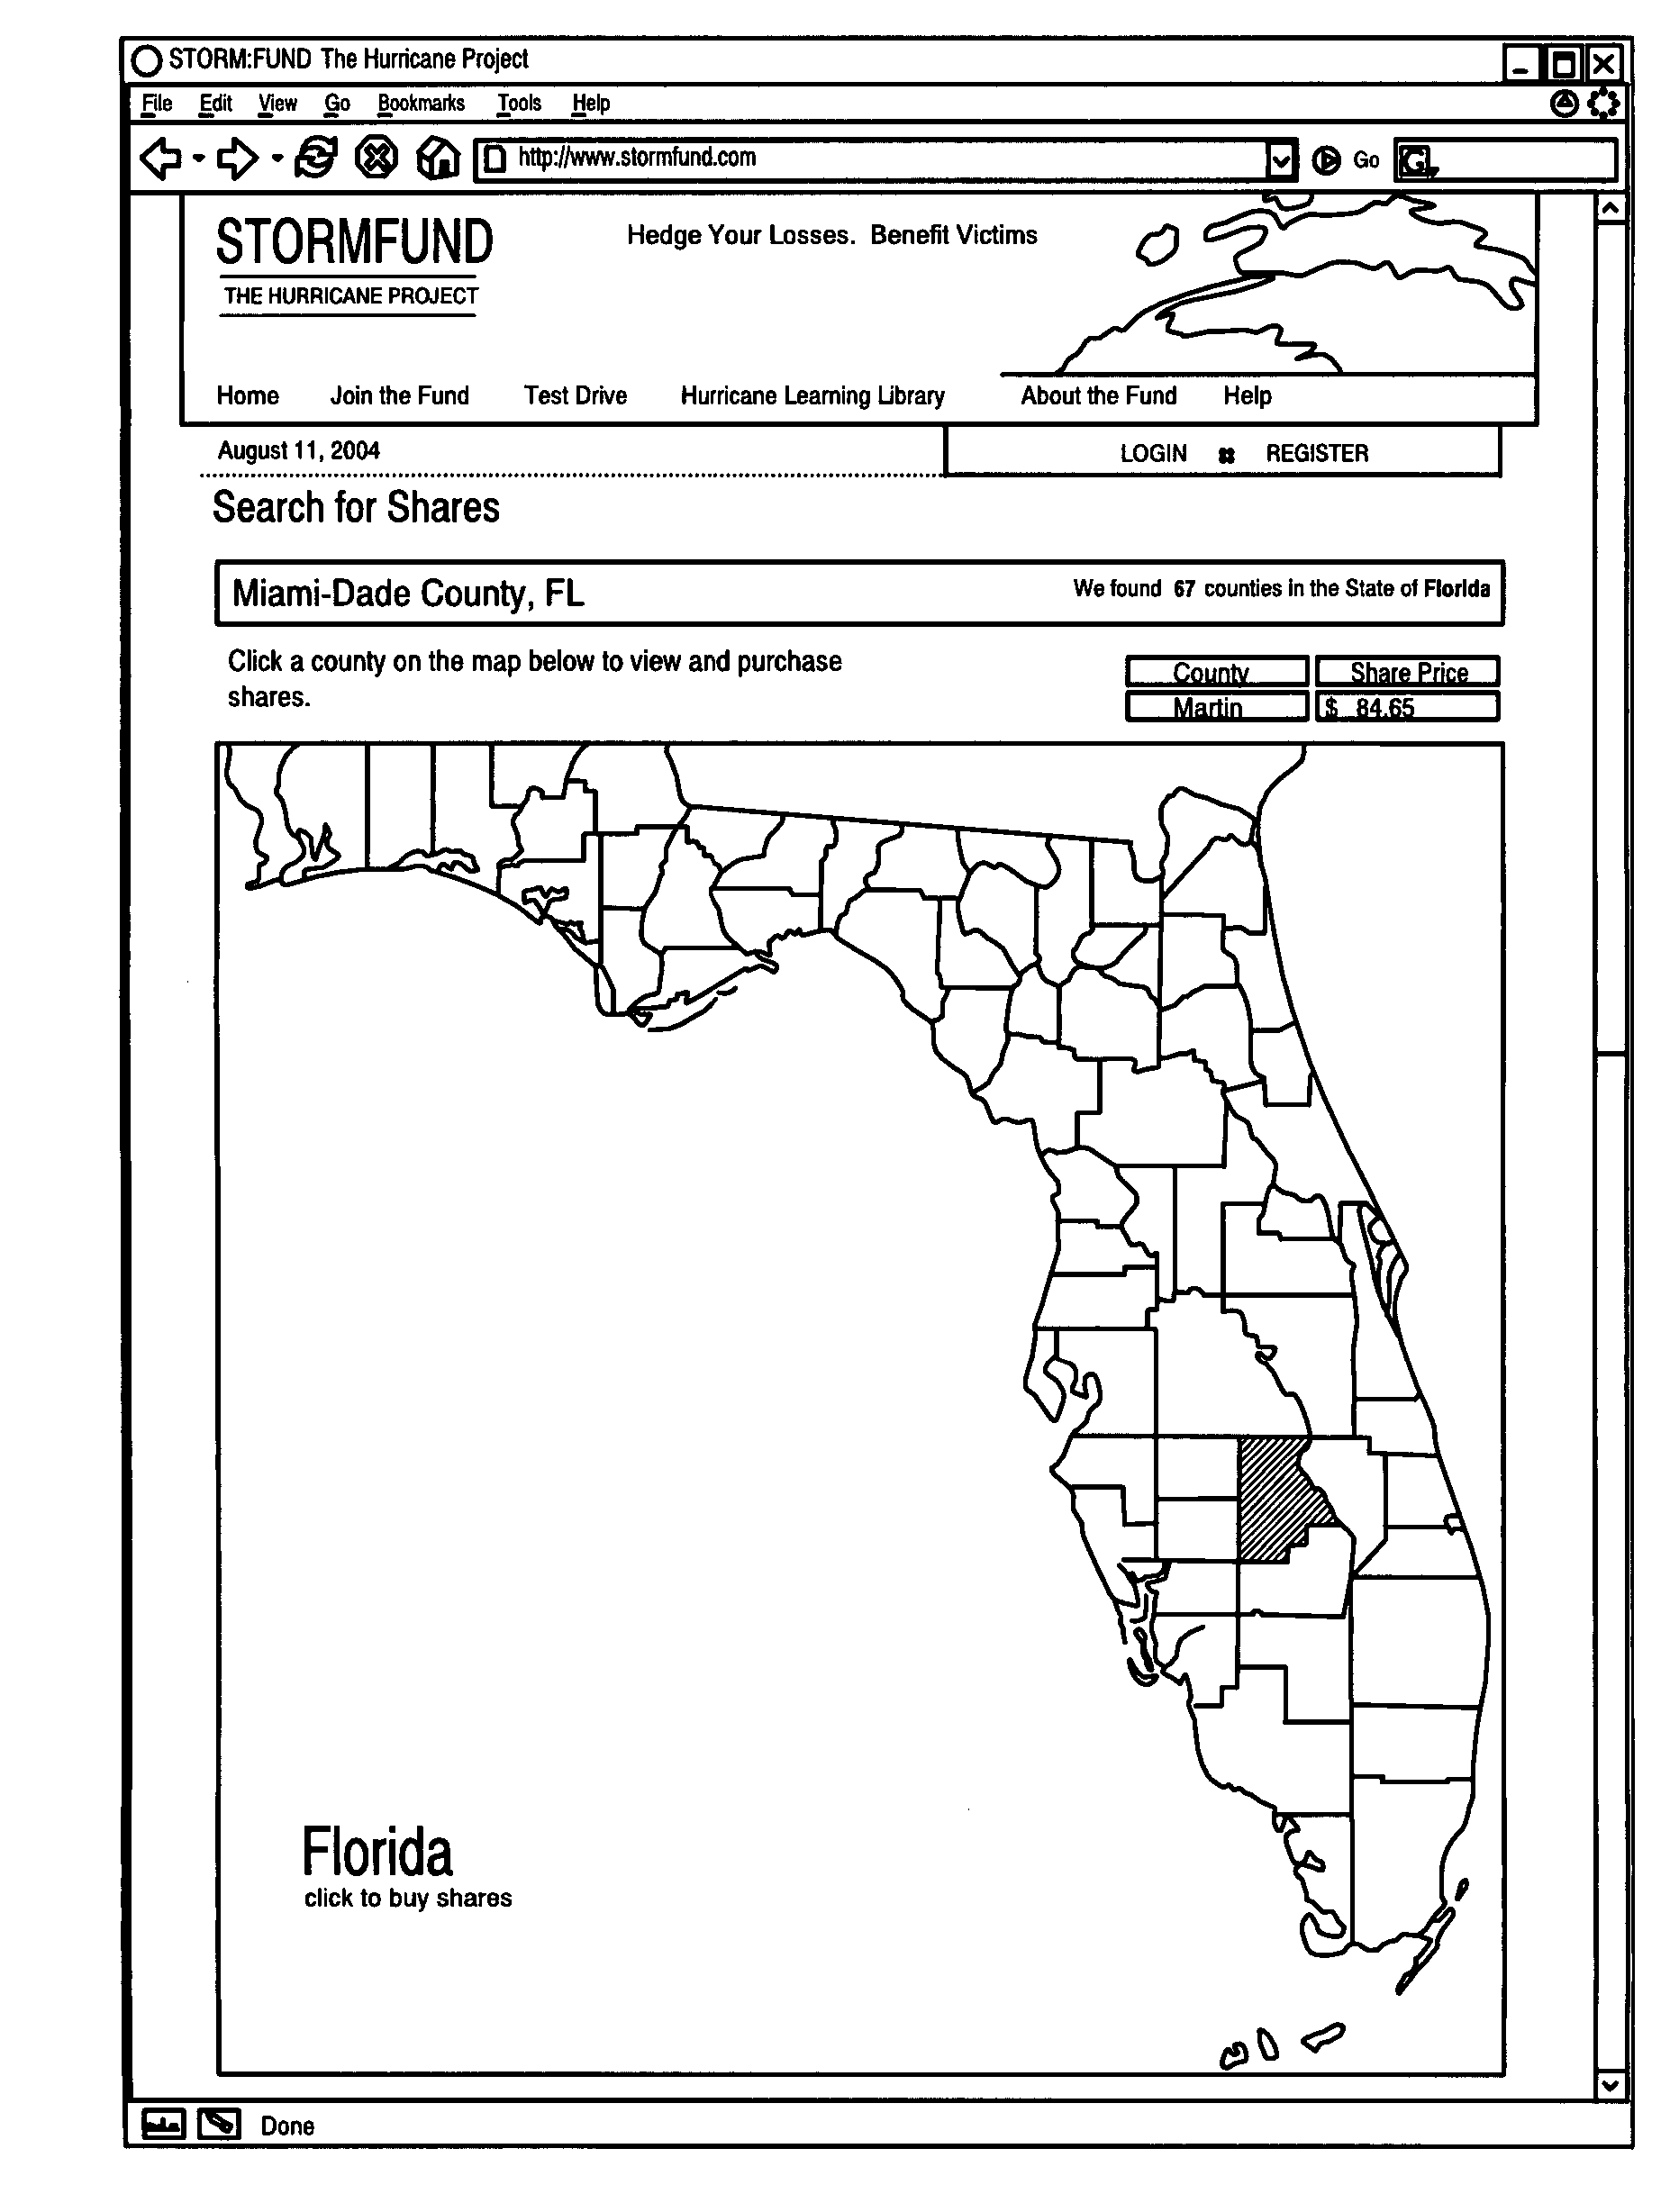
Graphical user interface for financial activity concerning tropical weather events
a financial activity and graphical user interface technology, applied in the field of computerized investment activity, can solve problems such as inability to obtain adequate insurance, produce torrential rain and floods, and particular participants may suffer damage from natural phenomena, and achieve the effect of high maximum sustained wind speed
- Summary
- Abstract
- Description
- Claims
- Application Information
AI Technical Summary
Benefits of technology
Problems solved by technology
Method used
Image

Examples
example 1
[0172]Assuming a first auction has concluded at a time in January, before the conventional “hurricane season”, the “stage 1” probability, calculated as set forth herein, is 0.02. Assuming the previous financial activity sold 5000 shares or options for the geographical area of interest, and that collectively, all the auctions took in $25 million overall. The minimum unit price would then be (0.02)×($25 million) / 5000=$100, and therefore, nobody could bid less than a $100 minimum price. If there were more takers than shares or options, some or all of the bidders at $100 would be out of luck.
example 2
[0173]Assuming a time in July, when there is a tropical storm in existence, in a location that is favorable for hitting the geographical area (e.g. county of interest. The “stage 2” probability for that area is calculated as set forth herein to be 0.10. There are now 100,000 shares or options that have been bought for the geographical area of interest, and the total pot is $2 billion. Minimum bid price would be (0.10)×($2 billion) / 100,000=$2000.
example 3
[0174]That tropical storm contemplated in example 2 has dissipated and now poses no threat to the geographical area of interest. Also, there are currently no other storms that are threatening, and the probability drops back to 0.02. There's now $2.1 billion in the pot, and 105,000 shares or options have been bought for the geographical area of interest. The minimum bid price has gone down because the probability has gone down: (0.02)×($2.1 billion) / 105,000=$400.
[0175]In each of the examples above, there would preferably be separate auctions for each geographical area in play (with one or more auctions for each geographical area), with the degree of investor interest determining whether and / or how much the price would rise above the levels indicated. Also, it is generally preferred that the number of units on offer at any one time would be limited to a fixed number, it being expected that, if the total offer is unlimited, there would be no incentive to bid higher than the reserve pri...
PUM
 Abstract
Description
Claims
Application Information