Method for monitoring and displaying of utility consumption

a utility consumption and display method technology, applied in the field of display utility consumption data for realty properties, can solve problems such as cumbersome review of methods

Active Publication Date: 2013-03-12
BYRAM LAB INC
View PDF23 Cites 22 Cited by
  • Summary
  • Abstract
  • Description
  • Claims
  • Application Information

AI Technical Summary

Benefits of technology

[0005]The zones preferably correspond to one of: regional geographic locations, local geographic locations, townships, contiguous properties in a selected locale, buildings in a selected property, and portions of a selected building. The display area preferably corresponds to one of: a continent, a nation, a regional geographic location, a local geographic location, a township, a selected locale, a contiguous property, buildings in a selected property, and a building. The display area may be zoomed from displaying a full view of the display area, to a selected portion of the display area, and to a selected one of the zones, wherein when zoomed to the selected one of the zones the properties comprising the selected one of the zones are displayed as newly defined zones. A full view of the display area may be viewed simultaneously with the selected portion of the display area and with the selected zone. Selected types of utility consumption may be filtered to display only at least one selected utility. Slider controls are displayed for use to change relative values for the utility consumption and the energy intensity in the display area, such that the sizes and the colors for the geometric forms are adjusted to display the effect of the changes to consumption and utility rates. A histogram function slider also displays consumption for selected time periods.

Problems solved by technology

Although satisfactory for small real estate portfolios, this method is cumbersome for review for real estate portfolios having a large number of properties.

Method used


Image

  • Method for monitoring and displaying of utility consumption
  • Method for monitoring and displaying of utility consumption
  • Method for monitoring and displaying of utility consumption

Examples


Embodiment Construction

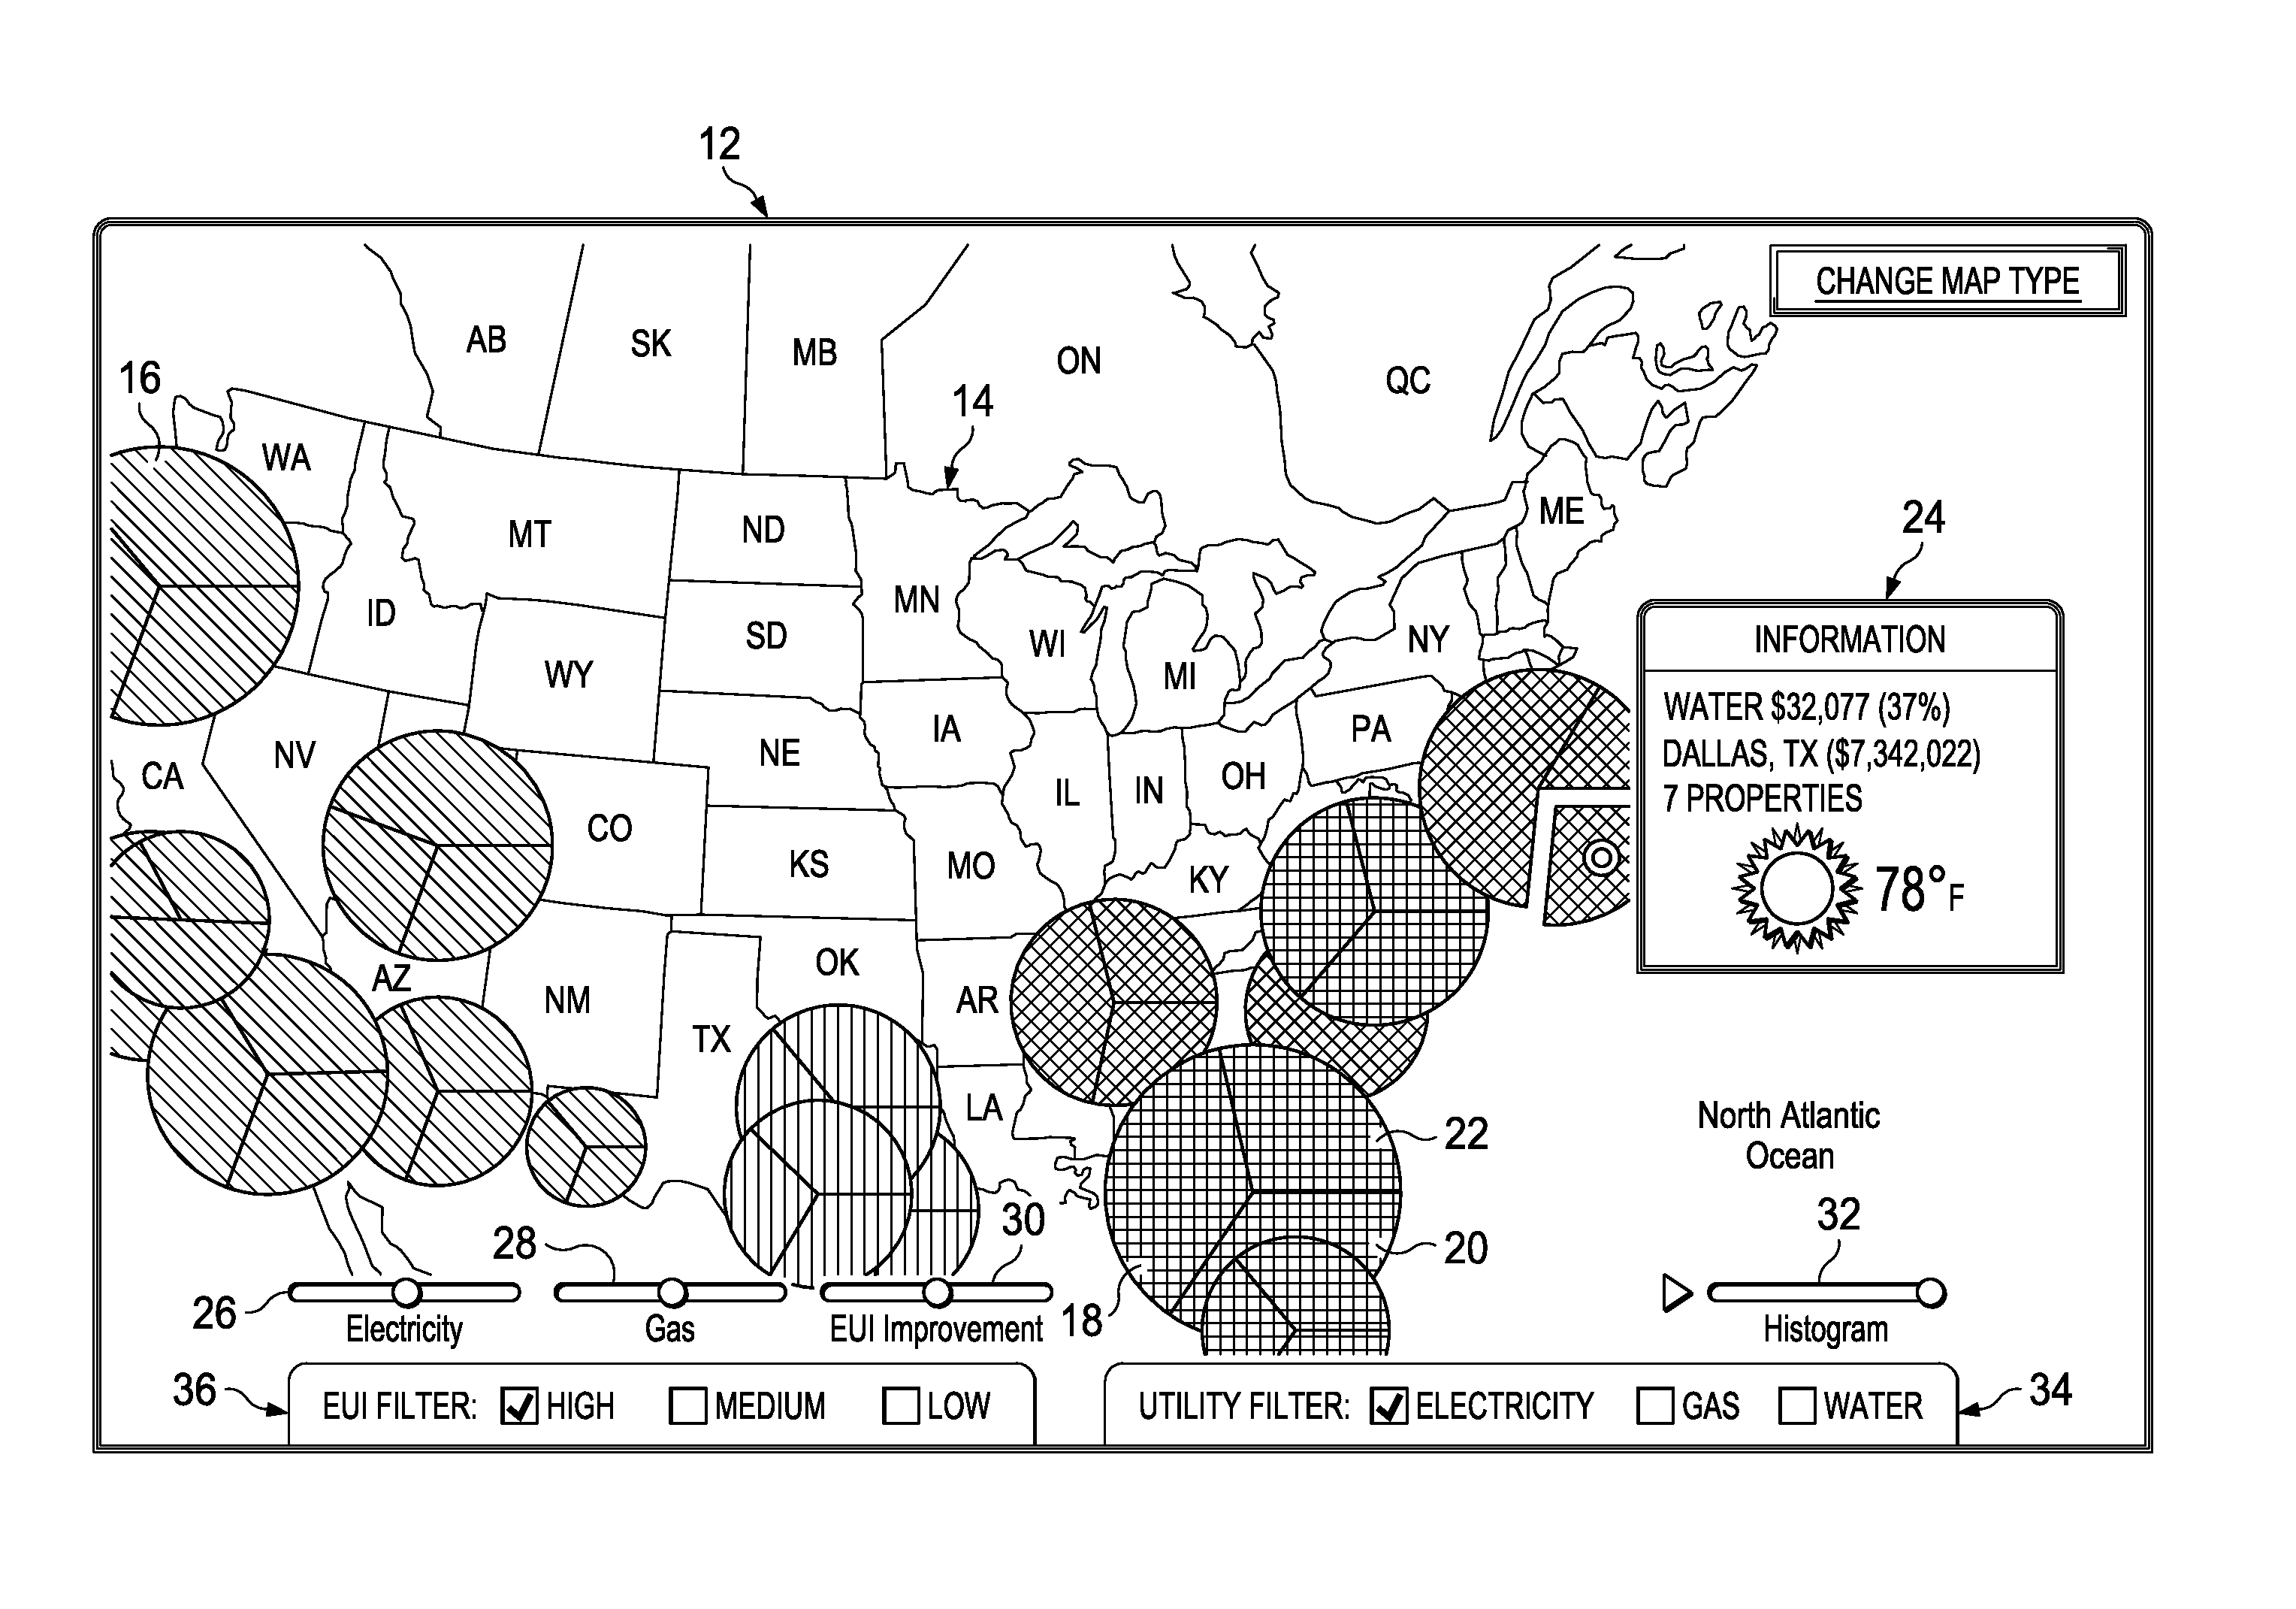
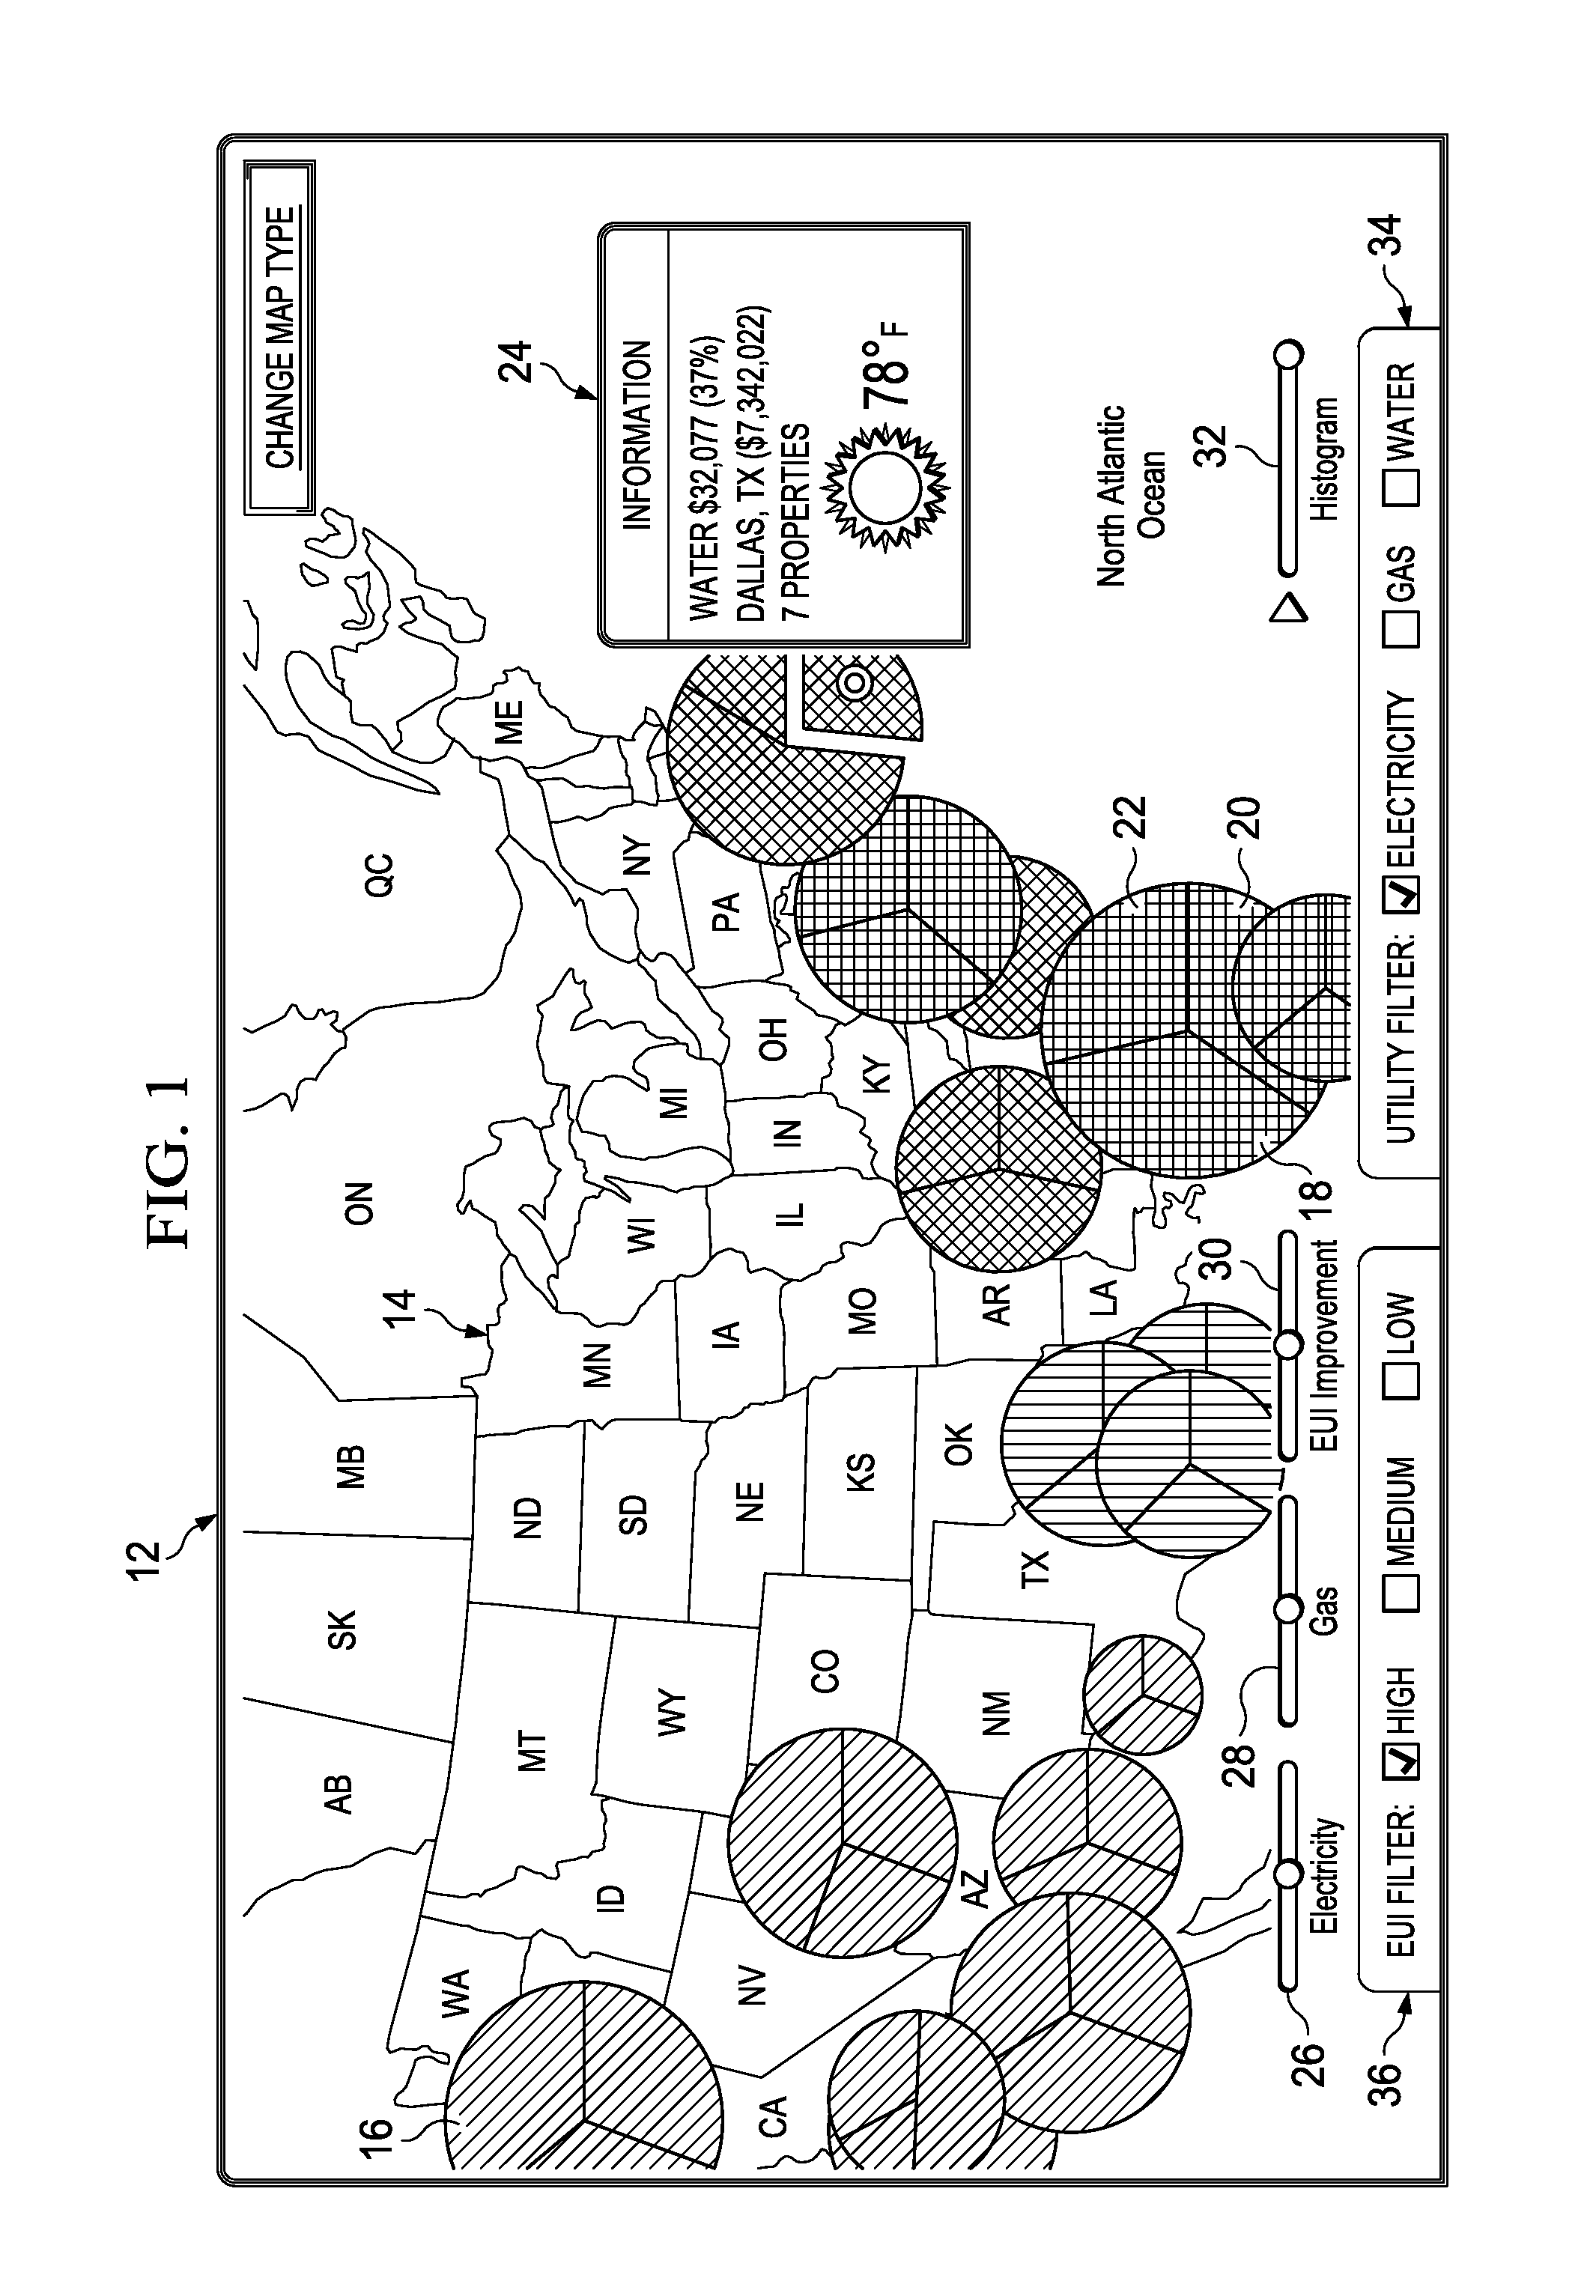
[0017]Referring to the Figures, FIG. 1 is a screen shot 12 illustrating a regional view for a national real estate property portfolio according to the method for monitoring and displaying utility consumption of the present invention. The display method is generally intended for owners of multiple properties located in various geographic regions and allows such owners to view a graphic display showing relative utility consumption of various regions in terms of both total utility consumption and relative use intensity. The relative use intensity provides an indication of the efficiency of utility usage for properties in a particular region. In general, total consumption is displayed in terms of either total combined usage for electricity, gas and water for a region over a selected period of time, such as a twelve month rolling average. The total consumption may be expressed in terms of total costs. If total consumption in terms of costs is being viewed, then the efficiency may be expr...


PUM


Abstract

A method is disclosed for displaying utility consumption of a property portfolio for zones of a display area. First values correspond to utility consumption and second values corresponding to consumption intensity are first determined. The first values for each zone are ranked from high to low values and associated with a size of a geometric form corresponding to each of the zones. Similarly, the second values for each zone are ranked from high to low values and associated with a corresponding color, with a highest of the second values having a first color representing a highest consumption intensity, the smallest of the second values having a second color representing the lowest consumption intensity, and the remaining of the second values are associated with mixtures of the first color and second color. The respective geometric forms for each of the zones are displayed on the map at respective spatial locations.

Description

TECHNICAL FIELD OF THE INVENTION[0001]The present invention relates in general to displaying utility consumption data for realty property, and in particular to graphic display of relative utility consumption for realty property portfolios.BACKGROUND OF THE INVENTION[0002]Various methods have been provided for presenting utility consumption for a collection of properties in a real estate portfolio. One common method is to list numeric values of consumption in tabular form, such as in a spread sheet. However, a tabular form requires review and comparison of listed numbers in a column, and interpolation to make a determination of which properties would benefit most from review and auditing of utility consumption. Although satisfactory for small real estate portfolios, this method is cumbersome for review for real estate portfolios having a large number of properties. A simple virtual display of utility consumption and energy consumption intensity is desired to more easily identify prop...

Claims


Application Information

Patent Timeline
Patent Type & Authority Patents(United States)
IPC IPC(8): G06Q10/00G06F17/00
CPCG06Q50/163
Inventor WATSON, ROBERT D.
Owner BYRAM LAB INC
Why Eureka
Try Eureka