

Digital oscillograph and its display method
A technology of digital oscilloscope and display method, applied in the field of digital oscilloscope display and digital oscilloscope, can solve the problems of smooth and delicate visual effects without analog oscilloscope, and achieve the effect of good visual display effect and delicate signal waveform.
- Summary
- Abstract
- Description
- Claims
- Application Information
AI Technical Summary
Problems solved by technology
Method used
Image

Examples
Embodiment 1
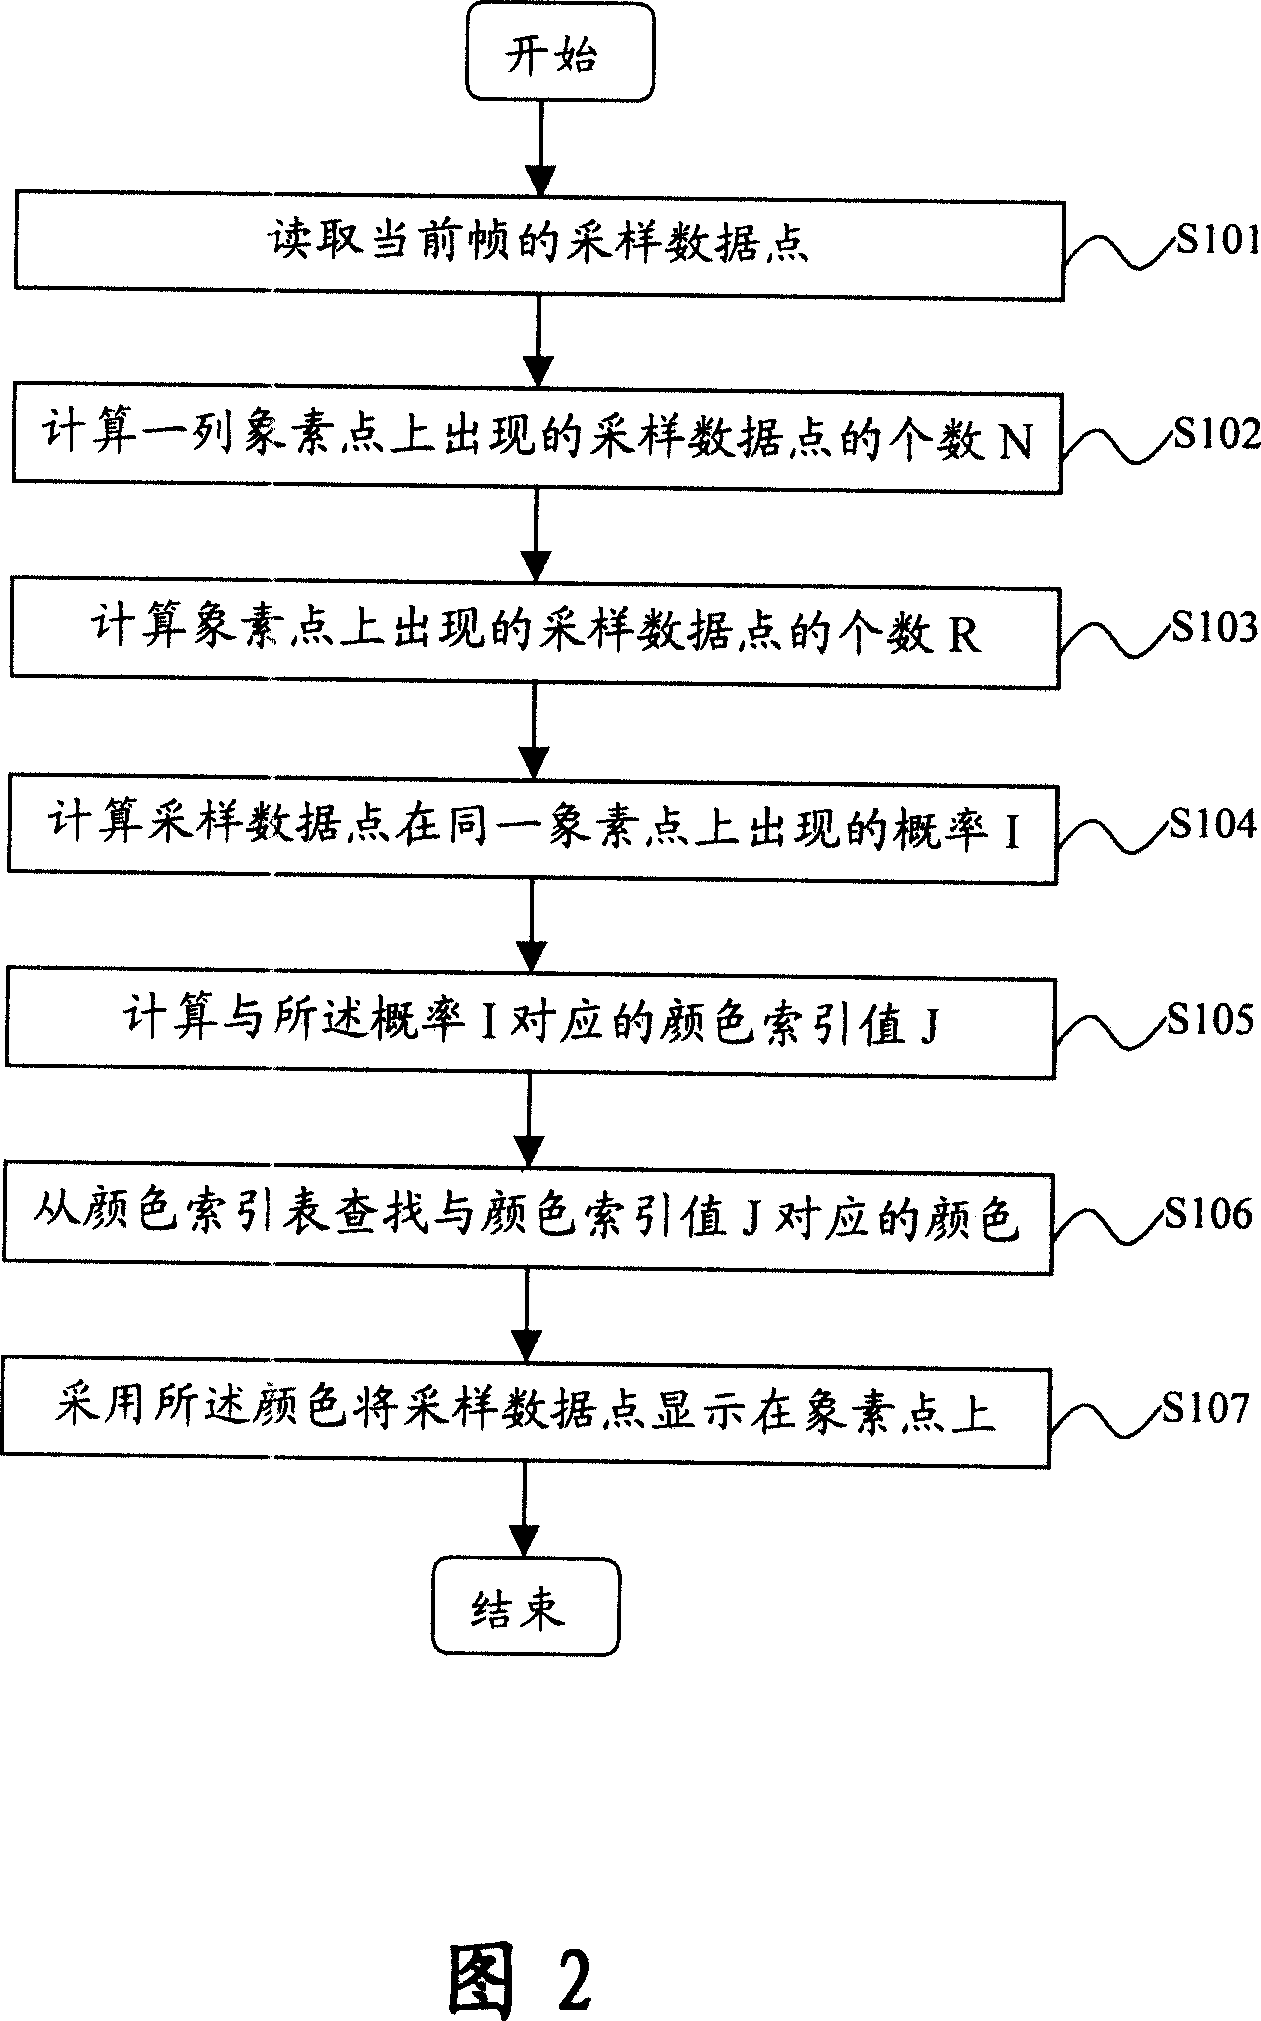
[0051] In this embodiment, only dot display is performed without vector display in the STOP state. FIG. 2 is a flowchart of a method for displaying dots in a STOP state of the present embodiment.
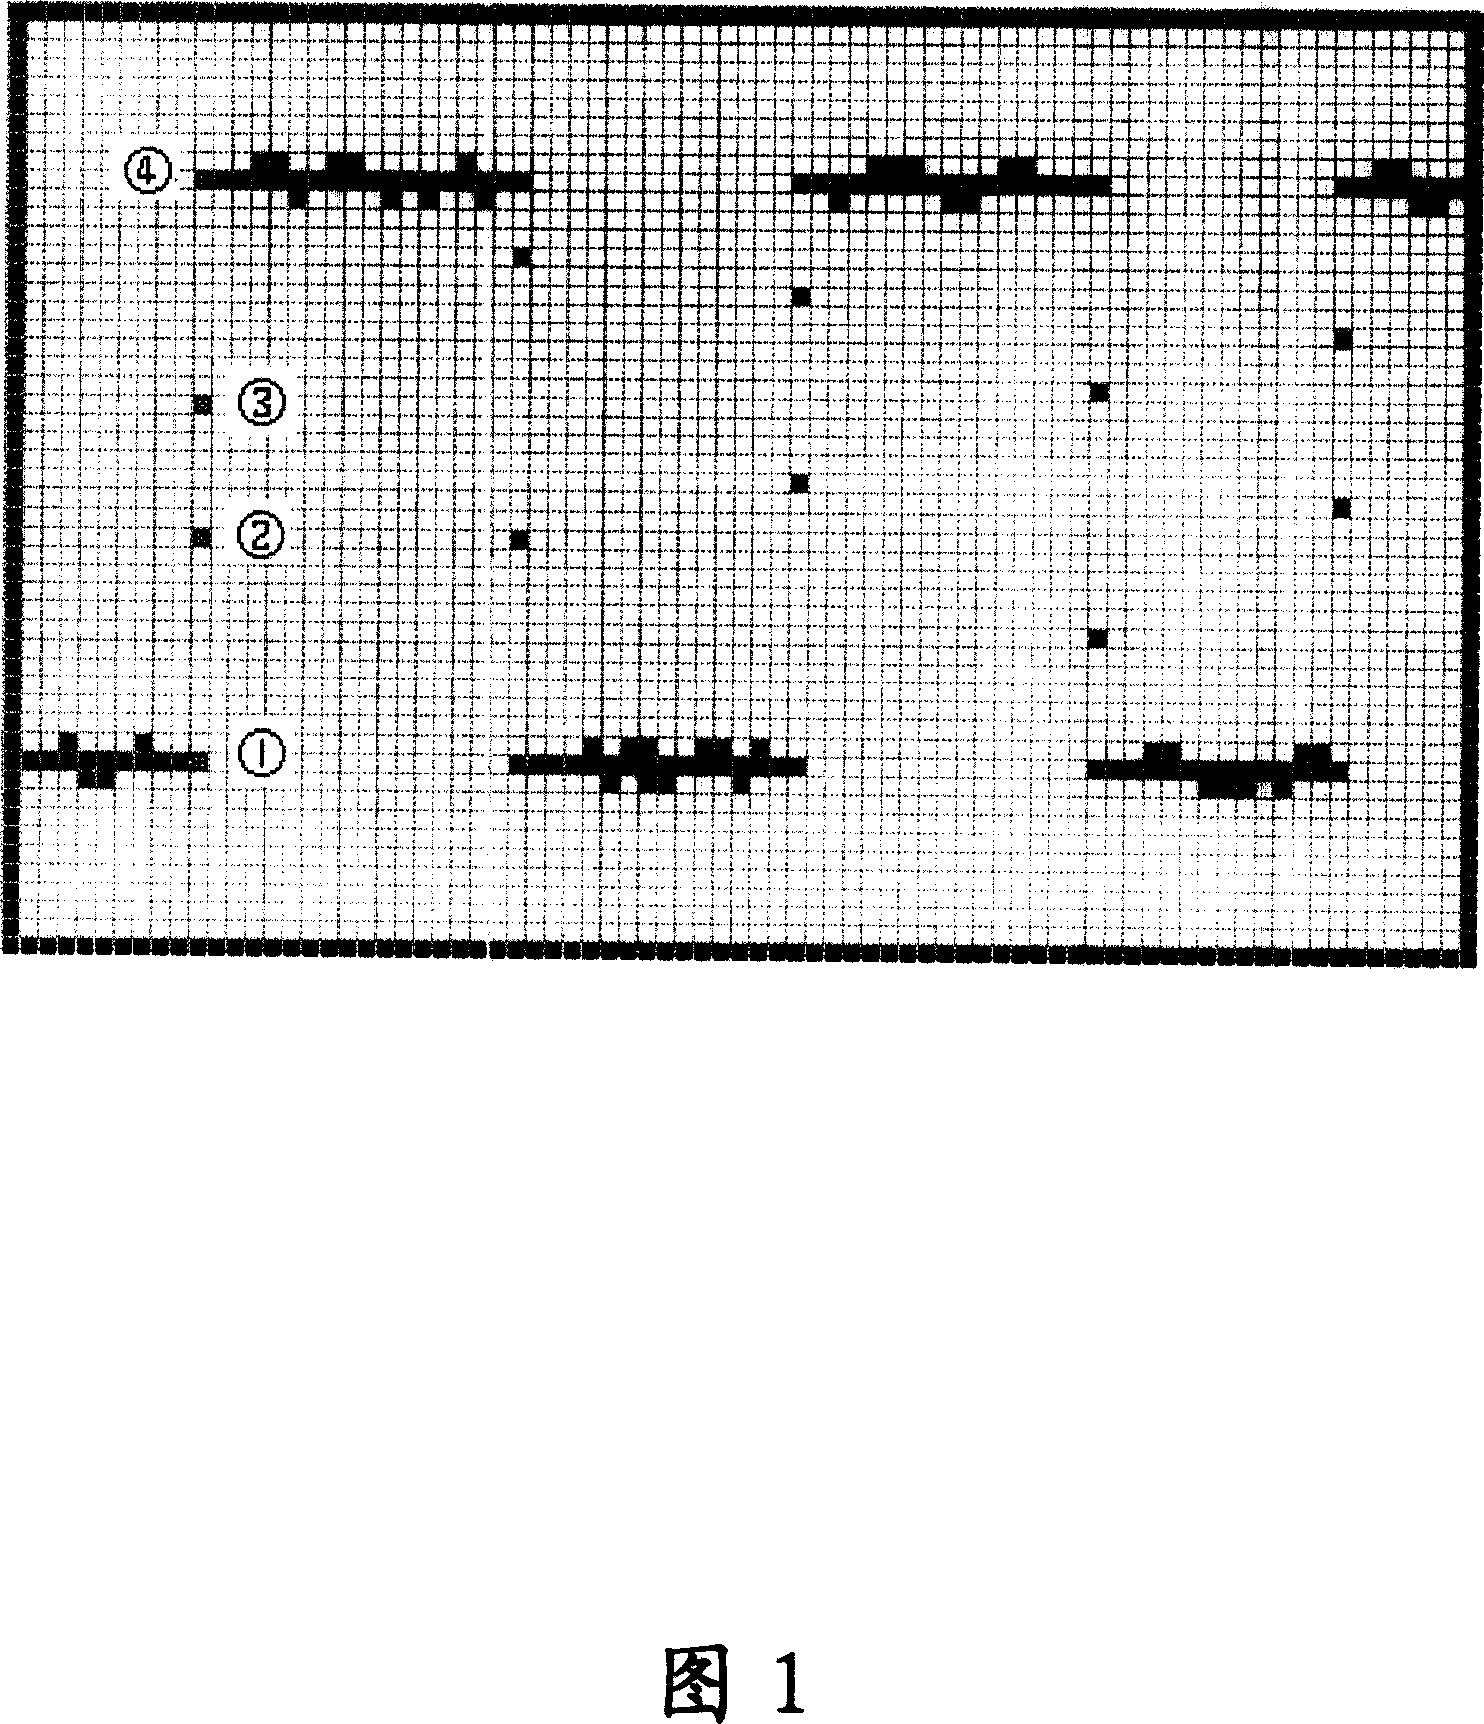
[0052] The following is a detailed description in conjunction with Figure 2. We take a column of pixels on the display screen as an example to illustrate. The display method of a digital oscilloscope can be divided into a reading process, a calculation process, a relationship building process and a display process.
[0053] The reading process refers to reading the sampling data points of the current frame (see step S101 ), where the reading of the sampling data points of the current frame may be reading from a memory.
[0054] The calculation process refers to calculating the probability that the sampled data points appear on the same pixel point. As shown in Figure 2, the calculation process specifically includes the following steps:
[0055] Step S102, calculate the number N of...
Embodiment 2
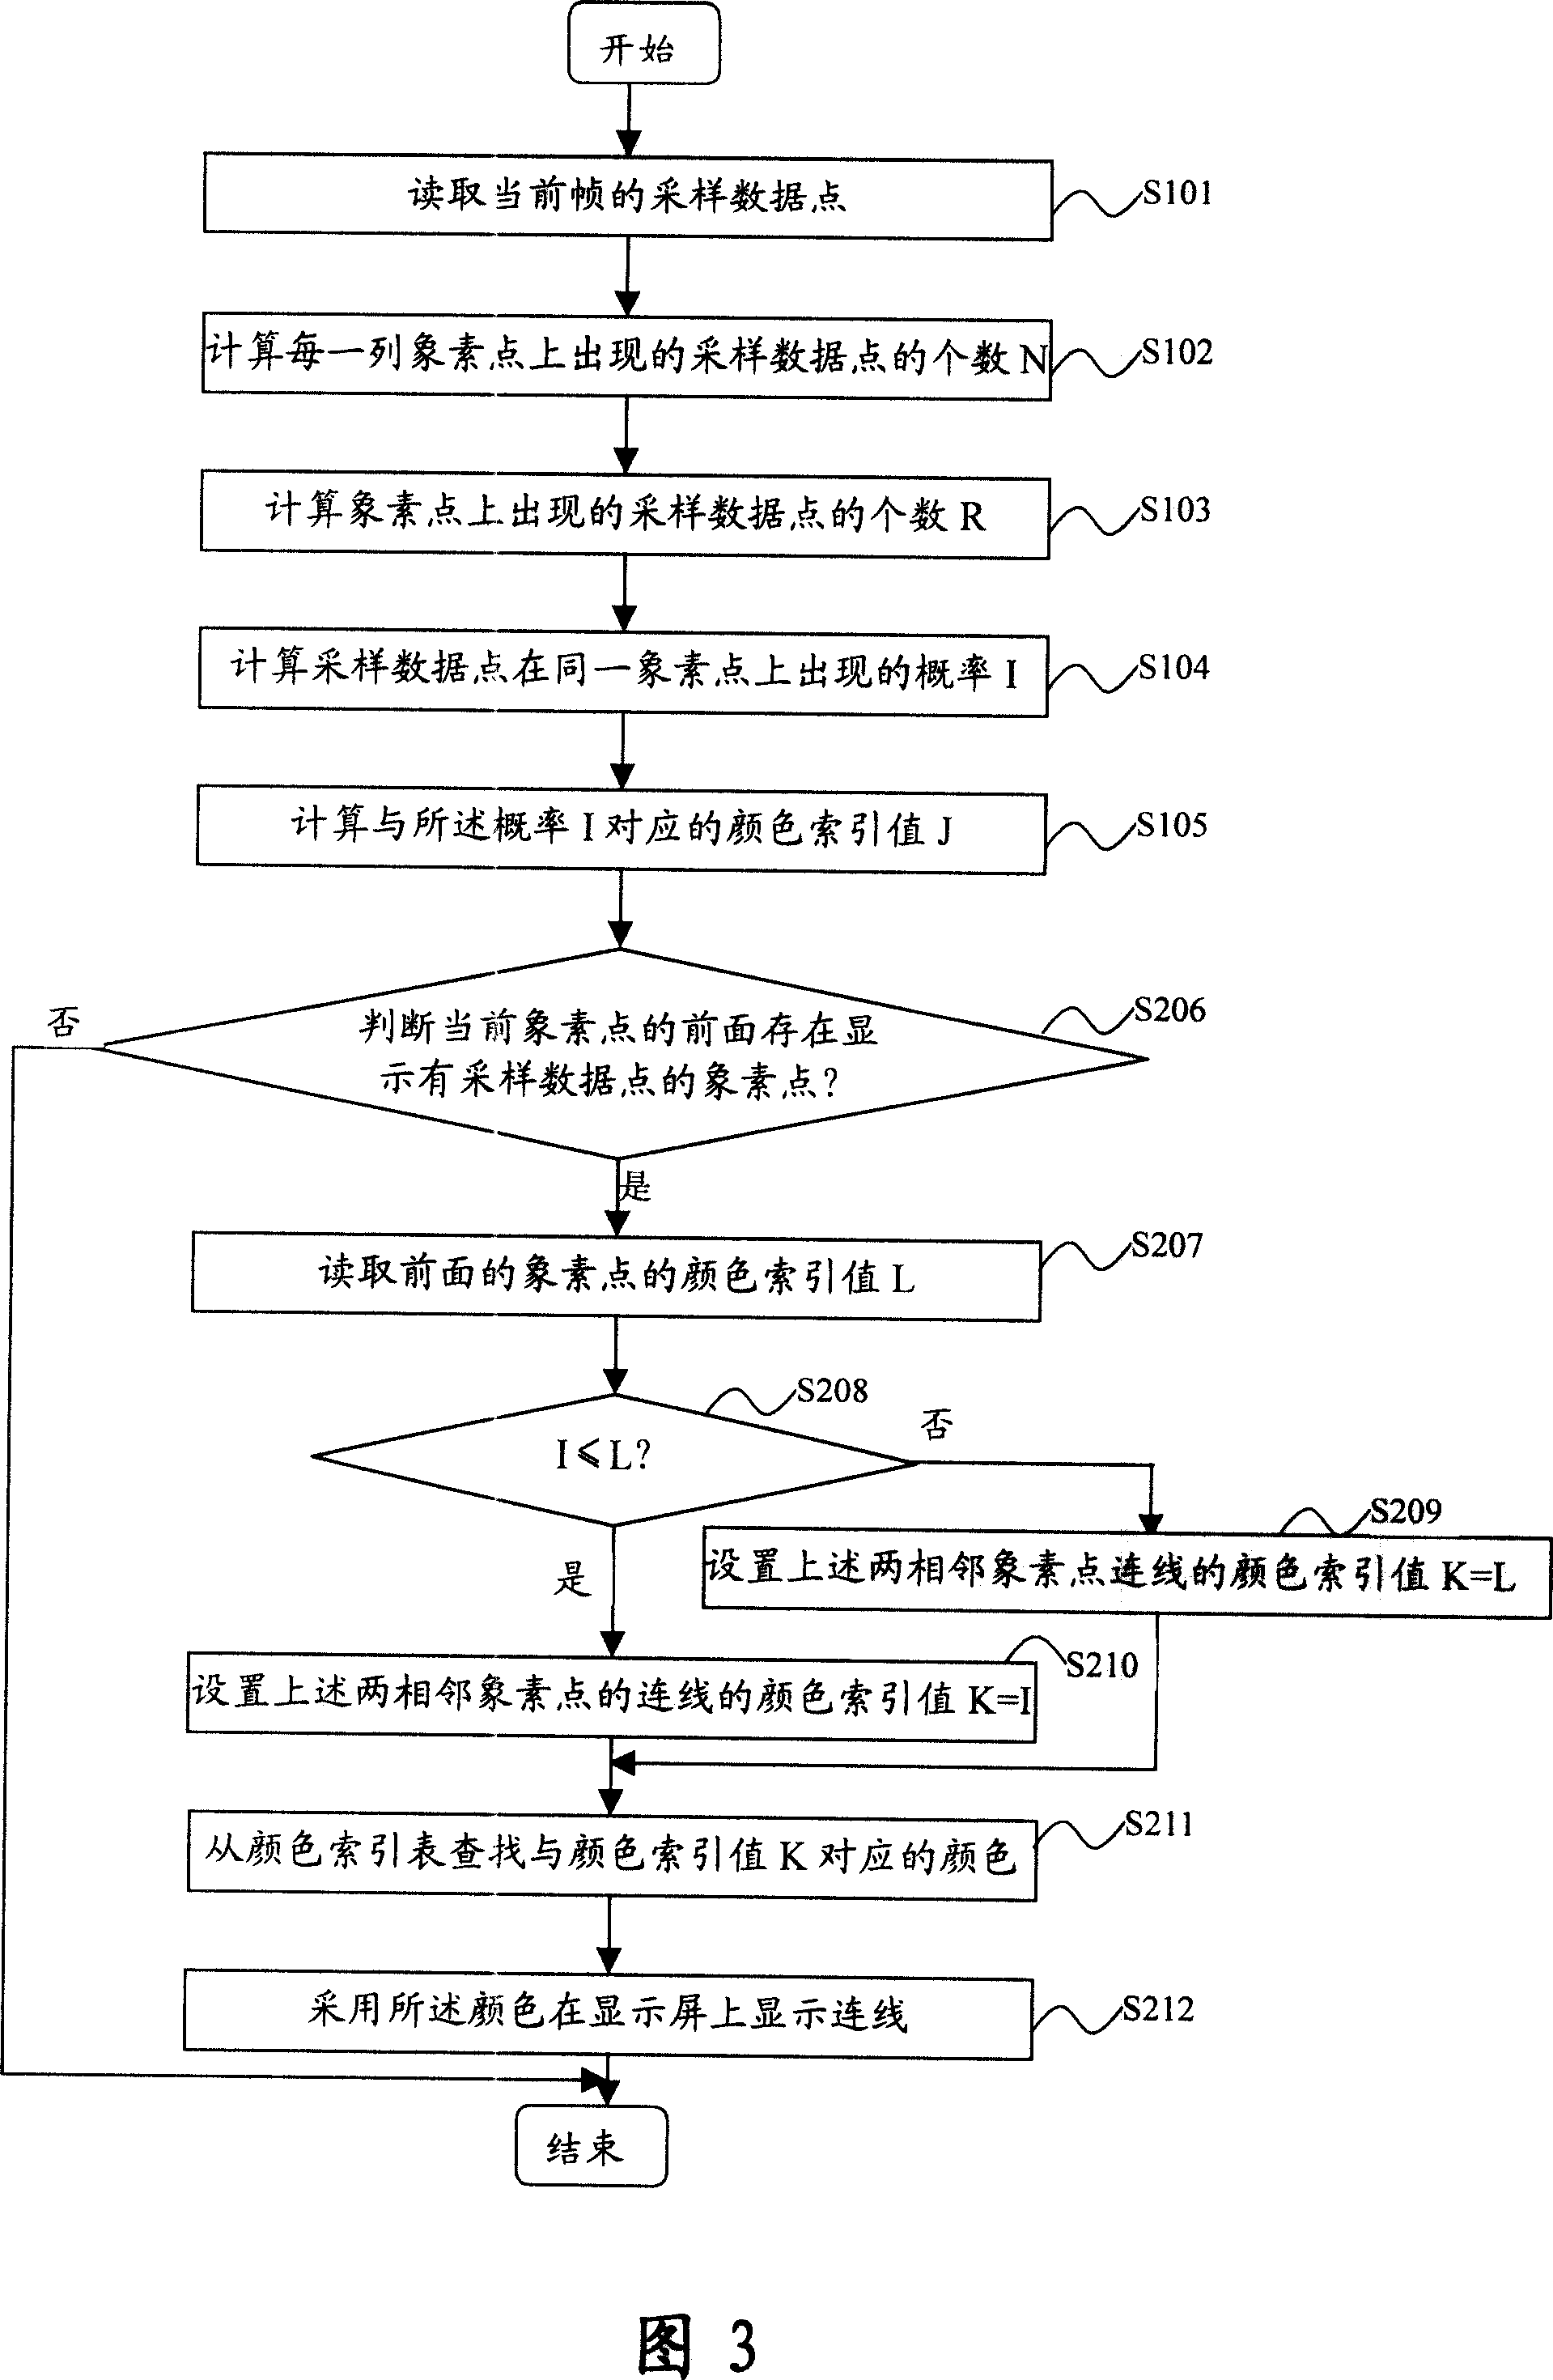
[0071] In the present embodiment, both the dot display and the vector display are to be performed in the STOP state. FIG. 3 is a flow chart of the method in the STOP state of the present embodiment.
[0072] A detailed description will be given below with reference to FIG. 3 . Steps S101 , S102 , S103 , S104 and S105 are shown in FIG. 3 , which have been described in detail in Embodiment 1, and will not be repeated here. Here, after the color index value of the pixel has been calculated, how to determine the color of the connecting line between two adjacent pixels displaying the sampled data points will be described in detail. The interpolation method for determining the shape of the connection line here may adopt the linear interpolation method, which is not repeated in the present invention, and the present invention focuses on determining the color of the inserted connection line.
[0073] First, compare the color index values of the two adjacent pixel points displaying ...
Embodiment 3
[0084] In this embodiment, only dot display is performed without vector display in the RUN state. FIG. 4 shows a flow chart of the method for point display in the RUN state of the present embodiment.
[0085] The basic principle of dot display in RUN state is the same as that of dot display in STOP state. The method of calculating the probability that the sampled data points of each frame appear on the same pixel point is also the same. The difference is that the dot display in RUN state The probability value is not only calculated based on the sampled data points of the current frame, but also the average probability value is calculated by considering the sampled data points of the previously displayed multiple frames. In this embodiment, it is assumed that the current frame and the previously displayed multiple frames have a total of n frames, n>1, and n is a positive integer.
[0086] As shown in the figure, the point display method in the RUN state can also be divided int...
PUM
 Abstract
Description
Claims
Application Information