
Data display system and display method

A data display and data technology, applied in electrical digital data processing, special data processing applications, instruments, etc., can solve problems such as poor user experience, inability to realize the corresponding relationship between graphics and charts, and inconvenience

Inactive Publication Date: 2011-09-21
刘宜云
View PDF0 Cites 0 Cited by
  • Summary
  • Abstract
  • Description
  • Claims
  • Application Information

AI Technical Summary

Problems solved by technology

However, this prior art has the following defects. It cannot realize the mutual correspondence between graphics and charts, that is, the two are completely independent, which will cause users to be unable to understand the graphics and charts well, thus resulting in poor user experience.
[0004] In summary, the existing data display technical solutions obviously have inconvenience and defects in actual use, so it is necessary to improve

Method used


Image

  • Data display system and display method
  • Data display system and display method
  • Data display system and display method

Examples


Embodiment Construction

[0050] In order to make the object, technical solution and advantages of the present invention clearer, the present invention will be further described in detail below in conjunction with the accompanying drawings and embodiments. It should be understood that the specific embodiments described here are only used to explain the present invention, not to limit the present invention.

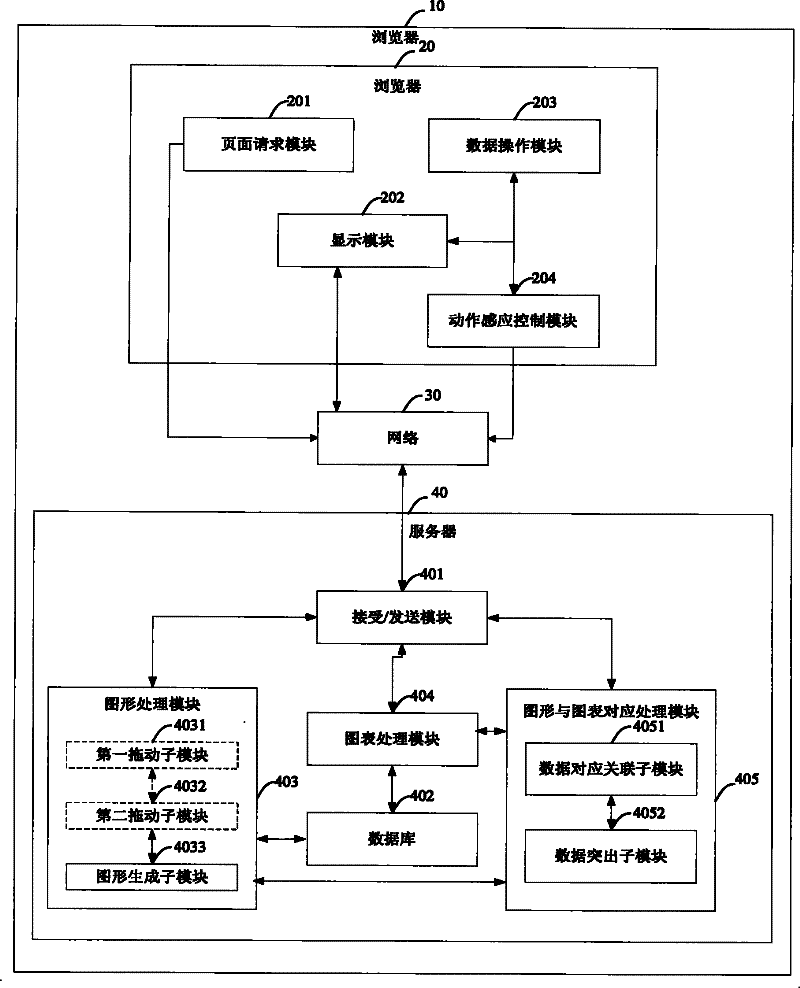
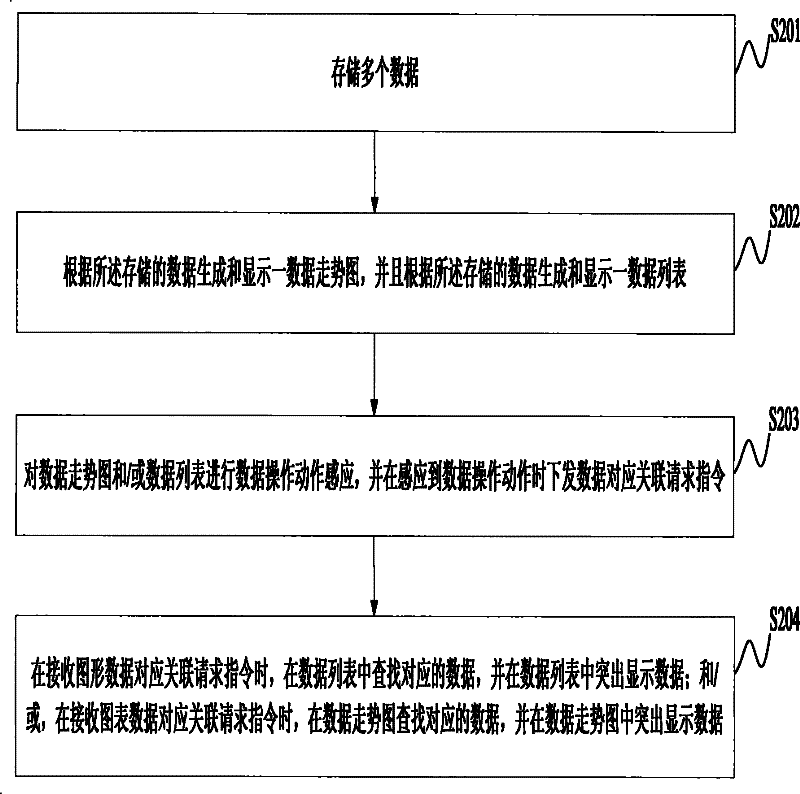
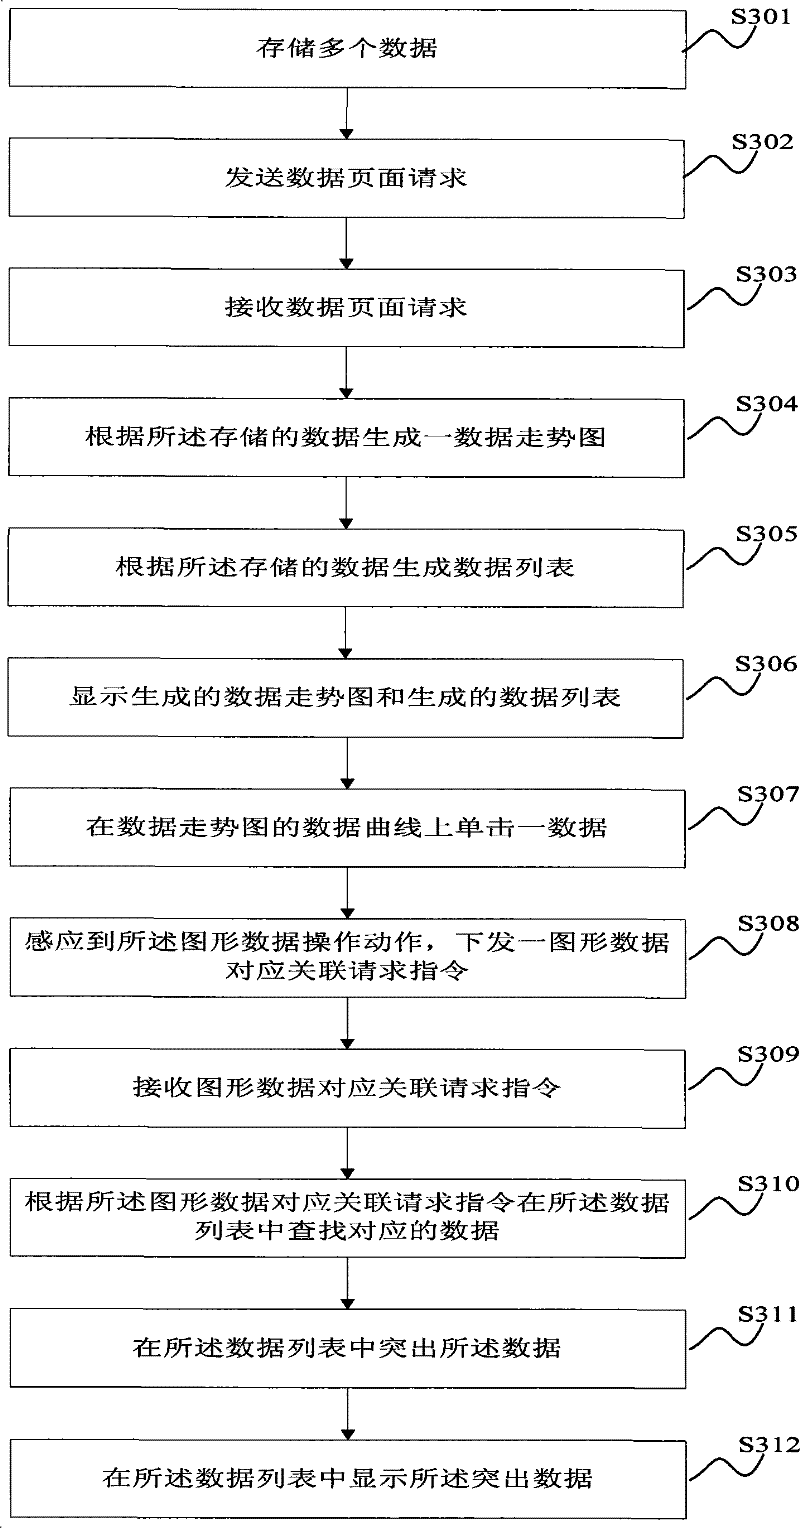
[0051] The basic idea of ​​the present invention is: generate and display a data trend chart according to the stored data, and generate and display a data list according to the stored data; then perform data operation action induction on the data trend chart and / or data list, and When the data operation action is sensed, a data corresponding association request instruction is issued, and the data corresponding association request instruction includes a graphic data corresponding association request instruction and / or a graph data corresponding association request instruction; finally, when receiving...


PUM


Abstract

The invention discloses a data display system and a method thereof. According to stored data, a data trend graph is generated and displayed, and according to the stored data, a data logger is generated and displayed; then according to the data tend graph and the data logger, the motion detection of data operation is carried out, and when the motion of the data operation is sensed, a data correspondence association request command is sent out; the data correspondence association request command comprises a graph data correspondence association request command and / or a figure correspondence association request command; finally, when the graph data correspondence association request command is received, the corresponding data is found in the data logger, and the data is prominently displayedin the data logger; and / or when the figure correspondence association request command is received, the corresponding data is found in the data trend graph, the data is prominently displayed in the data trend graph. In this way, the method of the invention realizes the visual display of the interrelation between a graph and a figure, thus greatly increasing the experience value of users.

Description

technical field [0001] The invention relates to the technical field of data communication and data display, in particular to a data display system and a data display method. Background technique [0002] Browser / server is one of the important frameworks for server management at present. This architecture brings great convenience to users, and its client only needs to use a browser to realize responsible management operations through the Internet or communication network. [0003] The current data display method is that when the browser requests a page from the server, the server generates static or dynamic graphics and charts according to the latest stored data and returns them to the browser as a response, which is interpreted by the browser and displayed to the user. However, this prior art has the following disadvantages. It cannot realize the mutual correspondence between graphics and charts, that is, the two are completely independent, which will cause users to be unab...

Claims


Application Information

Patent Timeline
Patent Type & Authority Patents(China)
IPC IPC(8): G06F17/30
Inventor 刘宜云
Owner 刘宜云
Learn More