Method and device for dynamically displaying statistical data

A statistical data and dynamic display technology, applied in the multimedia field, can solve the problem of single statistical data display, and achieve the effect of improving video experience and clear display effect.

Inactive Publication Date: 2015-04-01
TVM BEIJING TECH
View PDF3 Cites 37 Cited by
  • Summary
  • Abstract
  • Description
  • Claims
  • Application Information

AI Technical Summary

Problems solved by technology

[0005] The invention provides a method for dynamically displaying statistical data to overcome the problem of single display of statistical data

Method used


Image

  • Method and device for dynamically displaying statistical data
  • Method and device for dynamically displaying statistical data
  • Method and device for dynamically displaying statistical data

Examples


Embodiment Construction

[0024] The preferred embodiments of the present invention will be described below in conjunction with the accompanying drawings. It should be understood that the preferred embodiments described here are only used to illustrate and explain the present invention, and are not intended to limit the present invention.

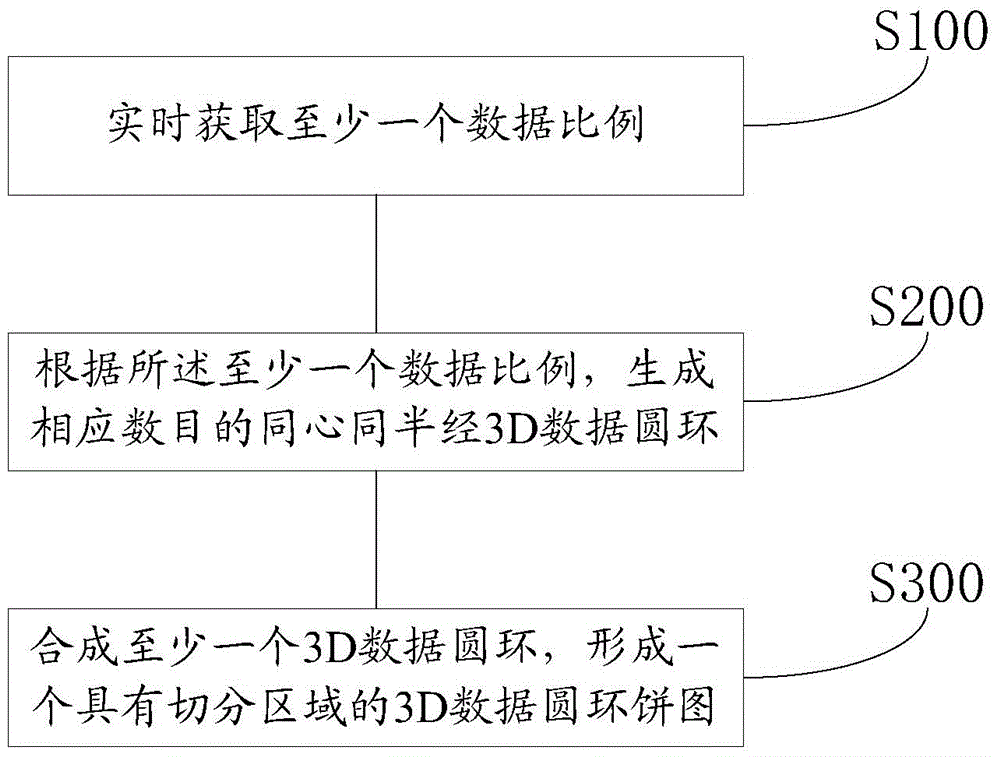
[0025] The present invention provides a method for displaying dynamic data changes, such as figure 1 , including the following steps:

[0026] S100 acquires at least one data ratio in real time;

[0027] Multiple data ratios are obtained in real time, and the data ratios are percentages in this example, and data can also be received in real time, and the percentages of the data in all quantitative values ​​are calculated to obtain data ratio values. In this example, take three data ratios of 60%, 30%, and 10%.

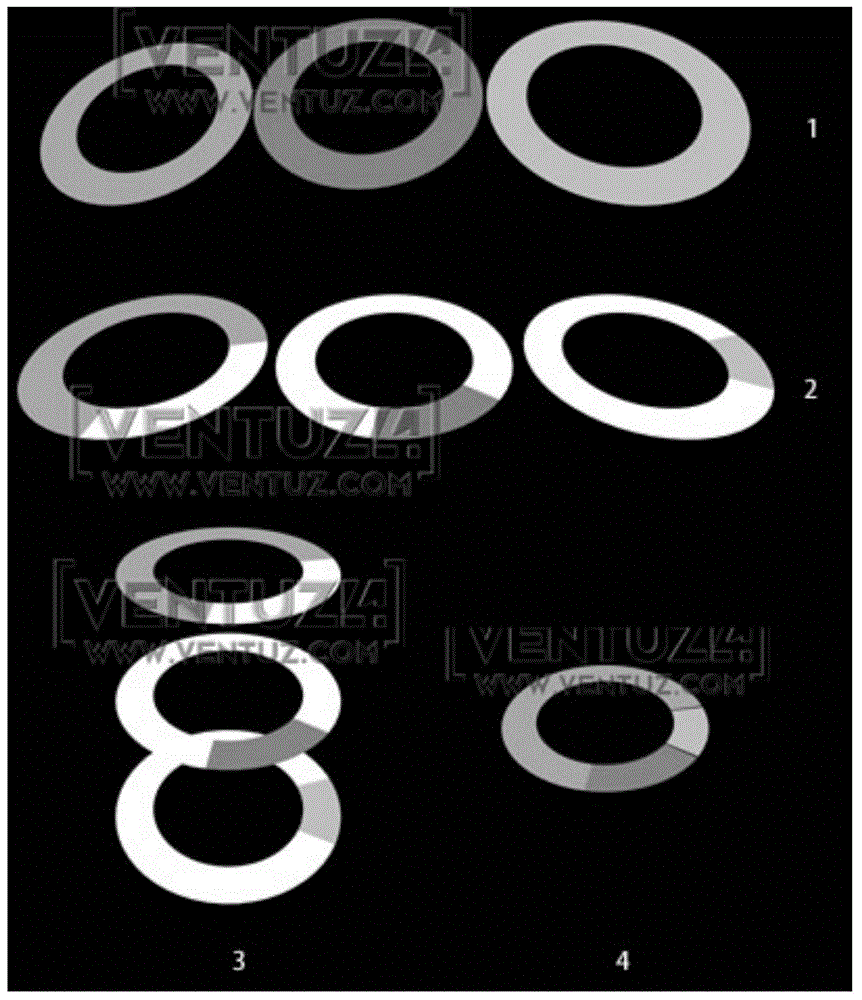
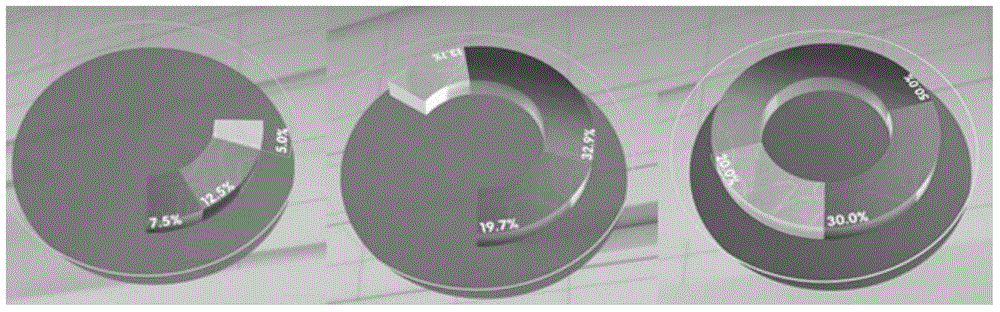
[0028] S200 Generate a corresponding number of concentric and semi-longitude 3D data rings according to the at least one data ratio;

[0029] see figur...


PUM


Abstract

The invention discloses a method for dynamically displaying statistical data, aiming at solving the problem that the display of the statistical data is single. The method comprises the following steps of obtaining at least one data ratio in real time; generating concentric and same-radius 3D data circular rings with the corresponding quantity according to at least one data ratio; synthesizing at least one 3D data circular ring to form a 3D data circular ring pie chart with segmentation regions. The invention further discloses a device for dynamically displaying the statistical data. According to the method and the device, the concentric and same-radius 3D data circular rings with the corresponding quantity are generated according to the obtained data ratio and one 3D data circular ring pie chart with the segmentation regions is synthesized; each data ratio is displayed on the circular ring pie chart and different colors are given to all data ratios, so that the display of the data ratios is layered and the display effect is clearer; the manner of displaying a data statistical result is enriched and the video experience is improved.

Description

technical field [0001] The invention relates to the field of multimedia technology, in particular to a method and device for dynamically displaying statistical data. Background technique [0002] With the development of computer technology, it is possible to control the transmission, analysis and display of multimedia (audio, video, picture) content, thereby changing the generation, transmission and display methods of traditional multimedia, for example, the information of various contents can be reorganized , so that the display of multimedia (audio, video, picture) content is richer. [0003] Traditional statistical data usually adopts a single display mode, and the statistical data is displayed in the form of character data, and the effect of data changes cannot be clearly and intuitively displayed in a pile of data. [0004] In light of this, overcoming the single problem of statistical variation results revealing a pressing problem. Contents of the invention [0005...

Claims


Application Information

Patent Timeline
Patent Type & Authority Applications(China)
IPC IPC(8): G06F17/30
CPCG06T13/20G06T19/20
Inventor 呼伦夫
Owner TVM BEIJING TECH
Why Eureka
Try Eureka