Regional agricultural key farming season online visualization prediction method

A regional and key technology, applied in the field of online visual forecasting of key agricultural seasons in regional agriculture, can solve problems such as incomplete coverage, insufficient regional differences, and unintuitive performance, and achieve the goals of reducing workload, simplifying operation procedures, and improving service capabilities Effect

Inactive Publication Date: 2015-08-19
XIAN UNIV OF TECH
View PDF5 Cites 6 Cited by
  • Summary
  • Abstract
  • Description
  • Claims
  • Application Information

AI Technical Summary

Problems solved by technology

[0004] The purpose of the present invention is to provide a method for online visual forecasting of key agricultural seasons in regional agriculture, which solves the problem that in the prior ar...

Method used


Image

  • Regional agricultural key farming season online visualization prediction method
  • Regional agricultural key farming season online visualization prediction method
  • Regional agricultural key farming season online visualization prediction method

Examples


Embodiment Construction

[0018] The present invention will be described in detail below in conjunction with the accompanying drawings and specific embodiments.

[0019] The method for on-line visual forecasting of key farming seasons in regional agriculture of the present invention comprises the following steps:

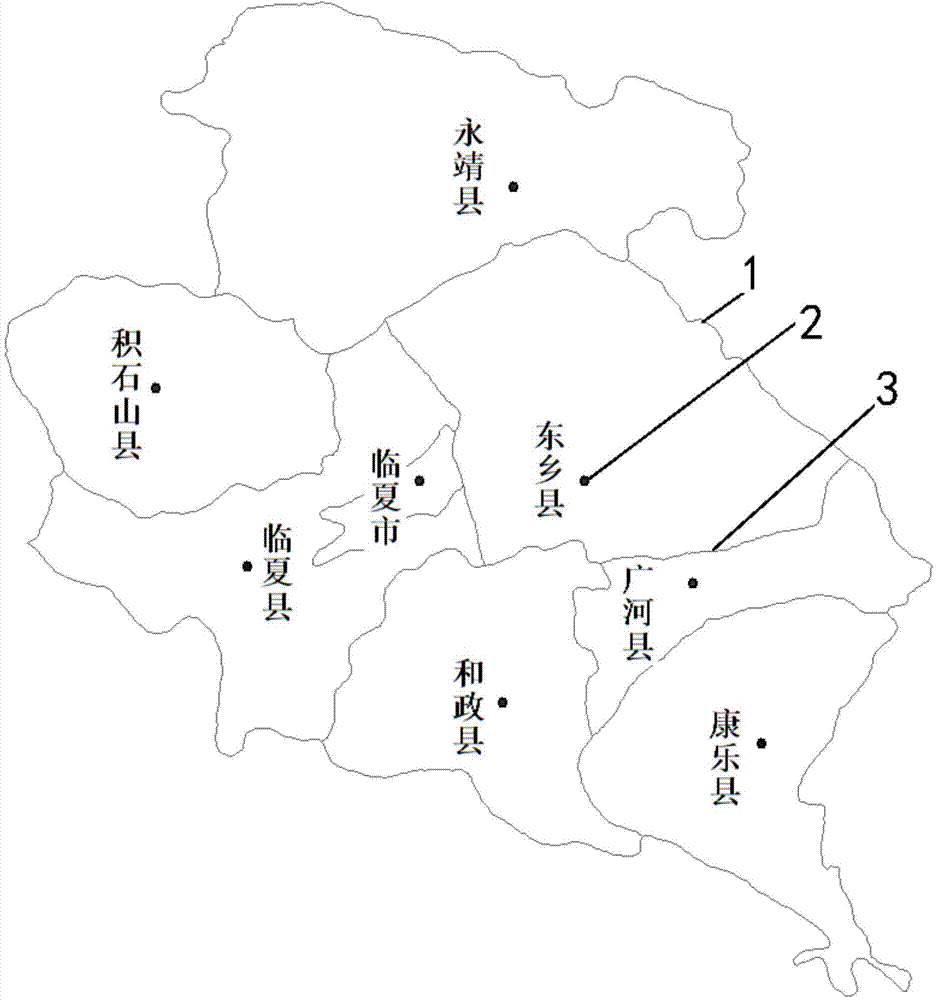
[0020] Step 1. Use Arcmap to make the base map of the regional agricultural map and publish it;

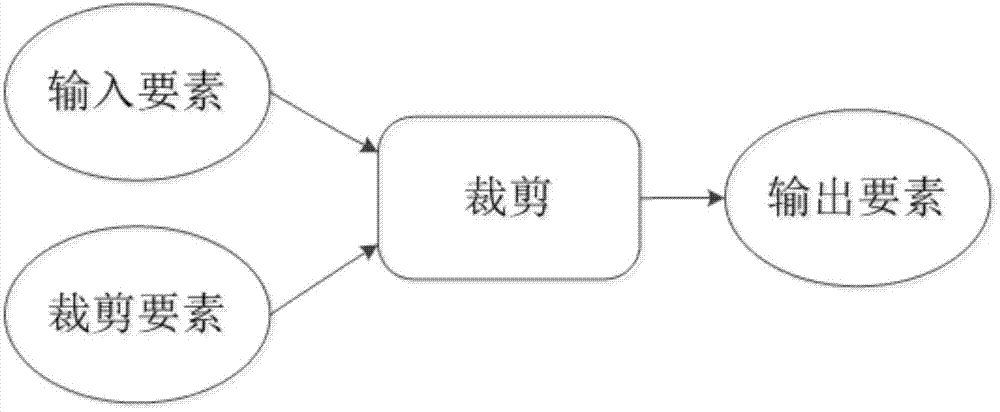
[0021] Step 2. Establish a geographic information processing model for key agricultural seasons and publish geoprocessing services;

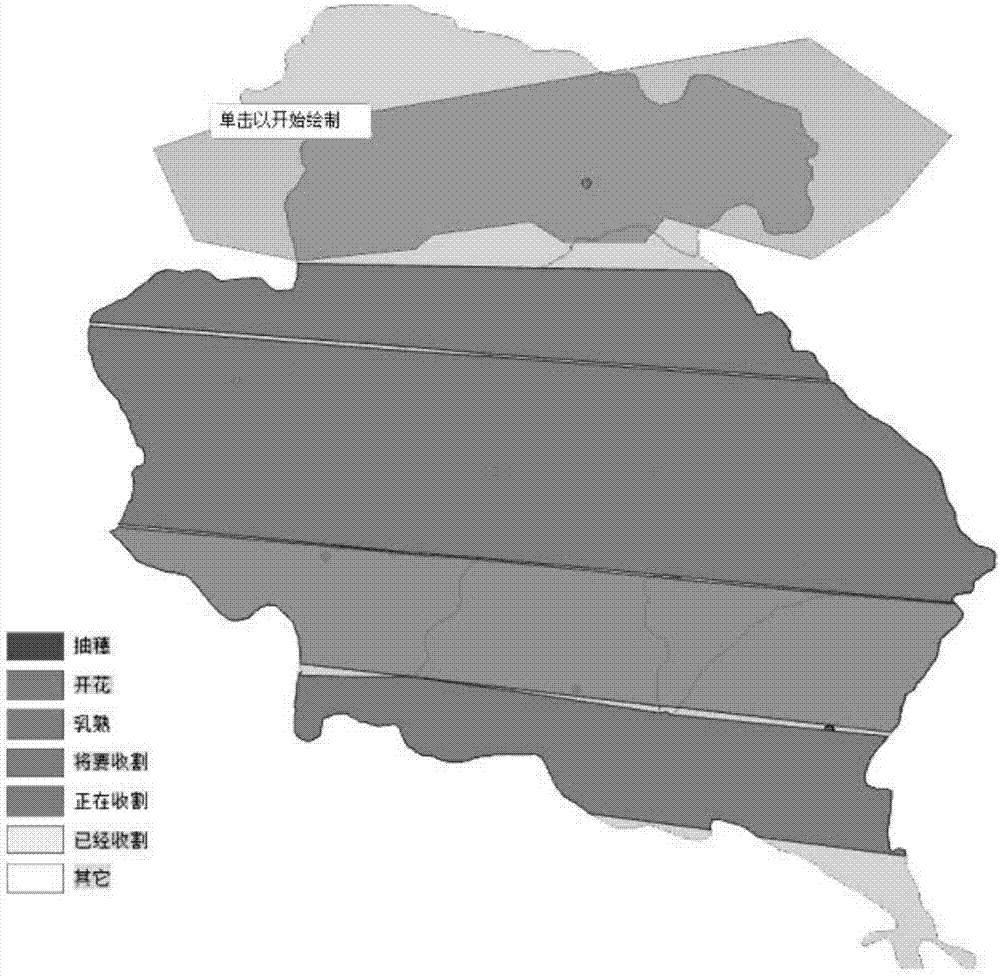
[0022] Step 3, drawing of key agricultural season areas;

[0023] Step 4, carry out distance and area calculation;

[0024] Step 5, adjusting the boundary of the key agricultural season drawing area;

[0025] Step 6. Determine and output the final result map of key agricultural season visualization.

[0026] The specific steps of the method of the present invention will be described in detail below by taking the weather service of summer harvest and summer pla...


PUM


Abstract

The invention discloses a regional agricultural key farming season online visualization prediction method. The method comprises the following steps that: step 1, a regional agricultural map base is produced through utilizing ArcMap and is issued; step 2, a geographic information processing model of key farming seasons is established, and geoprocessing services are issued; step 3, key farming season regions are drawn; step 4, distance and area measurement and calculation are performed; step 5, the boundaries of the drawn key farming season regions are adjusted; and step 6, a final key farming season visualization result map is determined and outputted. With the method of the invention adopted, the change of farming seasons with time and space can be intuitively demonstrated in a diagram and map-combined manner; and agricultural planting can be arranged more efficiently and reasonably by means of advanced network technologies and geoprocessing technologies. The regional agricultural key farming season online visualization prediction method has the advantages of high efficiency, convenience and visualization.

Description

technical field [0001] The invention belongs to the technical field of regional agricultural production management and meteorological disaster prediction and early warning, and relates to a method for online visual forecasting of key agricultural seasons in regional agriculture. Background technique [0002] In recent years, agricultural meteorological disasters have occurred with high frequency, variety and wide range. Meteorological disasters directly affect agricultural production, and most of them occur during key agricultural seasons. In view of the regional distribution and occurrence characteristics of meteorological disasters, it is particularly critical to guide agricultural production to proceed in an orderly manner, and to successfully complete spring plowing and spring sowing, summer harvesting and summer planting, and autumn harvesting and autumn sowing before the disaster weather comes. [0003] At present, most meteorological services for key agricultural seas...

Claims


Application Information

Patent Timeline
IPC IPC(8): G06Q10/04G06Q50/02
Inventor 缪亚林孟金涛强欣冀鑫张洁肖倩
Owner XIAN UNIV OF TECH
Why Eureka
Try Eureka