Cloud map display method for environment monitoring information

An environmental monitoring and cloud map technology, applied in non-electric variable control, control/regulation systems, and simultaneous control of multiple variables, etc., can solve the problems of data statistics retention, unintuitive information, and difficult and efficient warnings, and save energy. Expenses, improving economic efficiency, and the effect of convenient data statistics

Inactive Publication Date: 2016-09-21
北京航天联智科技有限公司
View PDF6 Cites 18 Cited by
  • Summary
  • Abstract
  • Description
  • Claims
  • Application Information

AI Technical Summary

Problems solved by technology

Employees who are inexperienced in the computer room may need other auxiliary means to correspond to the location on the collection list, which takes a lot of time and energy
At the same time, it is not easy to find problems at the discrete points themselves. For example, if the points with too high temperature are concentrated in one area, it is often the fault of the refrigeration system in this area.
[0004] (2) The data displayed in the form of lists and reports is difficult to have continuity in time. In order to observe the temperature changes over a period of time, users often need to consult many reports, plus a lot of manual analysis and statistical work
[0005] (3) It is difficult to analyze the correlation and trend of different time and different types of data in the form of a list
[0006] (4) Traditional data statistics are still at the level of TOPN and average calculation, and cannot display temperature information from multiple angles
[0007] (5) At present, the monitoring and alarming of temperature and humidity is not comprehensive. The alarms generated through monitoring are all single-point alarms. It is difficult to effectively warn the situation of excessive temperature in the area caused by problems such as air-conditioning failures.
[0009] (7) The temperature and humidity information collected by temperature and humidity monitoring information is the information of discrete points in space. This kind of information is not intuitive and cannot directly display the temperature and humidity in the computer room.

Method used


Image

  • Cloud map display method for environment monitoring information
  • Cloud map display method for environment monitoring information
  • Cloud map display method for environment monitoring information

Examples


Embodiment Construction

[0031] Embodiments of the present invention are described in detail below, and examples of the embodiments are shown in the drawings, wherein the same or similar reference numerals denote the same or similar elements or elements having the same or similar functions throughout. The embodiments described below by referring to the figures are exemplary and are intended to explain the present invention and should not be construed as limiting the present invention.

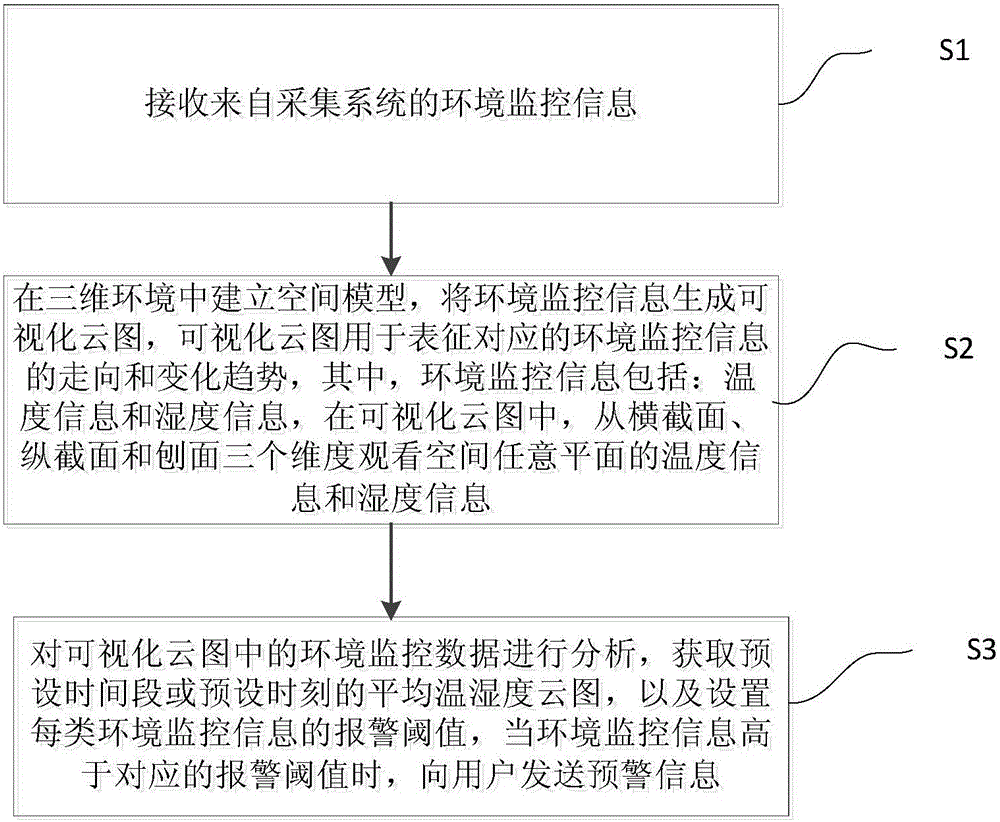
[0032] Such as figure 1 As shown, the cloud image presentation method of environmental monitoring information in the embodiment of the present invention includes the following steps:

[0033] Step S1, receiving environmental monitoring information from the collection system.

[0034] In summary of an embodiment of the present invention, environmental monitoring information is collected by connecting with the collection system to read monitoring information in real time and reading environmental file / database informati...


PUM


Abstract

The invention puts forward a cloud map display method for environment monitoring information, comprising the following steps: receiving environment monitoring information from a collection system; building a space model in a three-dimensional environment, and generating a visual cloud map based on the environment monitoring information, wherein the visual cloud map is used to represent the trend and change of the corresponding environment monitoring information, and the temperature and humidity information of any plane of a space can be viewed in the visual cloud map from three dimensions, namely, the transverse cross section, the longitudinal cross section and the profile; analyzing the environment monitoring data in the visual cloud map, and getting the average temperature and humidity cloud map in a preset period of time or at a preset time; and setting an alarm threshold for each type of environment monitoring information, and sending warning information to users when the environment monitoring information is higher than the corresponding alarm threshold. According to the invention, discretely distributed temperature monitoring points are changed into a continuously-distributed temperature field through an interpolation algorithm, the temperature and humidity trend and the heat island effect are reflected intuitively by means of three-dimensional display, and operation and maintenance staff can be helped to carry out positioning.

Description

technical field [0001] The invention relates to the technical field of monitoring visualization, in particular to a method for displaying cloud images of environmental monitoring information. Background technique [0002] The traditional way of displaying temperature and humidity cloud charts is through lists and reports. The advantage of the display method of the list is that the data of the point can be accurately displayed, but the display method of the list has the following problems: [0003] (1) The list is a collection of discrete collection points, and the quick correspondence between the name of the collection point and the real location relationship in the real computer room is often based on the accumulation of long-term work in the computer room. Employees who are inexperienced in the computer room may need other auxiliary means to correspond to the location on the collection list, which takes a lot of time and energy. At the same time, it is not easy to find p...

Claims


Application Information

Patent Timeline
Patent Type & Authority Applications(China)
IPC IPC(8): G05D27/02
CPCG05D27/02
Inventor 高鹏林洪宇
Owner 北京航天联智科技有限公司
Why Eureka
Try Eureka