Visual display method for stock trend prediction result

A technology for predicting results and trends. It is applied in forecasting, instrumentation, finance, etc., and can solve the problems of less research on visual display technology and methods.

Pending Publication Date: 2017-05-31
洪志令
View PDF6 Cites 5 Cited by
  • Summary
  • Abstract
  • Description
  • Claims
  • Application Information

AI Technical Summary

Problems solved by technology

[0003] The forecasting of stock prices has always attracted the attention of researchers, but th...

Method used


Image

  • Visual display method for stock trend prediction result
  • Visual display method for stock trend prediction result
  • Visual display method for stock trend prediction result

Examples


Embodiment Construction

[0025] The present invention will be described in detail below in conjunction with the accompanying drawings and examples.

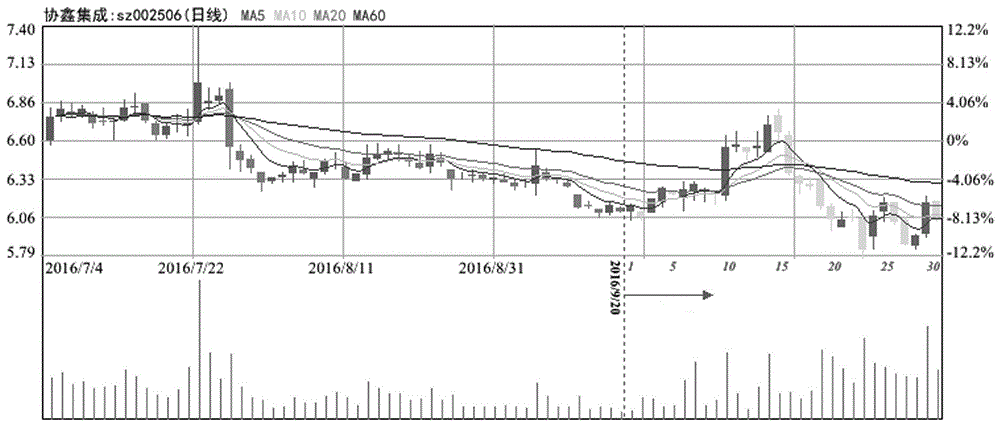
[0026] Short-term forecasts generally refer to forecasts for the next 2 weeks or more trading days of stocks, such as 20-day forecasts, 30-day forecasts, and 60-day forecasts.

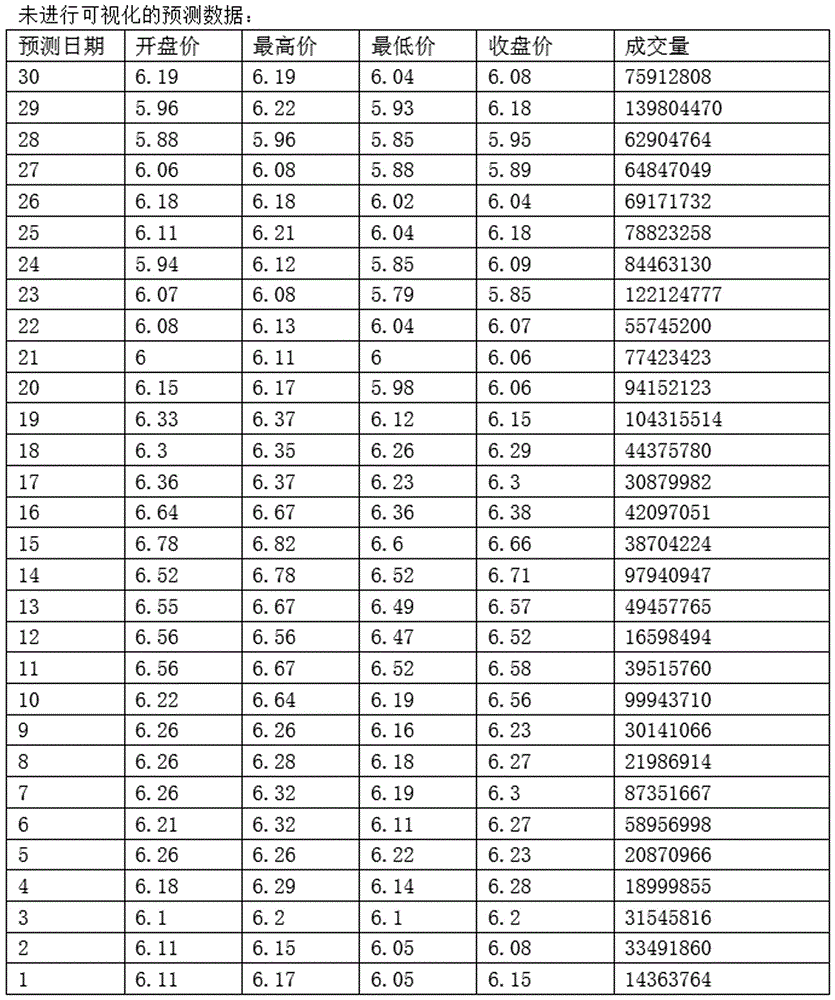
[0027] The method of the invention visually displays the short-term forecast data. The short-term forecast data is required to include the opening price, highest price, lowest price, closing price, and transaction volume information of each forecast day.

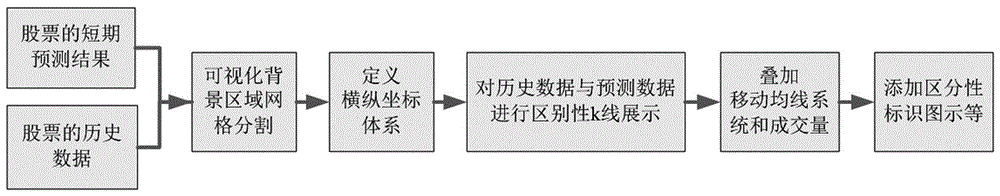
[0028] The specific process of visual display of short-term forecast data is as follows.

[0029] 1. Obtain historical data and forecast data.

[0030] Obtaining data includes opening, highest, lowest, closing, and trading volume information. The data source is divided into two parts, one part comes from the basic historical market data of the stock, and the other part is the short-term forecast data of the stock. Generally...


PUM


Abstract

The invention discloses a visual display method for a stock trend prediction result. The visual process of the method is based on a short-term stock prediction result; and short-term prediction indicates prediction of trading days of more than two weeks of stocks, for example, twenty-day prediction, thirty-day prediction, or sixty-day prediction. The prediction data content includes information of an opening price, a highest price, a lowest price, a closing price, and a trading volume and the like of each prediction day. According to the method, with a graphical way, various elements or data are transformed into graphs and are drawn at a chart, so that future trend prediction information of the stock can be expressed clearly and effectively. The method disclosed by the invention can be used for visual displaying of a short-term prediction result of a common stock, so that convenience is provided for the user and a decision-making support is provided for the stock operation by the user.

Description

technical field [0001] The invention relates to the technical field of stock data mining visualization, in particular to a method for visually displaying stock trend prediction results. Background technique [0002] The stock market has been the research object of many scholars and investors since its establishment, and the prediction of stock price trend is a subject of general concern in investment and securities theory circles. Due to the influence of various factors such as the political and economic environment at home and abroad and the company itself, the stock price is always in constant fluctuation, and the influence of various factors is extremely complicated, so the rise and fall of the stock price is disorderly and has great influence random walk. [0003] The stock price prediction has always been the researcher's attention, but there is relatively little research on the visual display technology of the stock prediction results. The basic idea of ​​data visual...

Claims


Application Information

Patent Timeline
IPC IPC(8): G06Q10/04G06Q40/04
CPCG06Q10/04G06Q40/04
Inventor 吴梅红洪志令
Owner 洪志令
Why Eureka
Try Eureka