
Self-adaptive similarities and differences moving average line stock trend prediction method

A technology of moving average and trend prediction, applied in the field of stock analysis, it can solve the problems of affecting accuracy, but the fluctuation is very violent, and the applicability is not strong, so as to achieve the effect of enhancing adaptability and strong applicability.

Pending Publication Date: 2020-06-19
SHANDONG INST OF BUSINESS & TECH
View PDF0 Cites 0 Cited by
  • Summary
  • Abstract
  • Description
  • Claims
  • Application Information

AI Technical Summary

Problems solved by technology

[0004] (1) The applicability to different types of stocks is not high
Figure 1 is the waveform diagram of the closing prices of two different stocks. The shapes and trends of the two waveform diagrams in Figure 1(a) and Figure 1(b) are completely different. If the MACD indicator with fixed parameters is used for prediction, it is bound to be different from the actual result. will produce a large error
[0005] (2) The applicability to different periods of the same class of stocks is not strong
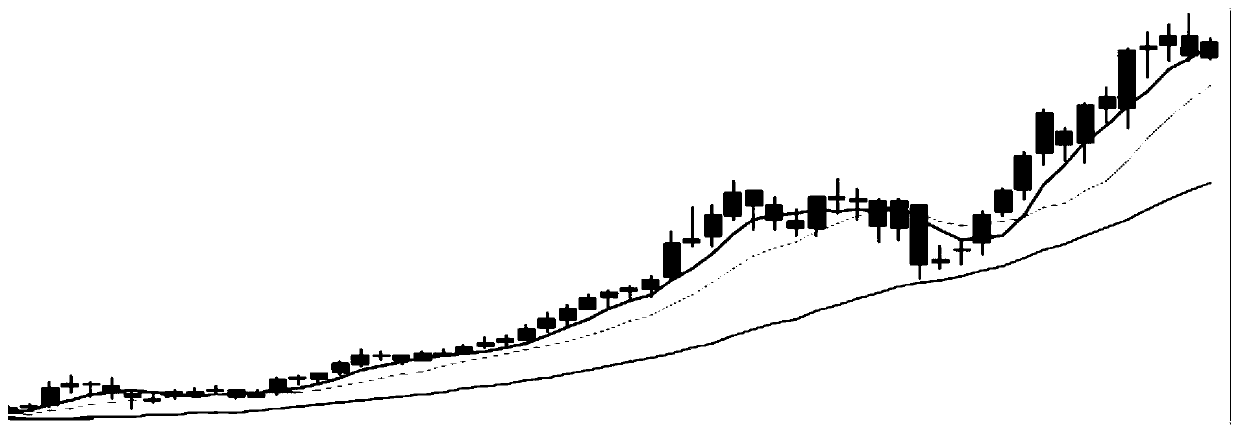
figure 2 It is a waveform chart of the closing price of the same stock in different time periods. It can be seen from the figure that the stock price changes in the first period of the stock are relatively flat, but the fluctuations in the second half period are very violent, so it is inevitable to use the MACD indicator with fixed parameters to predict the development trend of the stock. Affects accuracy

Method used


Image

  • Self-adaptive similarities and differences moving average line stock trend prediction method
  • Self-adaptive similarities and differences moving average line stock trend prediction method
  • Self-adaptive similarities and differences moving average line stock trend prediction method

Examples


Embodiment Construction

[0056] Attached below image 3-4. A specific embodiment of the present invention is described in detail, but it should be understood that the protection scope of the present invention is not limited by the specific embodiment.

[0057] Such as image 3 As shown, the present invention provides a kind of self-adaptive similarity-difference moving average stock trend prediction method, comprising the following specific steps:

[0058] (1) Data division: preprocess the large amount of stock data extracted, based on the daily closing price, n days as a group, segment the data, and then use MATLAB to draw the segmented data into a wave form.

[0059] (2) Construct clustering criteria: cluster the waveform graphs according to the similarity measure. Each waveform has its own unique features, therefore, features can be extracted for each waveform, such as: mean, variance, standard deviation, coefficient of variation, center distance, etc. Since each waveform is a curve, it has the...


PUM


Abstract

The invention relates to the technical field of stock analysis, and discloses a self-adaptive similarities and differences moving average line stock trend prediction method, which comprises the following steps of S1, data division; s2, constructing a clustering standard; s3, clustering is carried out; s4, determining different parameters; training and learning the clustered oscillogram classification through a neural network, and determining different parameters for each category; s5, constructing a self-adaptive similarities and differences moving average line; establishing an MACD model foreach type of data, and combining all the MACD models to construct a final adaptive similarities and differences moving average line; and S6, stock prediction is carried out by using the adaptive similarities and differences moving average line, and according to the adaptive similarities and differences moving average line stock trend prediction method, different parameters are determined for different types of stocks, so that the constructed dynamic MACD index has relatively high applicability, and the prediction accuracy is improved.

Description

technical field [0001] The invention relates to the technical field of stock analysis, in particular to an adaptive similarity-difference sliding average stock trend prediction method. Background technique [0002] Moving Average Convergence and Divergence (MACD, Moving Average Convergence and Divergence) is a technical analysis tool for judging buying and selling opportunities and tracking futures and stock market price trends. It is of great significance to stock price trend forecasting. How to enhance the adaptability of MACD and the accuracy of stock forecasting is the key to stock technical analysis. Among them, the effectiveness of stock data clustering and the accuracy of each type of data parameters are the key technical links in the construction of adaptive MACD, which still need to be further improved. [0003] The construction of existing MACD indicators mainly has the following shortcomings in terms of technology: [0004] (1) The applicability to different typ...

Claims


Application Information

Patent Timeline
IPC IPC(8): G06Q10/04G06Q40/04G06K9/62
CPCG06Q10/04G06Q40/04G06F18/23213
Inventor 赵峰高雅婷吕庆聪刘培强冯烟利
Owner SHANDONG INST OF BUSINESS & TECH
Learn More