Employee medical benefit fund expenditure balancing algorithm and model
A technology for medical insurance and employees, applied in the field of data processing, can solve problems such as the inability to calculate the future trend of medical insurance funds
- Summary
- Abstract
- Description
- Claims
- Application Information
AI Technical Summary
Problems solved by technology
Method used
Image
Examples
Embodiment 1
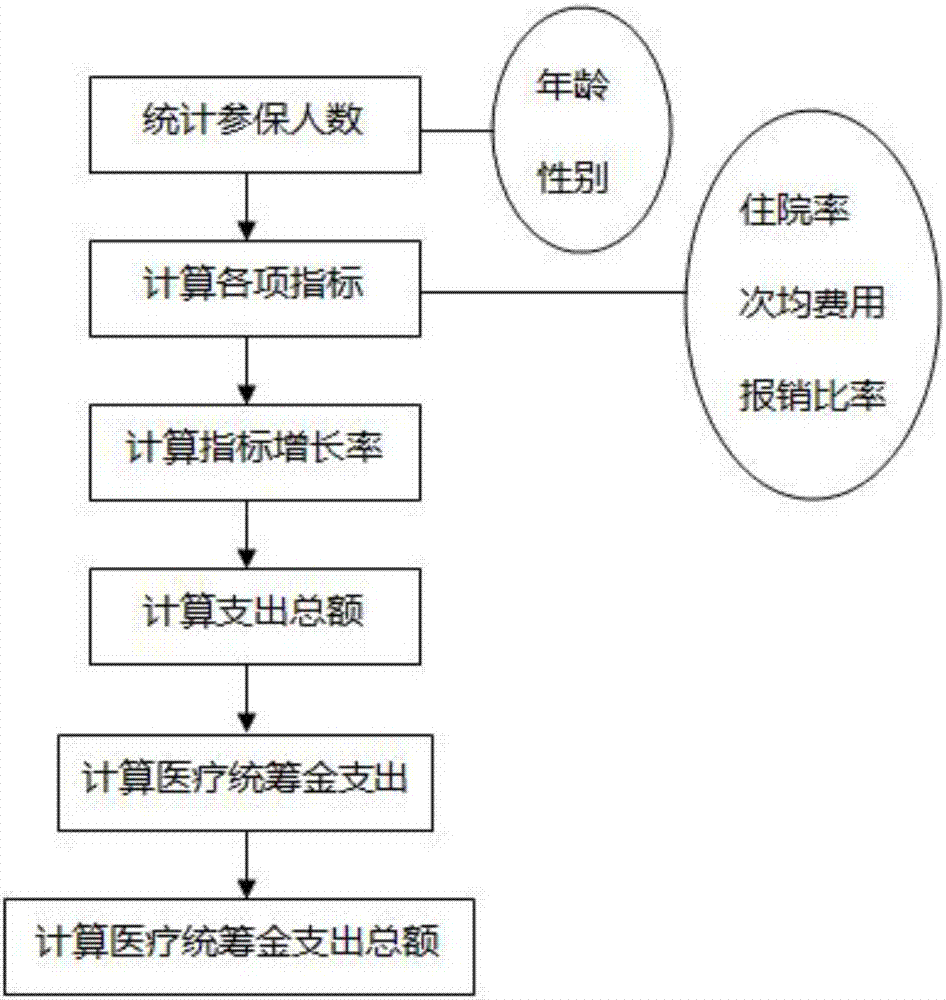
[0046] An employee medical insurance fund expenditure balance algorithm includes an expenditure algorithm and an income algorithm, and the steps of the expenditure algorithm are:
[0047] S11: Count the number of insured persons;
[0048] S12: Calculate the index of the number of insured persons;
[0049] S13: Calculate the index growth rate;
[0050] S14: calculate the total expenditure;
[0051] S15: Calculate medical pooling fund expenditure;
[0052] S16: Calculate the total expenditure of the medical pooling fund;
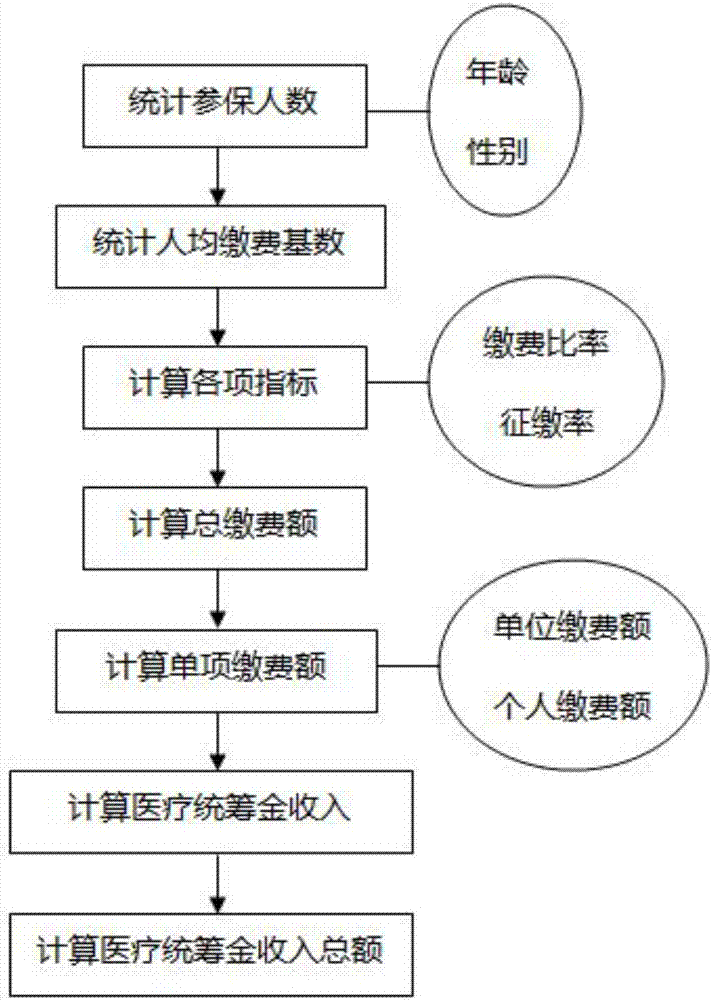
[0053] The steps of the income algorithm described are:
[0054] S21: Count the number of insured persons;
[0055] S22: Statistics per capita payment base;
[0056] S23: calculating various indicators;
[0057] S24: Calculate the total payment amount;
[0058] S25: Calculate the individual payment amount;
[0059] S26: Calculate medical pooling fund income;
[0060] S27: Calculate the total income of the medical pooling fund;
[0061]Wherein, the s...
Embodiment 2
[0071] Before using the general employee medical insurance fund expenditure balance algorithm of the present invention, it is necessary to classify and collect statistics on various indicators and summarize them. The basic data that needs to be counted include: number of insured persons, average cost per time, reimbursement rate, hospitalization rate, etc.
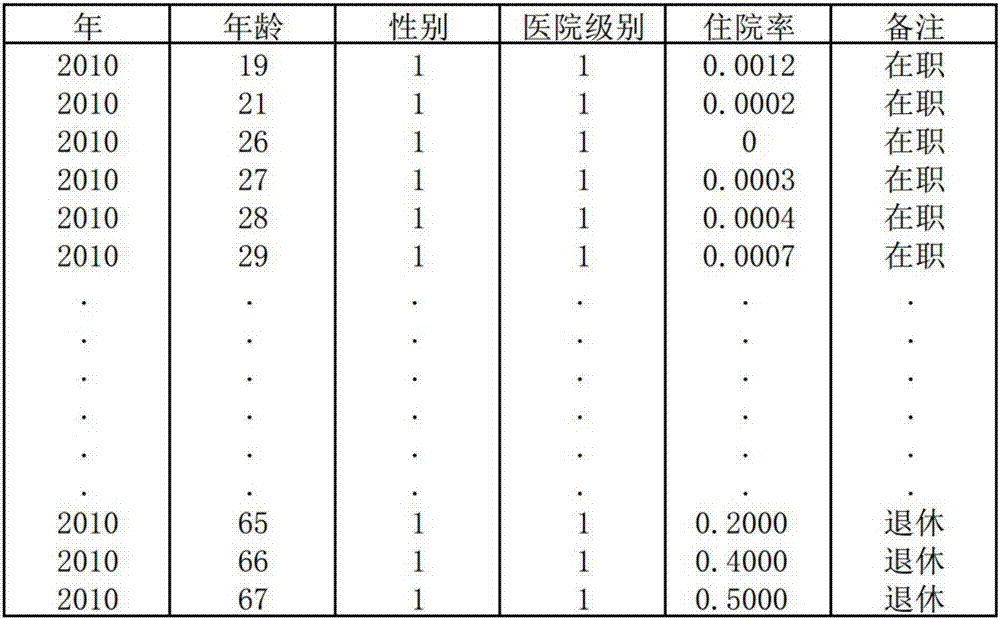
[0072] First, classify the average cost, reimbursement rate, and hospitalization rate according to age (1-100 years old), gender (male, female), and employment status (active, retired, and resigned). image 3 Describes the statistical situation of the hospitalization rate in 2010, and statistics the hospitalization rate according to the year, age, gender, and hospital level.
[0073] Second, fill in the missing parts of the data, such as age, gender, etc., so that each set of data includes data from age 1 to 100. Figure 4 is to complete image 3 The full data plot of the missing age distribution in , including statistic...
Embodiment 3
[0077] After the data is summarized and counted, the data is calculated to predict the expenditure of the medical insurance fund.
[0078] First, classify the data:
[0079] (1) Average cost per time: regression algorithm;
[0080] (2) Reimbursement ratio: geometric mean, maximum value, minimum value, using the mean square error method to remove singular points;
[0081] (3) Hospitalization rate: harmonic mean, maximum value, and minimum value, using the mean square error method to remove singular points;
[0082] (4) Overall result: Arima time-series analysis, using the smoothing index method to smooth the forecast data.
[0083] For the reimbursement rate and hospitalization rate, the maximum value and the minimum value are taken because these rates do not change much, and the channel shape made by taking the large and small values can be used for scenario analysis for decision-making.
[0084] As for the average cost per visit, since the average cost per visit in diffe...
PUM
 Abstract
Description
Claims
Application Information
 - R&D
- Intellectual Property
- Life Sciences
- Materials
- Tech Scout
- Unparalleled Data Quality
- Higher Quality Content
- 60% Fewer Hallucinations
Browse by: Latest US Patents, China's latest patents, Technical Efficacy Thesaurus, Application Domain, Technology Topic, Popular Technical Reports.
© 2025 PatSnap. All rights reserved.Legal|Privacy policy|Modern Slavery Act Transparency Statement|Sitemap|About US| Contact US: help@patsnap.com


