
Method and device for displaying graphs in graphs

A display method and a technology of a display device, which are applied in the information field, can solve problems such as display freezes, and achieve the effects of reducing complexity, improving display efficiency, and avoiding display freezes

Active Publication Date: 2019-11-12
ADVANCED NEW TECH CO LTD
View PDF6 Cites 0 Cited by
  • Summary
  • Abstract
  • Description
  • Claims
  • Application Information

AI Technical Summary

Problems solved by technology

[0004] In view of this, the embodiments of the present invention provide a method and device for displaying graphics in a chart, the main purpose of which is to solve the problem of display lag when displaying selected graphics in a chart

Method used


Image

  • Method and device for displaying graphs in graphs
  • Method and device for displaying graphs in graphs
  • Method and device for displaying graphs in graphs

Examples


Embodiment Construction

[0026] Exemplary embodiments of the present disclosure will be described in more detail below with reference to the accompanying drawings. Although exemplary embodiments of the present disclosure are shown in the drawings, it should be understood that the present disclosure may be embodied in various forms and should not be limited to the embodiments set forth herein. Rather, these embodiments are provided for more thorough understanding of the present disclosure and to fully convey the scope of the present disclosure to those skilled in the art.

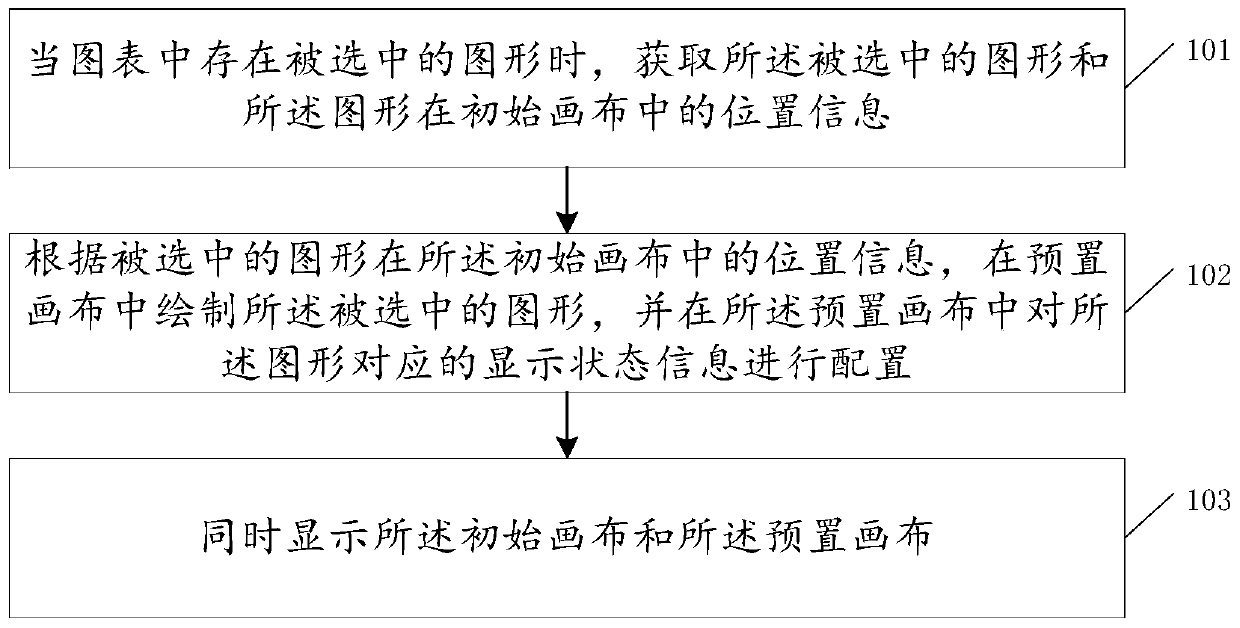
[0027] A method for displaying graphics in charts provided by an embodiment of the present invention, such as figure 1 As shown, the method includes:

[0028] 101. When there is a selected graphic in the chart, acquire the selected graphic and position information of the graphic in the initial canvas.

[0029] Wherein, the initial canvas is an underlying layer used to bear all the graphics in the chart to be displayed, and the gra...


PUM


Abstract

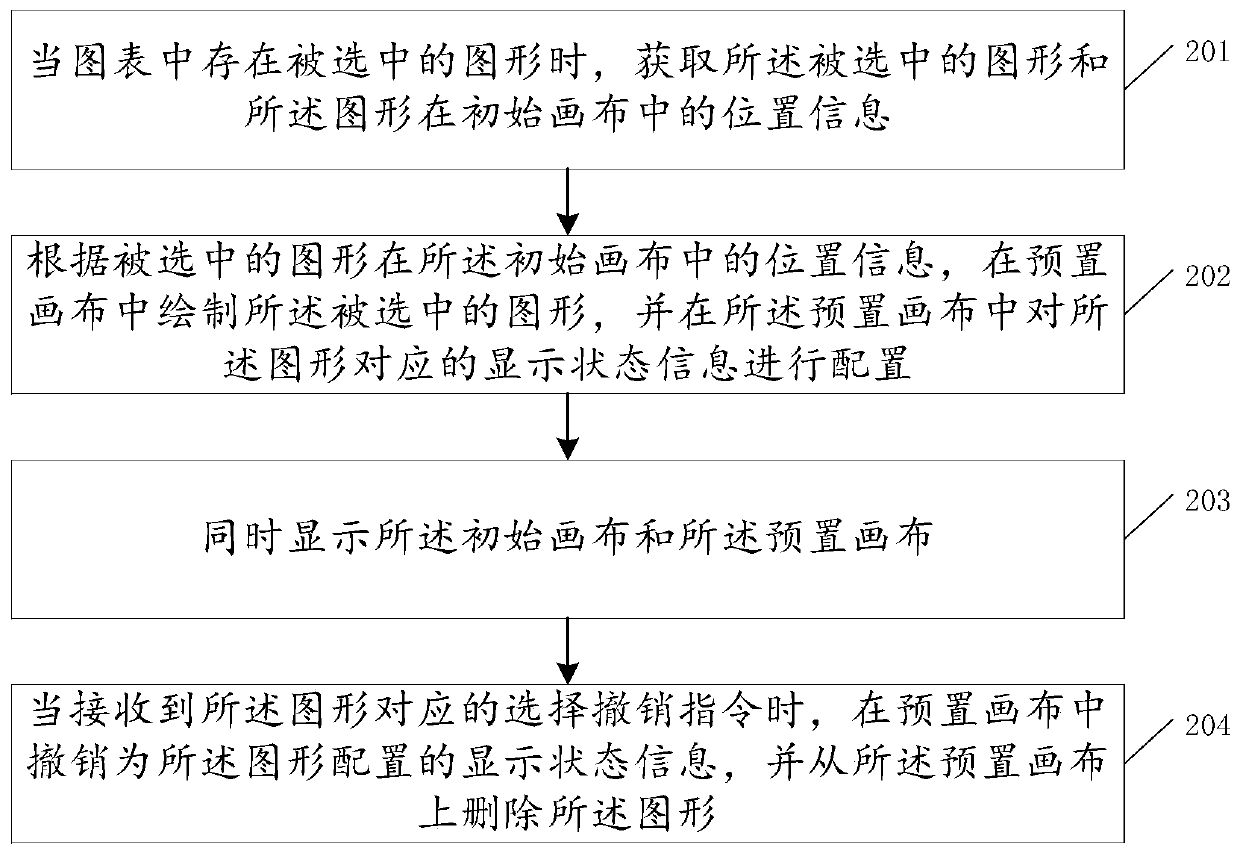
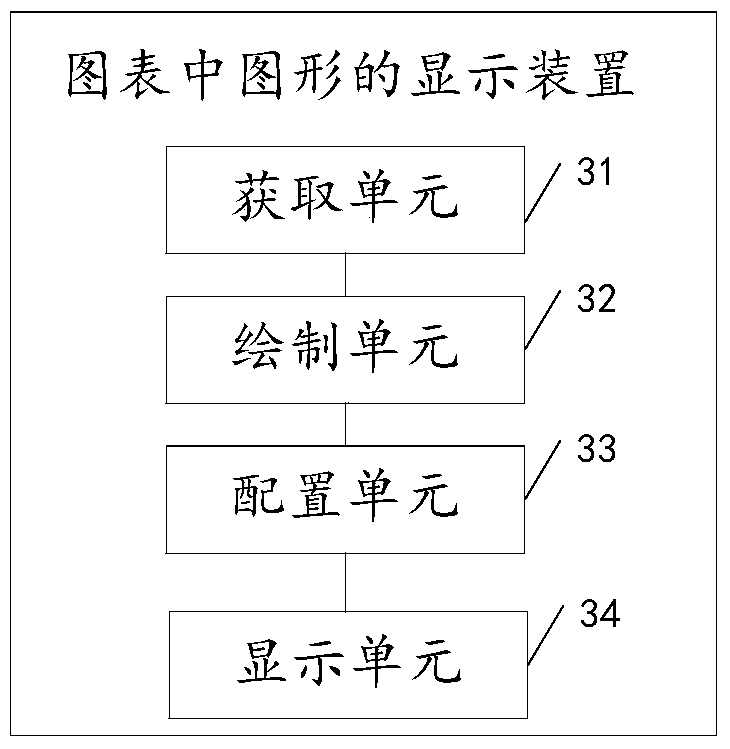
The invention discloses a method and device for displaying graphs in a diagram and relates to the field of information technology. The method and device for displaying graphs in a diagram can increase the displaying efficiency of selected graphs, reduce the display complexity of selected graphs and therefore avoid the problem of unsmooth displaying of selected graphs in a diagram. The main technical scheme of the invention is: when there is any selected graph in a diagram, obtaining the selected graph and the position information of the graph in an initial canvas; then, drawing the selected graphs in a preset canvas according to the position information of the graph in the initial canvas and configuring the display status information corresponding to the graph in the preset canvas; finally, simultaneously displaying the initial canvas and the preset canvas. The method and device of the invention are mainly aimed at displaying selected graphs in a diagram.

Description

technical field [0001] The invention relates to the field of information technology, in particular to a method and device for displaying graphics in charts. Background technique [0002] Charts are one of the important means of visually displaying data. Different graphics in the chart can be used to visually display different data, and the graphics on the chart are usually displayed through the canvas. Wherein, the canvas is a layer that hosts the graphics in the chart to be displayed. In order to better visualize the data through the chart, the graphic selected by the user in the chart can be specially displayed. For example, when the user selects a certain graphic in the chart by moving the mouse, the graphic can be highlighted. [0003] At present, every time a graph selected by the user on the canvas corresponding to the chart is specially displayed, the entire canvas corresponding to the chart needs to be redrawn, that is, all the graphics of the chart in the canvas ar...

Claims


Application Information

Patent Timeline
Patent Type & Authority Patents(China)
IPC IPC(8): G06F3/14
CPCG06F3/1407
Inventor 董晓庆
Owner ADVANCED NEW TECH CO LTD
Learn More