System and method for realizing data visualization
A technology for implementing systems and data, applied in the fields of electrical digital data processing, visual/graphic programming, creating/generating source code, etc.
- Summary
- Abstract
- Description
- Claims
- Application Information
AI Technical Summary
Problems solved by technology
Method used
Image

Examples
Embodiment 1
[0034] In this embodiment, the present invention provides a system for realizing data visualization, which includes:
[0035] The first front-end interface is provided with a control area, a canvas editing area and a tool operation area;
[0036] The first monitoring controller is used to monitor the drag operation behavior of the button element set in the control area; when the mouse release behavior operation is detected, the drag operation of the button element is ended, and the current mouse position is in the canvas editing area During the process, the code for rendering the multimedia control corresponding to the dragged button element is generated on the canvas editing area; wherein, the multimedia control corresponding to the dragged button element is a chart tool control; the chart tool control The code is used to generate chart tools;
[0037] The generated chart tool includes a second front-end interface and a second monitoring controller;
[0038] The second fron...
Embodiment 2
[0061] In this embodiment, a data visualization implementation method includes the following steps:
[0062] Monitor the drag operation behavior of the button elements set in the control area;
[0063] When the mouse release behavior operation is detected to end the dragging operation of the button element, and the current mouse position is in the canvas editing area, the code for rendering the multimedia control corresponding to the dragged button element is generated on the canvas editing area; Wherein, the multimedia control corresponding to the dragged button element is a chart tool control; the code of the chart tool control is used to generate a chart tool;
[0064] The generated chart tool includes a second front-end interface and a second monitoring controller;
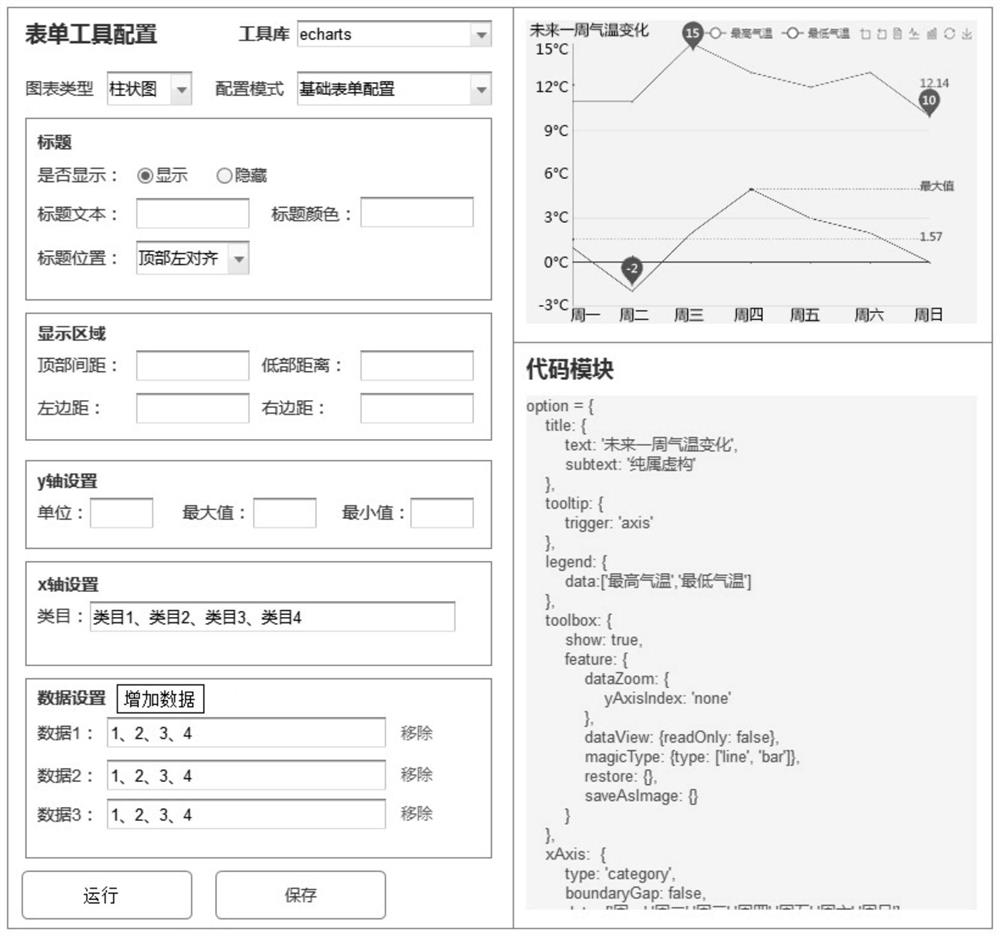
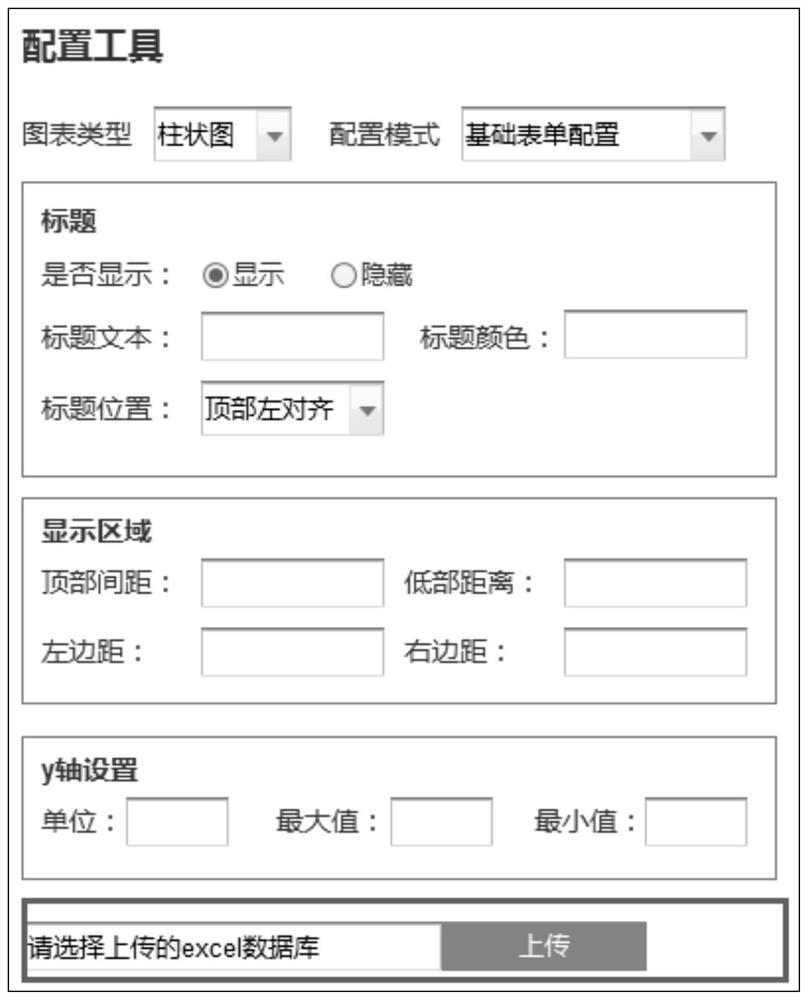
[0065] The second front-end interface is provided with a form configuration area for providing a chart configuration parameter form, a chart rendering area for rendering a corresponding chart according to the...
Embodiment 3
[0071] The above embodiments are further described in conjunction with this preferred embodiment, that is to say, all the content in this embodiment is applicable to the above embodiment 1 and embodiment 2.
[0072] A data visualization implementation system of the present invention, the specific implementation steps are as follows.
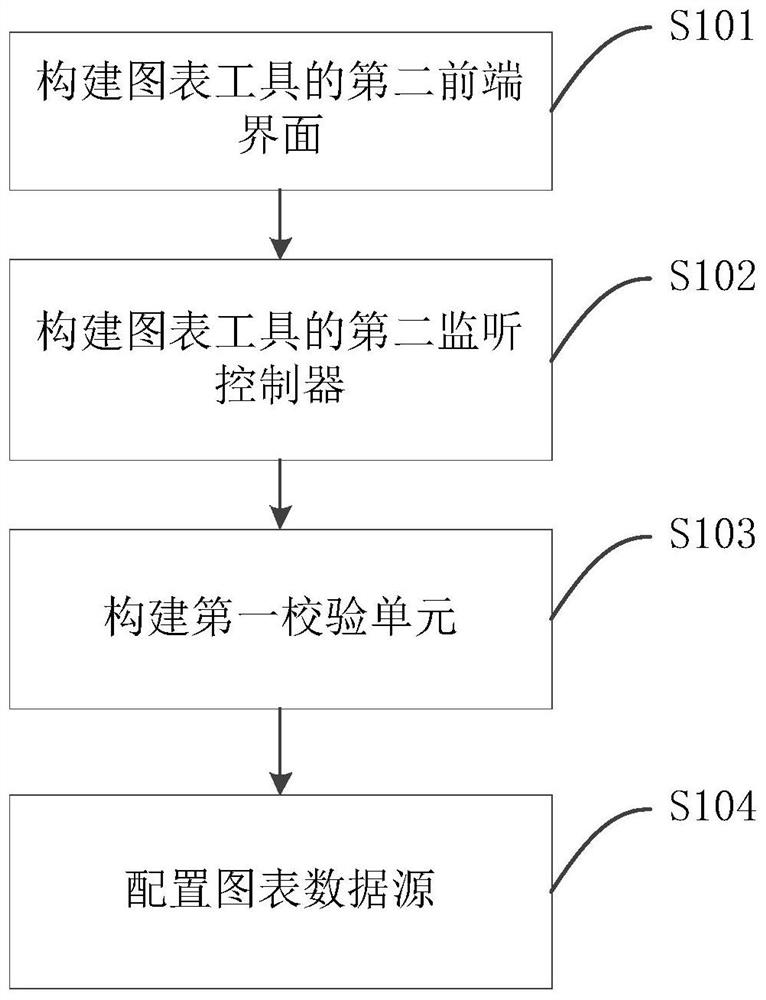
[0073] Part 1: Building a chart tool for visual editing. The implementation steps included in this section are as follows figure 1 shown.
[0074] S101. Build a second front-end interface of the chart tool, where the second front-end interface specifically refers to a visual editing interface.
[0075] In this embodiment, the configuration method of the chart tool to be built is to dynamically generate corresponding configuration items according to the user's operation, and then guide the user to perform corresponding operations according to the prompts, so that the configuration can be completed through form input Parameter configuration requ...
PUM
 Abstract
Description
Claims
Application Information
 - R&D
- Intellectual Property
- Life Sciences
- Materials
- Tech Scout
- Unparalleled Data Quality
- Higher Quality Content
- 60% Fewer Hallucinations
Browse by: Latest US Patents, China's latest patents, Technical Efficacy Thesaurus, Application Domain, Technology Topic, Popular Technical Reports.
© 2025 PatSnap. All rights reserved.Legal|Privacy policy|Modern Slavery Act Transparency Statement|Sitemap|About US| Contact US: help@patsnap.com