
Progressive information visualization generation method for operation drive

A progressive, coding operation technology, applied in the field of visualization, can solve the problems of insufficiency, lack, and high threshold for the use of programming tools, and achieve the effect of reducing learning costs and expanding design exploration space.

Active Publication Date: 2018-07-06
ZHEJIANG UNIV
View PDF3 Cites 0 Cited by
  • Summary
  • Abstract
  • Description
  • Claims
  • Application Information

AI Technical Summary

Problems solved by technology

[0003] Various visualization effects and interactions can be created through information visualization programming libraries, such as D3, etc., but the threshold for using programming tools is relatively high, and users need to have sufficient visualization expertise and programming skills to efficiently create visual charts; On the one hand, template-based charting tools are easy to use, but lack flexibility, and can only complete various charts with pre-set templates, which cannot meet the needs of all users
[0004] At the same time, while these tools reduce the difficulty for users to create visualization results, they cannot provide users with sufficient guidance on the method of data processing and the choice of visual design
To this end, some researchers have designed automated recommendation tools with visual results. These tools can recommend feasible solutions for users, but there is still a lack of methods to help users understand their processes and decision criteria.

Method used


Image

  • Progressive information visualization generation method for operation drive
  • Progressive information visualization generation method for operation drive

Examples


Embodiment Construction

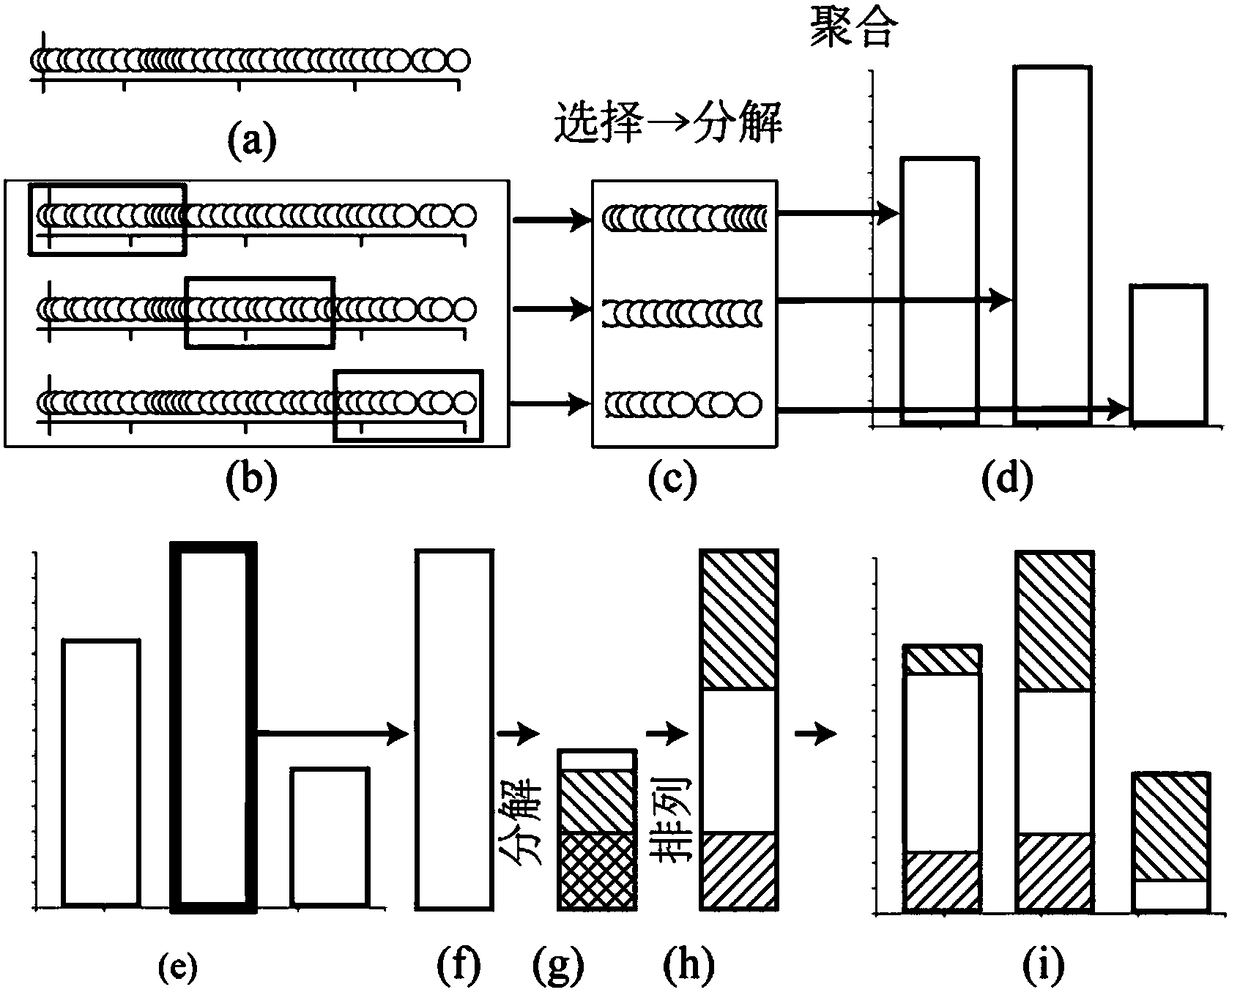
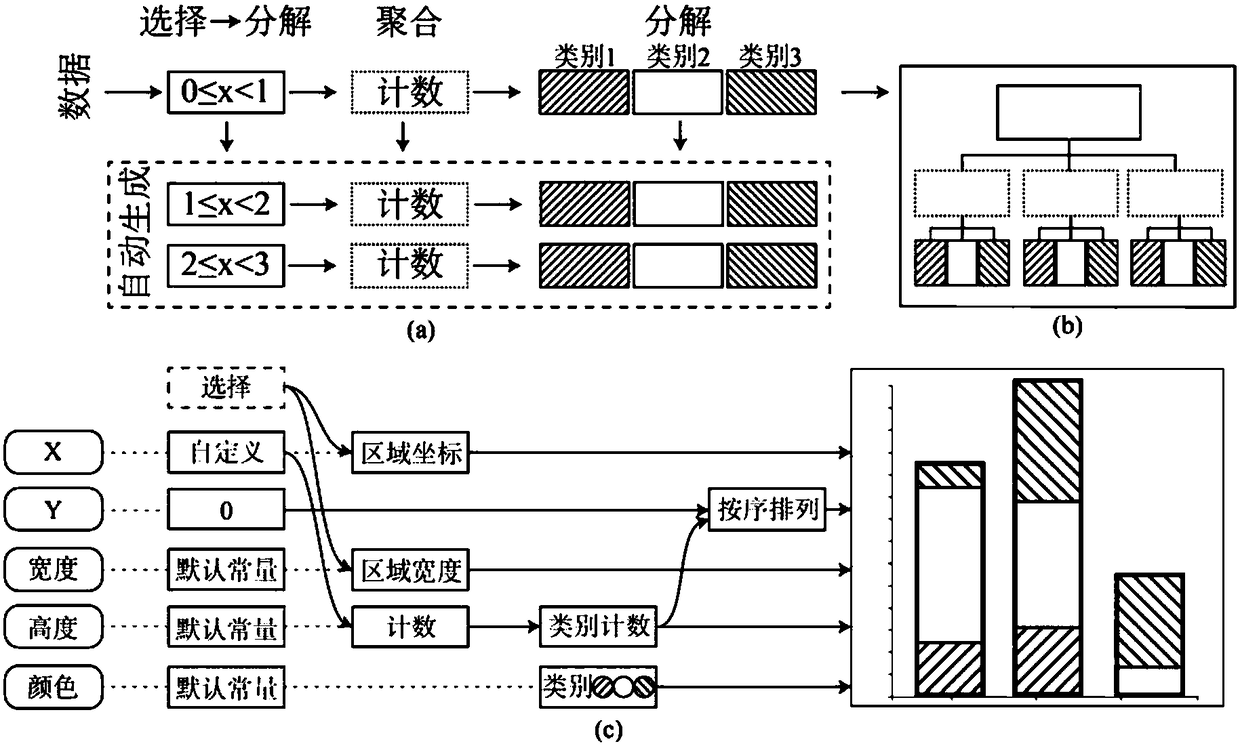
[0044]The user decomposes the task into subtasks, and there are multiple solutions for each subtask. The decomposition of the task and the alternatives at each step constitute a map for the user to explore the design space. Users can add new nodes to this graph, or try different branches for exploratory visual design.

[0045] To this end, the visual expression of information is abstracted into a state, and the change of the visual design is regarded as the transition between states to form a state machine model. The existing design space is expanded by the transfer of the existing state, and different sub- Task solutions and design proposals.

[0046] Among them, the state is defined as a quadruple composed of data and data corresponding data transformation, visual mapping and view transformation, expressed as (D, T, M, V), where:

[0047] D represents the data being manipulated and displayed;

[0048] T represents a collection of data transformations, such as sorting, samp...


PUM


Abstract

The invention discloses a progressive information visualization generation method for an operation drive. The progressive information visualization generation method includes (1), dividing a task intosub tasks, and setting multiple solutions for each sub task; (2), visualizing task division in the step (1) and combination of selectable solutions of each sub task to acquire a design space exploration map; (3), in the design space exploration map, selecting the solutions of each sub task to complete the task; (4), outputting a final result in a visualized mode. Compared with methods for visualprogramming frames in pure programming, the progressive information visualization generation method has the advantages that a WYSIWYG (what you see is what you get) editing function and a friend userinteraction interface are provided, and users are guided to explore the feasible solutions orderly through division and gradual realization of visible tasks. Compared with template customization, a progressive design model has the advantages that larger design exploration space can be provided, and more complicated graphic design can be completed through constant operation iteration.

Description

technical field [0001] The invention relates to the field of visualization, in particular to an operation-driven progressive information visualization generation method. Background technique [0002] Information visualization is widely used in various fields, and practitioners in all walks of life, including data analysts, journalists, designers, etc., need it to discover and disseminate information contained in data. A variety of information visualization construction tools provide a wealth of means to create information visualization views. [0003] Various visualization effects and interactions can be created through information visualization programming libraries, such as D3, etc., but the threshold for using programming tools is relatively high, and users need to have sufficient visualization expertise and programming skills to efficiently create visual charts; On the one hand, template-based charting tools are easy to use, but lack flexibility, and can only complete v...

Claims


Application Information

Patent Timeline
Patent Type & Authority Applications(China)
IPC IPC(8): G06F8/34G06F8/38
CPCG06F8/34G06F8/38
Inventor 陈为梅鸿辉魏雅婷马昱欣
Owner ZHEJIANG UNIV
Learn More